LEABHARLANN CHOLAISTE NA TRIONOIDE, BAILE ATHA CLIATH TRINITY COLLEGE LIBRARY DUBLIN
OUscoil Atha Cliath The University of Dublin
Terms and Conditions of Use of Digitised Theses from Trinity College Library Dublin
Copyright statement
All material supplied by Trinity College Library is protected by copyright (under the Copyright and Related Rights Act, 2000 as amended) and other relevant Intellectual Property Rights. By accessing and using a Digitised Thesis from Trinity College Library you acknowledge that all Intellectual Property Rights in any Works supplied are the sole and exclusive property of the copyright and/or other I PR holder. Specific copyright holders may not be explicitly identified. Use of materials from other sources within a thesis should not be construed as a claim over them.
A non-exclusive, non-transferable licence is hereby granted to those using or reproducing, in whole or in part, the material for valid purposes, providing the copyright owners are acknowledged using the normal conventions. Where specific permission to use material is required, this is identified and such permission must be sought from the copyright holder or agency cited.
Liability statement
By using a Digitised Thesis, I accept that Trinity College Dublin bears no legal responsibility for the accuracy, legality or comprehensiveness of materials contained within the thesis, and that Trinity College Dublin accepts no liability for indirect, consequential, or incidental, damages or losses arising from use of the thesis for whatever reason. Information located in a thesis may be subject to specific use constraints, details of which may not be explicitly described. It is the responsibility of potential and actual users to be aware of such constraints and to abide by them. By making use of material from a digitised thesis, you accept these copyright and disclaimer provisions. Where it is brought to the attention of Trinity College Library that there may be a breach of copyright or other restraint, it is the policy to withdraw or take down access to a thesis while the issue is being resolved.
Access Agreement
By using a Digitised Thesis from Trinity College Library you are bound by the following Terms & Conditions. Please read them carefully.
A u dio Signal A n alysis for C lassification and Source
L ocalization in e-L earning A p p lication s
D eep ti Singh
A thesis subm itted to the University of Dublin, T rinity College
in fulfillment of th e requirem ents for the degree of
D octor of Philosophy
I^ T R IN IT Y C O L L E G ^ ^ I 2 7 MAY 2008
l i b r a r y DUBLIN
^
A udio Signal A nalysis for C lassificatio n a n d S ource
L o calizatio n in e -L earn in g A p p lic a tio n s
A p p roved by
D ecla ra tio n
I, the undersigned, declare th a t this work has not previously been su b m itted as an
exercise for a degree a t this or any other University, it is entirely my own work and I
agree th a t the Library may lend or copy th e thesis upon request.
Deepti SiMh
A ck n ow led gem ents
I would like to express my gratitude to my thesis supervisor Prof. Prank Boland for
his guidance, patience and help. I would also like to thank Trinity College, Dublin
for giving me an opportunity to be a part of the college, for the scholarship and great
facilities. I am also grateful to Enterprise Ireland and Science Poundation Ireland for
their financial support.
I also would like to thank the Electronic and Electrical Engineering Departm ent for
their support. I am grateful to the School of Computer Science and Statistics for the
Post-G raduate diploma in Statistics course. Special thanks to Dr. Myra O ’ Reagen,
Dr. Cathal Walsh, Dr. Brendan Murphy and Ms. Aideen Keaney for their great
teaching and support.
I would like to thank my husband, Dr. Atul Singh, for constructive criticism th at
improved my work and for his inputs throughout my work and thesis writing phase. I
also would like to thank him for the encouragement, help and support. I also would
like to thank my parents, Dr. Paujdar Singh and Dr. A nita Singh, for motivating
me, listening to me, encouraging me, providing me an opportunity to grow, doing
everything th at is in my best interest and making me what I am. I would like to thank
my sister, brother and brother-in-law for encouraging me and being there for me when
I needed them. Special thanks to my niece Aarushi for her smiling photographs th at
encouraged me to work with a smile.
co-operation. I would like to especially thank Bernedette Clerkin, Mrs. Subhadra Rao
and Dr. Hanum antha Rao for their help, advice and support.
A b stract
E-learning provides an opportunity for the students in a classroom to reccive and par
ticipate in lectures broadcasted from a remote location. For convenience and scalability
it is preferable to have a microphone array instead of an individual microphone per user
to capture the signals. A Direction of Arrival (DOA) system can be used to determine
the angle of arrival of the speech signal so th a t a camera can be steered in the direction
of the signal source. In a DOA system for e-learning, Time Delay Estim ation (TDE)
techniques are suitable to determine the relative time difference between the signals
to reach the microphones in the array. This time difference can be used to find the
Direction of Arrival (DOA) of the signal. This thesis presents a DOA system called
Modified yIN based Doa Estim ator for e-leaRning (MINDER).
al-gorithm proposed by Chen et al. [32]. Simulations presented in this thesis show th at
the modified YIN based TD E algorithm has higher accuracy for TDE when compared
to WCC, Weighted YIN based TDE and GCC-PHAT algorithms in presence of high
noise and reverberation. Its accuracy for TDE is comparable and marginally better
than the contemporary Modified Average Magnitude Difference Function (MAMDF)
algorithm proposed by Chen et al. [32]. The performance of the Weighted YIN based
TD E algorithm is similar to the WCC and GCC-PHAT algorithm. MINDER uses the
modified YIN based TDE algorithm for TDE.
C ontents
A c k n o w le d g e m e n ts
i
S u m m a r y
ii
L ist o f F ig u r es
ix
L ist o f T a b les
x i
C h a p te r 1 I n tr o d u c tio n
1
1.1
Learning E n v iro n m e n t...
2
1.2
DOA s y ste m ...
5
1.2.1
Voice Activity D e te c tio n ...
6
1.2.2
Direction of Arrival E s t i m a t i o n ...
8
1.3 C o n trib u tio n s ...
9
1.4
Thesis O u tlin e ...
10
C h a p te r 2 S ta te o f th e A rt: D ir e c tio n o f A rrival E stim a tio n for S ou rce
L o ca liza tio n .
12
2.1
Signal Model ...
13
2.2
Angle of a r r i v a l ...
16
2.3
Spatial A lia s in g ...
18
2.5
Parabolic In te rp o la tio n ...
21
2.6
Classroom Environment ...
23
2.7
Direction Of Arrival Algorithm T a x o n o m y ...
24
2.8
Steered Beamformer Based A lg o rith m s ...
25
2.8.1
Delay and Sum B eam fo rm er...
27
2.8.2
Frequency Domain Beamforming ...
29
2.9
High Resolution Spectral Estimation Based
A lgorithm s...
32
2.9.1
Subspace T e c h n iq u e s...
32
2.10 Time Difference Of Arrival Based Algorithms ...
34
2.10.1 C ro ss-c o rre latio n ...
35
2.10.2 GCC based a lg o rith m s ...
37
2.10.3 Average Magnitude Difference Function ( A M D F ) ...
44
2.10.4 O t h e r s ...
46
2.11 Discussion and Conclusions ...
47
2.12 The YIN A lg o rith m ...
49
2.13 Summary ...
52
C h a p ter 3 S ta te o f th e A rt: V o ice A c tiv ity D e te c tio n
53
3.1 Voice Activity Detection (VAD) System
...
53
3.2
Speech Signal Characteristics ...
54
3.3
Audio Signal Features ...
57
3.4
Feature Selection for Classification ...
68
3.4.1
Feature S e le c tio n ...
69
3.4.2
Backward and Forward selection...
72
3.5
Classifier for Voice Activity D etectio n ...
74
3.6
Classification Using Supervised Machine Learning Algorithms ...
77
3.6.2
Bayes Decision T h e o r y ...
79
3.6.3
Supervised Machine Learning A lgorithm s...
80
3.7
Summary ...
92
C h a p te r 4
D O A S tu d ie s
93
4.1
YIN for T D K ...
93
4.2
Weighted Y I N ...
96
4.3
Performance Evaluators for Time Delay
E s t i m a t o r ...
96
4.4
Simulation S e t u p ...
97
4.5
Simulation R e s u l t s ... 100
4.6
Observations and Conclusion...112
C h a p te r 5
VAD F e a tu re S e le c tio n S tu d ie s
116
5.1
Mel-Spectrum Teager Energy Coefficients... 117
5.2
S e tu p ... 119
5.3
Supervised Machine Learning Algorithm Selection for V A D ... 120
5.4
Features and Feature Selection R e s u l t s ... 122
5.5
VAD Four Class Classification Results ... 124
5.6
Observations and Conclusion...130
C h a p te r 6
D O A S y ste m
132
6.1
Experimental S e tu p ... 132
6.2
Direction of Arrival System Experimental
R e s u lts ...135
6.3
C onclusion... 140
7.2 Future Work
List o f Figures
1.1
Schematic diagram of th e DOA System ...
5
2.1
D irection Of Arrival (DOA) estim ation...
16
2.2
Exam ple of Spatial A l i a s i n g ...
19
2.3
Delay and Sum Beamformer...
28
3.1
Schematic diagram of the VAD System ...
54
3.2
Voiced (left) and Unvoiced (right) Speech S i g n a l s ...
55
3.3
Power Spectral Density for Voiced and Unvoiced Speech Signals . . . .
57
3.4
Relation between the signal frequency in Hz and perceived signal fre
quency in Mel u n its
66
3.5
Plot of 2-dimensional G aussian D istribution...
78
3.6
Exam ple of separable problem of SVM in a 2 dimensional space . . . .
87
4.1
Source locations for sim ulations...
98
4.2
Plot for female speaker w ith microphone separation (d) = 3.4 cm
. . . 101
4.3
P lot for female speaker w ith microphone separation (d) = 6.8 cm
. . . 102
4.4
P lot for female speaker w ith microphone separation (d) = 10.2 cm . . . 103
4.5
Plot for female speaker with microphone separation (d) = 3.4 cm
. . . 104
4.6
Plot for female speaker with microphone separation (d) = 6.8 cm
. . . 105
4.8
Plot for male speaker with microphone separation (d) = 3.4 cm . . . . 107
4.9
Plot for male speaker with microphone separation (d) = 6.8 cm . . . . 108
4.10 Plot for male speaker with microphone separation (d) = 10.2 cm . . . . 109
4.11 Plot for male speaker with microphone separation (d) = 3.4 cm . . . . 110
4.12 Plot for male speaker with microphone separation (d) = 6.8 cm . . . . I l l
4.13 Plot for male speaker with microphone separation (d) = 10.2 cm . . . . 113
6.1 Source locations for DOA system experiment...133
6.2 VAD Experimental results classifying the audio signal into Voiced Speech
(VS) and others (consisting of the unvoiced speech, stationary noise and
the non-stationary noise signals)... 135
6.3 Position 1: TDE results
for
source at
57°...137
6.4 Position 2: TDE results
for
source at
90°...138
List o f Tables
3.1 Center frequency of 20 critical b a n d s ...
65
4.1 Delay values in signal sample number and their corresponding source
angles for different separation between microphone pair (d) at sampling
frequency = 1 6 k H z ...
99
5.1
The Hit Rate (HR) and False Alarm Rate (FAR) for classifying the test
data into four classes... 121
5.2 The hit rate (HR), false alarm rate (FAR) for each class and overall hit
rate for LDA at SNR of 10 dB ...125
5.3 The hit rate (HR), false alarm rate (FAR) for each class and overall hit
rate for LDA at SNR of 15 dB...126
5.4 The hit rate (HR), false alarm rate (FAR) for each class and overall hit
rate for LDA at SNR of 20 dB...127
5.5 The hit rate (HR), false alarm rate (FAR) for each class and overall hit
rate for Radial SVM at SNR of 10 dB... 128
5.6 The hit rate (HR), false alarm rate (FAR) for each class and overall hit
rate for Radial SVM at SNR of 15 dB ... 129
5.7 The hit rate (HR), false alarm rate (FAR) for each class and overall hit
C hapter 1
In trod u ction
E-learning provides an opportunity for the students in remote classrooms to actively
participate in the lectures broadcasted from the main classroom. A Microphone Array
(MA) is used to capture the audio signal. The knowledge of the Direction Of Arrival
(DOA) of the source signal is used to steer the video camera in the direction of the
signal source. The geometry of the microphone array can be used to find the source
location. Detecting the presence of speech in the audio signal (voice activity detection)
so th a t the DOA estimation is performed only on parts of audio signal containing
speech reduces the number of DOA computations and also prevents the steering of the
video camera in the direction of undesired signal sources.
1.1
E -L earning E nvironm ent
This section focuses on the e-learning environment, on which the entire work of this
thesis is based. In an e-learning environment a group of classrooms are connected to
gether through the internet. The lecturer is present in any one of the classrooms. For
convenience the room where the lecturer is present is called the principal classroom
and the other classrooms are called the remote classrooms. The principal classroom
is connected to the remote classrooms through the Internet th a t transm its the audio
and video d ata of the lecture being delivered in the principal classroom. The commu
nication between the classrooms is typically duplex so th at the students in the remote
classrooms not only attend the lecture remotely but also benefit from the interaction
with the lecturer in the principal classroom. This arrangement is convenient for the
students as they do not have to travel or relocate to gain knowledge. It also encourages
collaboration between educational institutes by providing more options for the students
to explore different courses offered to them.
E x istin g T ools
Echalk [2, 59] is another powerful e-learning tool th at uses an electronic whiteboard
instead of a chalkboard, a digitizer tablet connected to a computer and a retroprojec-
tion system in a classroom. The whiteboard is used instead of a chalkboard to write
and draw directly on the screen. The digitizer tablet can also be used to write on the
screen. It also provides features such as plotting m athem atical functions on the screen,
evaluating handw ritten m athem atical expression in real time using handwriting recog
nition, displaying pictures from internet or a computer. The lectures are recorded so
th a t the student can listen to them later. Students in remote classrooms are provided
with the live feed of the lecture th at they can access using a Java enabled web browser.
The students can view the lecturer on the screen and hear the lecture. It also facilitates
a printable PD F version of the content of the screen so th at students can concentrate
on understanding the lecture instead of trying to take notes.
C la ssr o o m s for e-learn in g
In e-learning case where educational institutes allocate rooms at the time of the lecture
so th a t a group of students can listen to the lecture in a classroom with live feed from
the principal classroom, the challenge in such a scenario is to localize the student
interacting with the lecturer. Classroom protocol requires th a t there is only one talker
in the room at any instant. This means th at when the lecturer is talking then the
rest of the audience members are listening and when the lecturer is interacting with
the audience members then only one member of the audience speaks at any instant.
Assuming th a t the classroom protocol is adhered to, then at any given instant there
will be only one speech source in the room.
location from which the cue to speak was received. This system though simple and
efficient requires lot of hardware which is expensive and prone to frequent damage as
it is in direct contact with the audience members.
Another approach is to use a microphone array to capture the signal and estim ate
the Direction Of Arrival (DOA) and the source location based on the geometry of the
microphone array [27, 79]. In such a system, the DO A of the speech signal is estim ated
on the signals captured by a microphone array located away from the audience. The
relative time difference of arrival of the signal to reach a pair of microphones in the
microphone array is used to find the DOA of the signal. The DOA estim ates obtained
from different pairs of microphones can be used to locahze the speech source and steer
the camera in the direction of the speech source. This thesis concentrates on source
localization using DOA for an e-learning environment.
The problem associated with finding the direction of arrival of the signal is the
presence of noise and reverberation in the room th at tends to give rise to errors in
the Direction Of Arrival (DOA) estimates. Excessive levels of noise and reverberation
also reduce the comprehensibility of speech. This problem is worsened among students
with hearing disability. American Speech Language Hearing Association (ASHA) [4]
and the Acoustical Society of America [100] recommend th at the Signal to background
Noise Ratio (SNR) in a classroom should not be less than 10 dB and for students with
some hearing impairment it should not be less than 15 dB. Similarly the recommended
reverberation time for classrooms is 0.4 - 0.6 seconds [100].
-
4
-M A Signal Preprocessor > TDE A n ^
estimation
Direction o f Sigtml Source
F ig. 1.1 : Schematic diagram of the DOA System.
arrival and the camera will be steered in the direction of the background noise source.
Other undesirable signals include human produced sounds such as laugh, cough and
sneeze and non-human produced sounds like paper shuffle, closing/opening of the door,
key jangle and sounds from coins. In order to avoid computation of the DOA in the
absence of speech signal a voice activity detection (VAD) system is used to recognize
segments of signal th a t contain speech. The location of the source is estim ated only
on the segments of signal identified as speech. This reduces computations as well as
prevents steering of camera at spurious locations.
1.2
D O A sy ste m
Direction Of Arrival (DOA) system is used to find the DOA of the speech signal and
steer a camera in the direction of the speech source. The DOA information can also
be used in beamforming and for source localization. The audio signal captured by the
microphone array and the distance between the microphones in the microphone array
is used to find the DOA of the source signal. Figure 1.1 shows a schematic diagram of
the proposed DOA system.
[image:23.538.40.513.36.793.2]e-leaRning (MINDER). MINDER consists of two stages namely the Voice Activity
Detection (VAD) stage for signal pre-processing and the DOA stage. The VAD system
in this work not only detects speech frames but also detects stationary noise and
non-stationary noise. The captured signal is classified into four classes namely the
voiced speech, unvoiced speech (refer to section 3.2 for more information on voiced and
unvoiced speech), stationary noise and the non-stationary noise. The DOA stage finds
the DOA of the speech source based on the relative time difference of arrival of the
speech signal received by a pair of microphones in the microphone array. As shown in
figure 1.1, the DOA stage estimates the DOA of the source in two steps namely Time
Delay Estim ation and Angle Estimation.
1.2.1
V oice A c tiv ity D e te c tio n
Pre-processing the signals to detect the presence of speech in the audio signal is useful
in speech recognition, speaker recognition and source localization applications. In some
applications th at involve noise cancellation identification of the background noise is of
primary concern. Voice Activity Detection is used to detect the presence of speech
signal in the audio signal. The characteristics of the signal called the features are
employed by a VAD algorithm to distinguish between speech and non-speech signals.
For VAD the audio signal is divided into small frames of fixed length. The values of
the features are calculated for each frame and are input to the VAD algorithm.
The type of classes th at the audio signal is classified into depends on the requirement
of the application.
VAD can be considered as a pattern classification problem. This work proposes
to use the supervised machine learning algorithms for VAD for e-learning. P attern
classification using supervised machine learning algorithms generally involves solving
two crucial problems [87, pg. 171]. They are the selection/evaluation of features
and decision rule for classification. Feature selection involves determining the signal
features th at help to distinguish between the signals. Speech signals can be described
by some of their properties. But noise signals do not have specific properties. Thus
determining a good feature set th at result in an accurate classification is a challenge.
Another challenge is to identify a classification algorithm th a t can classify the signals
well into their respective classes. A brief discussion of the key steps and the associated
challenges involved in desiging a VAD system are presented in [106].
In this work, the audio signals are classified into four classes namely the voiced
speech, unvoiced speech, stationary noise and the non-stationary noise using the Dis
criminant Analysis (DA), Support Vector Machines (SVM) and Artificial Neural Net
works (ANN). Classifying the signal into the four classes is useful for source localization
as well as post-processing e-learning.
1.2 .2
D ir e c tio n o f A rrival E stim a tio n
As shown in figure 1.1, the Direction Of Arrival (DOA) of the source signal is found in
two steps. The first step is to find the relative time delay between the signals received
by the microphone pair in the microphone array. Second step involves finding the
actual DOA based on the tim e delay information from the first step.
T im e D elay E stim a tio n
A n g le E stim a tio n
The formula used for the angle of arrival of the signal source is based on the far-field
assumption. The formula is given by [115, 91]:
microphones in the array.
1.3
C o n tr ib u tio n s
The primary contribution of this thesis is an extension of the YIN algorithm called the
modified YIN based TDE algorithm that can be used for TDE. Another extension of the
YIN algorithm called the Weighted YIN based TDE algorithm is also presented. The
thesis presents simulations comparing the performance of the modified YIN based TDE
algorithm and the Weighted Yin based TDE algorithm with other TDE algorithms like
the Generalized Cross-Correlation Phase Transform (GCC-PHAT), Modified Average
Magnitude Difference Function (MAMDF) and the Weighted Cross-Correlation (WCC)
for different SNR and fixed reverberation time.
Network (ANN) and Support Vector Machine (SVM). The seven features considered for
VAD along with MSTE and MFCC are the log energy of the signal, zero-crossing rate,
second and third Linear Predictive (LP) coefficients, absolute difference between the
first two Partial Correlation or Reflection (PARCOR) coefficients, skewness of the LP
residual signal and the spectral centroid of the signal. A DOA system called Modified
yIN based Doa Estim ator for e-leaRning (MINDER) is presented th a t combines the
VAD system based on MSTE coefficients and the modified YIN based TD E algorithm.
Experimental results for Modified yIN based Doa Estim ator for e-leaRning (MINDER)
are presented.
1.4
T h esis O utline
The remainder of the thesis is organized as follows:
C hapter
2 presents the state of the art of the DOA algorithms and explains the
YIN algorithm for fundamental frequency estimation.
C hapter 3
explains the background associated with the supervised machine learn
ing algorithms. It explains the features of the speech signal and the feature selection
process. It also describes the DA, cascade ANN and the SVM algorithms.
C hapter 4
presents the simulation results for the TDE for DOA comparing the
performance of the GCC-PHAT, contemporary Modified Average Magnitude Difference
Fimction (MAMDF) and Weighted Cross-Correlation (WCC), proposed modified YIN
based TDE algorithm and Weighted YIN based TDE algorithm.
performance of the MTSE with the features th a t were included in the feature set to
improve the classification.
C h ap ter 6
combines the VAD system of chapter
5
and the modified YIN based
TD E algorithms to form the DOA system. It presents the experimental results on
signal with VAD and parabohc interpolation.
C hapter 2
S ta te o f th e Art: D irection o f
Arrival E stim ation for Source
L ocahzation.
2.1
Signal M od el
The Signal model used in the DOA algorithms is provided in this section. The DOA
algorithms exploit the properties of the signal to estim ate the DOA of the source signal.
The signal model presented in this section is utilized by the DOA algorithm categories
mentioned in section 2.7.
Assuming th a t there is more than one signal source in the room the signal received
by the
microphone
(xi(t)) in the microphone array is represented by [91]:
Q
Xi{t) = Y ^ h i j { t )
*
S j { t )+ rii{t)
(2.1)
j = iwhere
S j { t )is the signal from the
source,
h i j { t )is the cascade of the impulse
responses of the room and the response of the
microphone for the
source,
is
the convolution operator,
rii{t) is the additive noise component and Q is the number of
signal sources. All the acoustic paths (direct and reflected signal components) between
the source and the microphone are represented by the room impulse response. The
impulse response of the room depends on the position of the microphone with respect
to the source, the characteristics of the propagation medium and contents of the room.
When the position of the source and the microphones is fixed, over short time interval
the impulse response of the room can be considered to be time-invariant [24, pg. 165].
The microphone response includes the gain of the microphone. The additive noise
component consists of the ambient noise and the noise of the microphone. The additive
noise signal and the source signal are assumed to be uncorrelated [91].
For a single source the signal received by the
microphone is given by [24, pg.
165]:
^i{t) = hi{t) *
s{t) + rii{t)
(2.2)
noise component.
For time difference of arrival computation, when interest is particularly on the direct
p ath component, the signal received by the
microphone can be rew ritten as [24, pg.
165]:
Xi{t) = — s{t - Ti) * gi{t) + rii{t)
(2.3)
riwhere rj is the distance between the source and the microphone,
Qi{t) is the impulse
response of the room due to the other reflected components and the
microphone
(consists of all the components of
h i { t )of equation 2.2 except the direct path compo
nent),
Tiis the delay due to the direct path component.
Assuming th a t the impulse response
{gi{t)) in equation 2.3 is similar for all the
microphone signals in the microphone array, the signal received by the microphones
with respect to the reference microphone in the microphone array will consist of a
scaled and time shifted version of the signal received by the reference microphone [24,
pg. 166]. Thus the signals received by the microphones with respect to the reference
microphone (/)
in the microphone array
is given by:
X i { t )
=
ttis{t - Ti - Ti^i)
+ r i i { t )
(2.4)
where
s{t —
ti)is the signal received by
the
reference microphone
I, ai is the scaling
factor for the received signal
s{t
— t i)for the
microphone,
Ti^iis the time shift (time
difference of arrival) of the signal between the reference microphone
{I) and the
microphone
(Ti —
ti).The model of the signal vector relative to the source signal
s(t — T
q)
translated to
the reference microphone / = 0, of the M element microphone array is represented by:
x(t ) =
[ao s ( t - To - To,o)ai s{t
- Tq - r o ,i)s{t - tq -
tq,2) • • •time difference of arrival of the signal between the reference microphone (^ = 0) and
the
{ M —
element of the microphone array. Since the term tq is common to all the
microphone and it does not affect the relative time difference of arrival estimates the
term can be omitted. The term ro,o is zero.
The model of the signal vector relative to the source signal
s{t) translated to a
reference element 0 of the array in equation 2.5 is rewritten as;
x(i) = [aos(0 a is (i-T o ,i)
a
2s{t - to,
2) •••
- to^m-i)V
+ [no(0
ni{t) n2{t) •••
nM-i{t)f
(2.6)
where
tq,, is the relative time delay between the reference microphone (/ = 0) and
microphone. Discrete Fourier transform [37, pg. 86-92] of signal vector
x{t) gives
the frequency domain representation of the signal. The signal vector in the frequency
domain
X{uj) is represented by:
X(u;) == [
0 0 5(
0;) ai5(u;)
a2S{uj)
■■■
5(o;)
+
[Noiu) N, {
lo) N2{
u) ••• iVM-i(u;)F
(2.7)
Equation 2.7 can be written as:
X{u) =
S{oj)
A{u)
+ N(u;)
(2.8)
where 5(0;) is the Fourier transform of the source signal
s{t), uj is the frequency of
the source signal, N(o;) = [A^o(‘^) -^i(<^)
N
2{uj) ■
■
■
is the Fourier transform
of the noise vector and A(o;) is the array response vector also called the steering vector
or direction vector [116]. The steering vector is given by:
A(o;) = [co ai
a
2exp~-’‘^'^°’^
••• om -i
(2.9)
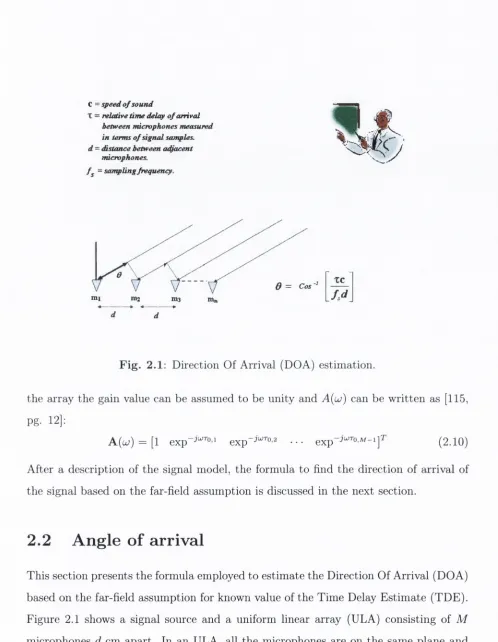
C = speed o f sound
X = relative tim e deUg/ o f arrival hetnveen im cropkones m easured in term s o f signal samples, d - S sta n c e between a^ffacent
nucrophones. = sam pling fivquency.
0 = Cos
m i m„
tc
f s d
Fig. 2.1 : Direction Of Arrival (DOA) estimation.
the array the gain value can be assumed to be unity and
A{uj)
can be w ritten as [115,
pg- 12]:
A(w) = [1
(2.10)
After a description of the signal model, the formula to find the direction of arrival of
the signal based on the far-field assumption is discussed in the next section.
2.2
A n g le o f arrival
[image:34.535.26.524.49.691.2]array plays an im portant role in the determination of the source location.
The signal em anating from a source is a spherical wavefront. As the wavefront move
away from the source its curvature decreases and it becomes planar. ULA is referred as
microphone array in this thesis. Consider a microphone array consisting of M
elements
spaced
d cm apart. According to the far-field assumption if the distance between the
microphone array and the signal source is very large compared to the distance between
microphone pair (d), then the signal wavefront received by the microphones in the array
can be assumed to be planar [102, pg. 13], [47, pg. 43], [86]. The additional distance
the wavefront covers to reach a microphone compared to the other is dcos{9) [109]. The
relative time difference
(tij) for a signal to reach a pair of microphones
{i,j) traveling
with a velocity of c m /s is given by:
di i cos 9
= — (2 . 11)
The value of c is approximately 342
m / s
[102]. The direction of arrival
9ij of the
signal for a pair of microphone based on the far-field assumption is given by:
9i,j = cos~^
(“^)
The estim ated
9ij is an approximate value of the DOA of the source signal. Relative
time difference,
ti j, can be expressed in terms of the signal samples
(Tij) and the
sampling frequency (/s) by:
k j = ^
(2.13)
J s
By substituting equation 2.13 in equation 2.12, the DOA of the source signal is found
by the equation:
far-field assum ption decreases. The error in th e DOA estim ate is also dependent on
the closeness of th e relative tim e difference in term s of the signal sample.
T h e next section presents th e restriction applicable on th e m icrophone array based
on th e type of signal for tim e delay estim ation.
2 .3
S p a tia l A lia sin g
Signals can be broadly grouped into w ideband signals and narrow band signals. W ide
band signals are also known as broadband signals. They do not have any particu lar
characteristic wavelength as their power is distrib u ted over a wide frequency range.
The ratio of th e ir highest frequency to th e lowest frequency com ponent is relatively
large. N arrow band signals on the other hand assume th a t th e signal has a very narrow
b an d w id th [45] and thus have a nom inal wavelength. Speech signal are bro ad b an d
signals as th eir power is d istrib u ted over a wide range of frequencies [31].
W hen phase inform ation is used to find th e DOA of a narrow band signal th e distance
betw een th e m icrophones in the array is restricted by th e frequency of th e signal. This
is due to sp atial aliasing. Phase lag or lead between a signal and its shifted version can
be found if th e phase shift is in the range of [—
t t, + 7t].If th e phase shift does not fall
w ithin th e range, w rapping in the phase occurs th a t makes it impossible to distinguish
w hether th e phase shift is a lead or lag in phase. Figure 2.2 shows a sine wave th a t
has a phase lead of ^ = tt + | and sine wave th a t has a lag of ^ = tt —
B oth the
waves are sam e and com pared to th e original signal it is difficult to find if there is a
lead of ^ or a lag of ^ in the phase of th e shifted signal. T his results in incorrect
DOA estim ation.
For th e b ro ad b an d signal let
Amin correspond to th e wavelength associated w ith the
m axim um frequency
( f m a x )of th e signal. The phase shift is restricted by th e relation:
1
---C O S ( 2«(t+4«/3 ) 0.5
0) • \ / \ / \ / \ / C O S ( 2*ft )
■o \ / A V
1. 0 \ /
\
\
l\
\ / / \ \ ■ E^ -0 5
-y \ y
\ y
v y , V^ 1\y
1 ' w '0 10 20 30 40 50 60
T im e 1
0.5 0 -0.5 1
0 10 20 30 40 50 60
T im e
F ig . 2.2: Example of Spatial Aliasing
where
t is the time delay. Using the relation between
t and
cos 6 of equation 2.11,
equation 2.15 can be rew ritten as:
dcos 9
2 f m a x
--- < 1
(2.16
c
where d is the distance between any microphone pair in the array for which the phase
shift is being computed and c is the velocity of sound. The maximum value of cos 6 = 1
at 0 = 0. Substituting
cos ^ = 1 in equation 2.16 can be rewritten as:
< 1
(2.17)
c
But
=
^min- Hence equation 2.17 can be rewritten to provide a relation between
J m a xthe distance between any microphone pair in the microphone array and the wavelength
of the signal. This relation is given as:
[image:37.534.10.525.67.807.2]For narrowband signals if the distance between the microphone pair, for which
the phase shift is being computed for time delay estimation, in a microphone array is
greater than
then spatial aliasing occurs [115]. Spatial aliasing leads to incorrect
DOA estimation in the algorithms using TDE based on relative phase difference of the
signal. To avoid this problem the distance
(d)
between the adjacent microphones in
the array is restricted by the equation 2.18 [115, 91].
The above assumption is not applicable to the TDE on broadband signals using the
cross-correlation method since the signal processing is done in the time domain [115].
Section 2.10 discusses cross-correlation based TDE algorithms for DOA estimation.
Next section describes the methods applied to improve the resolution of time delay
estimates for finer DOA estimates.
2.4
D O A R eso lu tio n
As shown in equation 2.14 of section 2.2, DOA estimate using far-field assumption
formula involves the estimation of the relative time difference for the signal to reach a
pair of microphones. The time difference is expressed in terms of the signal samples
(t j j ) .
Time Difference in signal samples is referred to as time delay
( r j j )in this work.
Relation between the time difference, time delay and sampling frequency is given by:
h i
= ^
(2.19)
Is
where
fa
is the sampling frequency.
the signal, by upsam phng or by increasing the distance between the m icrophone pair. Increasing the sam phng rate of the signal or upsampling the signal to increase the sam pling rate leads to higher storage and com putational requirements. T he distance between the microphones is restricted to satisfy the far-field assum ption which states th at the distance betw een the microphone pair in the microphone array should be very less compared to the distance between the signal source and the microphone array.
Interpolation is also used to improve the DOA resolution [32, 26]. T his m ethod is useful in the T im e Difference Of Arrival (TD O A ) based algorithms for DO A estim ation discussed in section 2.10. In the case of T D O A based algorithms after initial estim ate of the tim e delay in terms of integer value of the signal sample is obtained, parabolic interpolation is applied to obtain the tim e delay in terms of non-integer value of the signal sample. Parabolic interpolation is not com putationally intensive. In this way DOA resolution is improved without increased storage requirements and w ith a small increase in the com putation requirement.
T he next section presents Lagrange’s parabolic interpolation m ethod th at is suitable for the algorithm s discussed in section 2.10.
2.5
P arab olic In terp olation
S r f . {x ~ X 2 ) {x - X 3 ) - - - {x - X n ) {x - X i) {x - X 3 ) - - - {x - X n ) f { x ) = f { X i ) ~ ^ ^ + f { X2 )
-( X i - X 2 ) { X I - X 3 ) • • • ( X i - Xn ) {x2 - X i ) { x 2 ~ X 3 ) ■ ■ ■ { X 2 ~ Xn ) ,
N
( a : - x i ) ( x - x 2 ) - - - ( x - x ; v - i )
+ • • • + ---77---^---7--- T (2.2 0) [ Xn - Xi) {x m - X 2 ) - - - [x n -
a^iv-i)
A function closely related to a polynom ial can be interpolated using the polyno mial as the m odeling function. T he order of the polynom ial used in interpolation is given by the number of points minus one. T he parabolic interpolation or Lagrange’s interpolation w ith three points is expressed as:
= y ( ^ ,) + / ( X , ) + /( X ,)
( l i - I 2 ) ( l l - 1 3 ) ( 1 2 - I i ) ( l 2 - I 3 ) ( X a - I i ) ( l3 - I 2 ) (
2
.21
) where f { x ) is the interpolated value of the function for the desired value of x and f ( x i ) , /( X2), / { x s ) are the already known values of the function for the values of Xi, X2, X3 respectively. Parabolic interpolation is also known as second order, quadratic interpolation or three point interpolation.For tim e delay estim ation, parabolic interpolation has been used in [32, 36] to improve the resolution of the obtained direction of arrival by finding the fractional sample delays. Parabolic interpolation is appropriate for the function involved in the tim e difference of arrival based algorithms for DOA estim ator discussed in section 2.10 since they are close in form to a parabola around their m axim um or minimum values. In this work parabolic interpolation has been used to improve the resolution of the DOA estim ates by finding the delay that is a non-integer signal sam ple value.
2.6
C la ssr o o m E n v iro n m en t
Classroom environment play an important role in the performance of a Direction Of
Arrival (DOA) algorithms. Two main problems encountered in a classroom are the
noise in the room and the room reverberation. Noise refers to the ambient (back
ground) noise present in the room. This noise is due to the presence of mechanical
equipments such as the heating system, HVAC and ventilation system in the classroom.
Other equipments that contribute towards the background noise are the computers and
projectors.
Presence of background noise affects the speech intelligibility. In the presence of
high background noise, speech intelligibility suffers which makes it difficult for students
to understand the lecture. This situation is worsened for students that have certain
hearing disability.
Intensity measures the perceived loudness of the sound waves. Sound intensity is
measured in decibel (dB). dB scale is logarithmic. Signal to Noise Ratio (SNR) is
the ratio of the signal power to the noise power present in a classroom. It enables to
estimate the understandability of the speech in a room. Both signal and noise power
are measured in dB and hence SNR is the difference between the signal and noise power
in dB [100].
The signal to noise ratio is given by:
where
Pg
and
are the source signal and noise power respectively [91].
SNR of the room varies in the room due to different levels of signal and noise at
different locations in the room. SNR is lowest at two locations in a classroom. One
of the locations is the back of the classroom which is farthest from the lecturer’s or
teacher’s location. The other location is nearest to the source of background noise
where background noise is the maximum. A technical report by Acoustical Society
of America [100] recommends a SNR to be above 10 dB for speech intelligibiUty and
above 15 dB for children with certain hearing disability. American Speech-Language-
Hearing-Association (ASHA) [4] guidelines recommend SNR to be greater than 15 dB.
Reverberation is another problem in a room. Reverberation is the echo of the
signal [100]. When the signals in a room come into contact with the surfaces of the
room they are absorbed, transm itted, diffused or reflected. The reflected and diffused
signals interfere w ith the next words th a t are spoken. Depending on the degree of
interference the speech intelligibility varies. Acceptable reverberation level in a room
is measured in terms of reverberation time. Reverberation time (RT60) is a measure
of the time it takes for the sound to decay to 60 dB of its original value. Volume
as well as the surface m aterials of the room influence RT60 of the room. A small
amount of reverberation is desirable as it helps in the propagation of useful sounds in
the classroom. Recommended reverberation time is 0.4 - 0.6 seconds [100]. Bistafa et
al. [23] recommend 0.4 - 0.5 seconds of RT60 for 100% intelligibility.
Following sections present state of the art for the Direction Of Arrival (DOA)
algorithms for source localization.
2 .7
D ir e c tio n O f A rrival A lg o r ith m T a x o n o m y
According to [24] source localization algorithms can be classified into three algorithm
categories based on the signal processing approach for DOA estimation. They are:
1. Steered Beamformer based algorithms.
2. High Resolution Spectral Estim ation based algorithms.
3. Time Difference of Arrival (TDOA) based algorithms.
In section 2.8, steered beamformer based algorithms are explained and a discussion
and discussion of high-resolution spectral estimation based algorithms and the Time
Difference Of Arrival (TDOA) algorithms.
2.8
S teered B eam form er B ased A lgorith m s
Beamforming involves focusing the microphone array to capture signals from certain
directions in presence of interfering signals. It involves spatial filtering where the spatial
filter of the array is focused towards the desired direction through the signal processing
algorithms rather than physically focusing the array in the desired direction [60, pg.
112], [116]. By spatial filtering two signals consisting of same frequencies are separated
provided th a t they are generated in different locations [116]. The beam in the desired
direction is formed by summing weighted signals of the microphones in the array [46,
pg. 237]. Beamforming is mainly used in communications systems. Antenna arrays
are used for beamforming. The concept of beamforming has been extended to the field
of speech signal processing. The applications of beamforming include DOA estimation,
steering a null in the direction of the undesired signal and signal enhancement [115].
Steered beamformer based algorithms are used to find the DOA of the source signal
and also for signal source localization. The steered beamformer based algorithms utilize
the Maximum Likelihood (ML) principle. The source locaHzation by these algorithms
depends upon maximizing the steered response power of a beamformer. A beam is
steered in all the possible directions and the output power is calculated for every
direction. The angle, at which maximum output power is obtained, is taken as the
DOA of the signal source.
DOA estimation using beamforming is performed on narrowband signals. For DOA
on broadband signals the signal is divided into smaller frequency bands. Narrowband
and broadband signals are introduced in section 2.3. Each frequency band is considered
DOA of these frequency bands is combined to get th e overall DOA estim ate [115].
C onsider a narrow band signal sim ilar to th e one given in equation 2.6 cap tured
th ro u gh a ULA of M elem ents. T he o u tp u t of a beam form er for the signal is given by:
M - l
y{t)
=w* Xi{t)
(2.23)
t = 0
w here
X i { t )is th e signal cap tu red by
m icrophone in th e m icrophone array and
W i
is th e corresponding complex weight. The weight perform s th e sp atial filtering such
th a t th e signal from a particu lar direction also called th e look direction is em phasized
[91, 45].
E quation 2.23 can be w ritten as:
y { t ) =
w " x (i)
(2.24)
where w is th e complex weighting vector and x (f) is th e microphone array signal vector.
W hen the signal is a zero mean statio n ary process th e m ean o u tp u t power of the
beam form er for a given weight vector is [45]:
P (w ) =
E[y{t) y*{t)]
(2.25)
£'[.] is th e expectation operator.
Speech signals change rapidly and hence are not stationary. The signal is divided
into sm aller sections called frames. The signal when divided into sm aller frames can be
considered to be stationary. T hus th e m ean o u tp u t power for th e signal w ith L frames
is given by [91]:
^(w) =
t = i
1 ^
=
x ( 0 x ^ ( i ) w ,
t=l
where R = ;^
Y l t = i^ ^ ( 0 = ^ [ ^ ( 0
is the correlation m atrix of th e array.
For th e DOA estim ation th e angle at which the o u tp u t power of th e array is m ax
im um is taken as th e DOA of the source signal. The weights vector distinguishes
betw een different types of beamformers.
In this section, beam form ing in th e tim e and frequency dom ain is presented. Ini
tially th e delay and sum beam form er is discussed. It is an example of th e beam form ing
in th e tim e dom ain. Beamforming in the frequency dom ain is described next.
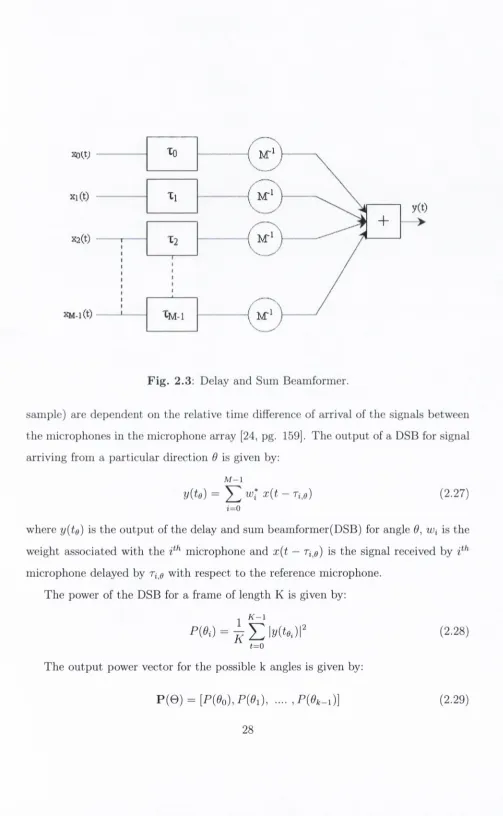
2.8 .1
D ela y an d S u m B eam form er
T he delay and sum beam form er (DSB) is one of the oldest and th e sim plest beam form
ers [60, pg. 112]. DSB is shown in Figure 2.3. It is also known as th e conventional
beam form er. As th e nam e suggests in this approach th e signals cap tu red by the mi
crophones in the m icrophone array are delayed by the sam ple values corresponding to
th e relative tim e delay w ith respect to th e reference microphone signal in the micro
phone array and added to form the DSB. The aim of DSB is to reinforce th e signal
arriving from a p articu lar direction by delaying the signals cap tu red by microphones
in th e m icrophone array by th e appropriate sample values. The delay value in term s
of signal samples depend on th e tim e taken by th e signal wavefront to travel from th e
source to the m icrophones in th e microphone array [60, pg. 112]. T h e m ean o u tp u t
power of this beam form er in th e direction of the source is equal to th e source power.
In this beam form ing process instead of mechanically steering the array in th e direction
of th e signal source it is steered electronically by adjusting th e phase of th e signal.
Moreover in th e absence of interfering signals from other directions and th e presence
uncorrelated noise m axim um possible signal to noise ratio (SNR) obtained using this
beam form er [45]. For th e DOA estim ation th e delayed versions of th e signals captured
by different m icrophones in th e microphone array is added to th e reference m icrophone
XMl(t)
-F ig . 2.3: Delay and Sum Beamformer.
sample) are dependent on the relative time difference of arrival of the signals between
the microphones in the microphone array [24, pg. 159]. The output of a DSB for signal
arriving from a particular direction
9
is given by:
M - l
y{U) =
^
w* x{t - Ti^e)
(2.27)
i=0
where
yite)
is the output of the delay and sum beamformer(DSB) for angle
6, Wi
is the
weight associated with the
microphone and
x{t
—
g) is the signal received by
microphone delayed by
with respect to the reference microphone.
The power of the DSB for a frame of length K is given by:
K - l
(2.28)
t=o
The output power vector for the possible k angles is given by:
[image:46.534.24.527.12.828.2]T he DOA of the source signal corresponds to th e angle associated w ith m axim um
value of power in th e P ( 0 ) vector.
T h e DSB can be used on broadband signals. It estim ates th e location of th e signal
source by estim ating th e likelihood of th e presence of a signal source a t a p articu lar
location based on the energy measures obtained for th a t location. Birchfield [21] ex
plains th a t the DSB equation consists of two term s. The first term is a m easure of
th e pair-wise sim ilarity between th e signals received in the array and th e second term
represents the to ta l energy of all the signals. DSB is similar to Bayesian form ulation
in term s of maximizing th e likelihood of the signal source being present a t a p articu lar
location. The difference between the two is in th e weights used for th e energy term s.
For statio n ary signals, the energy term does not affect the likelihood of th e presence of
th e source a t a p articu lar location. This results in equal DSB and Bayesian equations.
For a DSB, th e resolution in the estim ated angles is dependent on th e sampling
ra te of th e signal. To get a higher resolution in angle the sam pling ra te of th e signal
has to be increased. This is because th e delay is in integer values of th e signal sample.
Higher sam pling rate tran slates to higher storage requirem ent and increased processing
power. To overcome th e problem of improved resolution in angle w ith o u t increasing
the sam pling frequency, frequency dom ain beam form ing is employed [91]. Frequency
dom ain beam form ing is described in the next section.
2 .8 .2
F req u en cy D o m a in B eam form in g
As m entioned a t the beginning of section 2.8, frequency dom ain beam form ing is p er
form ed on narrow band signals. T he frequency dom ain representation of a narrow band
signal w ith central frequency
Ucgiven in equation 2.8 is given by;
The corresponding beamformer output is:
Y(u;c) = w^X(u;e)
(2.31)
where w is the complex weight vector given by w =
[
wq,W\, ....,
w m- \ Y
^
the number of elements in the microphone array. The choice of weight vector is based
on the requirement that all the signals for the look direction are summed coherently
[91,
115]
and the gain is high for signals in look direction whereas the signals from other
directions are attenuated
[115].
The power spectral density (PSD) of the beamformer is:
$Y v(u;J = Y(a;,) Y*(u;,),
= X (a ;c ) X * (u ;c),
= w " $ x x (i^c) w
(2.32)
The DOA of the source signal is taken as the direction for which the value of
<I>y y (< ^c)
is maximum.
$ x x ( ^ c )is the
M x M
PSD matrix of the input signals.
Since beamforming was developed for applications involving narrowband signals, in
order to perform frequency domain beamforming on a broadband signal like the speech
signal, the spectrum for the signal received by ea<;h microphone in the microphone ar
ray is obtained by Discrete Fourier Transform (DFT). The signals are then converted
to narrowband signal by dividing them into smaller frequency bins. Individual nar
rowband spectrums with the corresponding frequency are multiplied by the suitable
complex weight and summed.
The resolution in angle using a beamformer is dependent on the number of micro
phones in the microphone array. The maximum angle resolution that can be obtained
with a ULA consisting of M elements, in radians is given by:
27T
While accuracy of the DOA estimates using beamforming is adequate, finer reso
lution in angles is obtained for higher sampling rates. Higher sampling rate requires
more com putational power rendering it unsuitable for real-time implementation [91],
Moreover since beamforming was developed for narrowband signals, the performance
of the beamformer on broadband signals such as speech deteriorates in the presence of
reverberation [91].
The performance of the beamformer for DOA estimation can be improved by using
a priori
information. Duraiswami et al. [95] have exploited the
a priori
information
about the enclosed space dimensions and its relationship with the signal wavelength to
perform coarse-to-fine both in the frequency and space for efficient source localization
beamforming.
D iscu ssio n
Delay and sum beamformer appears to be very practical for the purpose of source
localization in e-learning environment due to its simplicity. The drawback with this
approach is th at finer angular resolution cannot be obtained without increasing the
sampling rate of the signal. Increased sampling rate leads to higher storage and com
putational requirements making it impractical for real time applications.
Beamforming in the frequency domain provides improved resolution in the angle
estimates. Since they were proposed for narrowband signals, more com putation is
required to make them suitable for broadband signals such as speech. The performance
of the beamforming algorithms deteriorates in the presence of reverberation [91]. The
algorithm based on the coarse to fine search [95] requires
a priori information
th a t is
not known beforehand rendering it unsuitable for the purpose of source localization.
Next section presents the second category of the Direction of Arrival (DOA) algo
sta rts w ith an introduction to th e algorithm s of th is category a discussion ab o u t the
advantages and disadvantages of the algorithm s of th is category w ith respect to its
application for DOA estim ation in an e-learning environm ent.
2.9
H igh R eso lu tio n S p ectral E stim a tio n B a sed
A lg o rith m s
T he algorithm s belonging to this category are suitable for narrow band signals. These
algorithm s are applied on broadband signals hke speech sim ilar to th e way frequency
dom ain beam form ing is applied on th e broadband signal. As m entioned in section 2.8.2
b ro adb an d signal is transform ed to obtain its spectrum using th e D FT . T he signal
spectrum is divided into several narrow band frequency bins [91]. T h e narrow band
algorithm is applied on each narrow band frequency bin and then th e results of all the
narrow band frequency bins are combined to obtain an overall result for the broad b an d
signal. Subspace based algorithm s or eigen stru ctu re m ethods are prom inent exam ples
of the high resolution spectral estim ation based algorithm s category.
2.9.1
S u b sp a ce T echniques
In th is section a brief introduction is provided on th e subspace techniques. T h e al
gorithm s based on th e subspace techniques are based on two properties of th e Cross-
C orrelation m atrix of th e signal. The first property states th a t th e space spanned by
the eigenvectors of th e signal can be divided into two orthogonal subspaces nam ely the
signal subspace and th e noise subspace. The second property states th a t the steering
vector corresponding to th e directional sources are p a rt of th e signal subspace since
they to o are orthogonal to th e noise subspace [45].
M X M
matrix given by:
R(u;e) - X(u;,)
{ujc)
(2.34)
Assuming that the rank of R is full and the number of sources present
(P)
is less
than the number of microphones in the array (M). The eigen decomposition of the R
is expressed as [91]:
M
R = Y ^
Aie,ef
(2.35)
i=l
where Aj is the
eigenvalue and 6i is the
eigenvector.
The eigen decomposition of R results in a P-dimensional signal subspace and
(M — P)-dimensional noise subspace. The eigenvalues are arranged in the descending
order. The highest
P
eigenvalues represent the signal subspace and their corresponding
eigenvectors span the signal subspace. The rest of the eigenvalues represent the noise
subspace which is spanned by their corresponding eigenvectors.
These algorithms search for the directions