Dynamic patterns of mechanical stimulation co-localise with growth and cell
proliferation during morphogenesis in the avian embryonic knee joint
Karen A. Roddy
a,b, Geraldine M. Kelly
c, Maarten H. van Es
c, Paula Murphy
a,b, Patrick J. Prendergast
a,n aTrinity Centre for Bioengineering, School of Engineering, Trinity College Dublin, Ireland bDepartment of Zoology, School of Natural Sciences, Trinity College Dublin, Ireland c
Nanoscale Function Group, Conway Institute of Biomolecular and Biomedical Research, University College Dublin, Ireland
a r t i c l e
i n f o
Article history:
Accepted 31 August 2010
Keywords: Mechanobiology Joint development Finite element analysis Articular cartilage development Muscle contraction
a b s t r a c t
Muscle contractions begin in early embryonic life, generating forces that regulate the correct formation of the skeleton. In this paper we test the hypothesis that the biophysical stimulation generated by muscle forces may be a causative factor for the changes in shape of the knee joint as it grows. We do this by predicting the spatial and temporal patterns of biophysical stimuli, where cell proliferation and rudiment shape changes occur within the emerging tissues of the joint over time. We used optical projection tomography (OPT) to create anatomically accurate finite element models of the embryonic knee at three time points (stages) of development. OPT was also used to locate muscle attachment sites and AFM was used to determine material properties. An association was found between the emergence of joint shape, cell proliferation and the pattern of biophysical stimuli generated by embryonic muscle contractions. Elevated rates of growth and cell proliferation in the medial condyle were found to co-localise with elevated patterns of biophysical stimuli including maximum principal stresses and fluid flow, throughout the time period studied, indicating that cartilage growth and chondrocyte proliferation in the epiphysis is potentially related to local patterns of biophysical stimuli. The development of the patella and articular cartilages, which is known to be affected by in ovoimmobilisation, could be contributed to by specific patterns of fluid flow, pore pressure and stress in the joint interzone. This suggests that both cartilage growth and tissue differentiation in the embryonic joint is regulated by specific patterns of biophysical stimuli and that these stimuli are needed for the correct development of the joint.
&2010 Elsevier Ltd. All rights reserved.
1. Introduction
Synovial joints have intricate 3D shapes, which are highly
adapted for their biomechanical function. They emerge through
the division of mesenchymal condensations, forming cartilage
templates interrupted by an interzone, a dense avascular region
from which all the tissues of the joint are derived (Koyama et al.,
2008). Shape emerges within the cartilage template as the
chondrocytes proliferate and secrete matrix, causing them to
grow until they undergo hypertrophy leading to ossification.
Within this system a variety of joint shapes are created through
some unknown modulation of regulatory mechanisms (Wilsman
et al., 1996).
Mechanical forces have been implicated in the process of joint
morphogenesis. Paralysis was reported to cause flattening and
distortion of the articular surfaces (Drachman and Sokoloff, 1966),
reduction in the volume of epiphyseal cartilage (Osborne et al.,
2002), the loss of functional outgrowths (Murray and Drachman,
1969; Persson, 1983) and reduction or loss of joint-associated
structures such as the patella and articular cartilage (Mikic et al.,
2000; Osborne et al., 2002). Cell proliferation rates in the
developing growth plate and chondroepiphysis were also
down-regulated by the removal of embryonic muscle contraction
(Germiller and Goldstein, 1997).
Previous studies used computational simulations to predict
mechanical forces in simplified representations of the developing
skeleton.
Heegaard et al. (1999)
simulated the emergence of a basic
interlocking joint morphology in response to mechanically
stimu-lated differential growth. Other models have been implemented to
investigate various aspects of limb development including
en-dochondral ossification and the development of secondary sites of
ossification (Carter and Wong, 1988; Stevens et al., 1999), the
emergence of the femoral bicondylar angle, and the common
childhood orthopaedic problem, developmental dysplasia of the
hip (Shefelbine and Carter, 2004; Shefelbine et al., 2002).
Nowlan
et al. (2008a)
created a Finite Element (FE) model from
morpho-logically accurate 3D data captured from the developing chick
Contents lists available at
ScienceDirect
journal homepage:
www.elsevier.com/locate/jbiomech
www.JBiomech.com
Journal of Biomechanics
0021-9290/$ - see front matter&2010 Elsevier Ltd. All rights reserved. doi:10.1016/j.jbiomech.2010.08.039
n
Corresponding author.
tibiotarsus that was used to investigate the mechanoregulation of
ossification by the dynamic patterns of stimuli generated during
muscle contraction. A correlation between the patterns of stimuli
and the expression patterns of a number of genes involved in bone
formation was also found (Nowlan et al., 2008b).
Tanck et al. (2004)
analysed late gestation mouse rib rudiments
using four point bending tests while
Mikic et al. (2004)
performed
stress-relaxation tests on cores of late stage chick embryonic
cartilage, in order to characterise Young’s modulus of the cartilage.
No studies of the mechanical properties of the interzone were
found in the literature by these authors. Atomic force microscopy
(AFM) has previously been used as a type of nanoindenter in order
to analyse the mechanical properties of biological specimens
including growth plate cartilage (Allen and Mao, 2004;
Radhak-rishnan et al., 2004), articular cartilage (Stolz et al., 2004) and
single cells (Rotsch et al., 1997).
In this paper we seek to test the hypothesis that during joint
development local changes in cartilage growth and cell
prolifera-tion are related to distinct patterns of biophysical stimuli
generated by embryonic muscle contraction. To test this
hypoth-esis we used Optical Projection Tomography (OPT) to create an FE
simulation, to determine whether dynamic patterns of
biophysi-cal stimuli co-lobiophysi-calise with cartilage growth and cell proliferation.
Embryonic stages from (Hamburger and Hamilton (HH) (1951)
stage HH30 to HH34 were chosen as they represent the time
period covering the emergence of complex joint shape and the
initiation of joint cavity formation (Roddy et al., 2009). New data
on the mechanical properties of the embryonic cartilage and
interzone tissue were needed, and these were obtained using
AFM. Correspondence between patterns of biophysical stimuli,
tissue growth and cell proliferation were explored to establish
whether dynamic biophysical stimuli co-localise with
morphoge-netic events. Such a finding would suggest that the patterns of
biophysical stimuli distributed in the skeleton act as a type of
positional information differentially up- or down-regulating
growth, leading to the emergence of specific skeletal shapes.
2. Method
2.1. Finite element analysis
2.1.1. Geometry
The FE model was built from a 3D dataset described inRoddy et al. (2009) consisting of 3D representations of the developing cartilage, tendon, muscle and joint capsule, captured using a range of markers and scanned using Optical Projection Tomography (OPT). 3D images in VTK (Visualisation Toolkit) format, representing the cartilaginous elements of the knee, were extracted from OPT scans of alcian blue stained limbs at (Hamburger and Hamilton, 1951)stages, HH30, HH32 and HH34 (Fig. 1a), and converted into a format suitable for Abaqus FE software, as perNowlan et al. (2008a). A fourth mesh was generated that encapsulated the interzone and represented the area separating the three skeletal elements, bounded dorsally by the joint capsule and ventrally by muscle masses. Two models representative of each stage were built, as in exampleFig. 1b.
2.1.2. Loading and boundary conditions
The 3D tendon and muscle data of the developing chick knee joint were examined, and the major dorsal (D1, D2) and ventral (V1, V2) muscles of the thigh were identified (Fig. 1c). The transverse cross-sectional area of each muscle was taken at the longitudinal midpoint of the muscle mass (Fig. 1d), and the resultant forces were calculated using a force per unit area value for embryonic chick muscle of 1.11 mN/mm, derived from Landmesser and Morris (1975) (n¼2, Table 1). The attachment points for each muscle were located on the rudiment using a combination of visual comparison of external views and virtual sectioning through the 3D representations of the cartilage, muscle and tendon data at corresponding stages.
As perTanck et al. (2000)andNowlan et al. (2008a), a loading cycle consisted of two muscle twitches, a flexion (Fig. 1e) followed by an extension (Fig. 1f) contraction lasting for 1.4 s and including a ramp-up, hold and ramp-down. A poroelastic analysis was performed using the published values for cartilage permeability (6.710 m/Ns) and Poisson’s ratio (0.25) (Tanck et al., 2000).
A porosity of 0.8 was used (Kelly and Prendergast, 2005). The permeability of the interzone was considered as equivalent to cartilage (a parametric study of permeability in the interzone ranging from 725% demonstrated that altering permeability did not alter the resulting pattern of stimuli significantly).
The four mesh elements were connected using tie constraints to represent the connections between skeletal elements and the interzone. Three nodes on the proximal surface of the femoral mesh were fully restrained, while the rest of the nodes on this surface were restrained in the vertical direction only (Fig. 1g). Two rigid plates, attached to the distal surfaces of the tibiotarsus and fibula meshes (Fig. 1f), were connected by a spring to simulate the presence of tissue separating the two cartilaginous elements (Fig. 1f). The spring stiffness is given in Table 2. A zero pore pressure boundary condition was specified on all the external nodes and on the various master surfaces. For each simulation of a flexion/ extension cycle the following parameters were determined: maximum and minimum principal stress and strain, the Von Mises stress, relative fluid-solid velocity and hydrostatic pressure.
2.1.3. Material properties
AFM was used to determine Young’s modulus of embryonic cartilage and interzone at stage HH32. Unfixed tissue was equilibrated in 30% sucrose and frozen in Tissue-Tek embedding compound, cryo-sectioned longitudinally (60
m
m; Bright 5040) and mounted onto polylysin coated slides (Menzel Glaser).The AFM was a JPK Nanowizard model mounted onto a Nicon Ti/E microscope. Prior to analysis the beam shaped cantilevers mounted with 5
m
m borosilicate spheres (Novascan), with a nominal spring constant of 0.95 N/m, were calibrated. The sensitivity was calibrated by performing a force curve on glass. The spring constant was calibrated using the thermal method (described byHutter and Bechhoefer, 1993). The tip was then positioned over the area of interest and a force map of 10000m
m2was generated with a total of 100 force curves; the map was occasionally reduced to 5000
m
m2. Samples were indented at approximately 0.75
m
m/s. Cartilage and interzone tissues were indented with a force of approximately 10 and 4 nN, respectively. At least two independent force maps per tissue type were performed (n¼4).Young’s moduli for both cartilage and interzone at HH32 were determined by fitting the Hertz model (Hertz, 1882; Sneddon, 1965) to the force curves. The resulting Young’s moduli were 0.53570.072 and 0.28770.066 kPa for embryonic cartilage and interzone tissues, respectively (n¼4).
2.2. Analysis of changes over time
2.2.1. Analysis of developing joint shape
markers to be used in selecting consistent section planes. Outlines, capturing local shape changes in the distal femur, were overlaid so that the medial and lateral sides of the femora in the sections were parallel and the midlines of the intercondylar fossae were overlapping.
2.2.2. Determining rates of cell proliferation
The proportion of proliferating cells was determined using the mitosis marker anti-phospho-histone H3 PABs (Millipore) and the secondary antibody Cy3 goat anti-rabbit IGg (Jackson immuno) on 25–30
m
m longitudinal cryo-sections, mounted in ProLong Gold anti-fade reagent with DAPI (Invitrogen).The density of proliferating chondrocytes was determined in five cartilage regions corresponding to the intercondylar fossa, and the dorsal and ventral portions of the medial and lateral condyles, imaged separately (Fig. 2(1–5)) using an Olympus FV1000 point scanning confocal microscope. The numbers of
chondrocytes and proliferating cells were counted within a box 1.44 mm2 (Fig. 2(1–5), red box) for two independent focal planes on two sections per specimen (n¼3). Results were analysed usingR.
3. Results
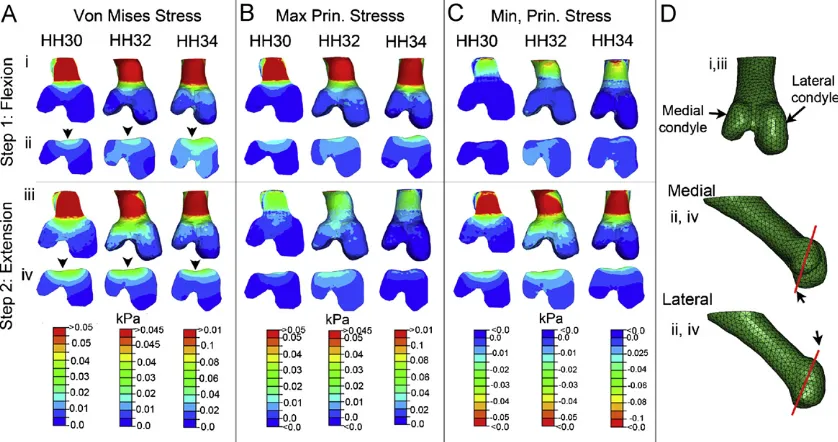
3.1. Biophysical simulation of the distal femur during development
FE analysis predicted the biophysical stimuli throughout the
developing knee joint. Focusing on the distal femur, a prominent
feature of the pattern was a peak in stimuli located adjacent to the
intercondylar fossa (Fig. 3, arrowhead in A). This peak was present
in both patterns of the Von Mises stress and maximum principal
stress in both mid-flexion and mid-extension (Figs. 3A, B and
4C, D)
as well as patterns of maximum principal strain, fluid velocity and
hydrostatic pressure (not shown). Of the stimuli analysed here
patterns of minimum principal stress varied the most between the
flexion and extension loading steps (Figs. 3C and
4E, F). In the first
step the magnitude of stimuli varied little between the five locations
examined (Fig. 4E). A peak of compression adjacent to the
intercondylar fossa appears in the second loading step (Fig. 3C, iv).
Within the femoral condyles the predicted loading was
consistently higher on the dorsal surface compared to the ventral
surfaces in duplicate models. In the flexion phase the stimuli
within the lateral and medial condyle appeared to be largely
equivalent (Fig. 4C, E). However, in the extension step the
magnitude of loading on the medial side of the knee was higher
(Fig. 4D, F). The same pattern was predicted for both maximum
and minimum principal strains and fluid flow across all three
stages.
3.2. Biophysical stimuli in emerging tissues of the interzone
Focusing on the patterns of biophysical stimuli in the emerging
tissues of the interzone, stress and strain were found to be similar,
so only patterns of the Von Mises stress are shown, together with
fluid velocity and hydrostatic pressure (Fig. 5). The region of the
future patella, which develops from the capsular condensation
and the interzone, appeared to experience significantly greater
stress, fluid velocity and pore pressure than the rest of the
interzone across the three stages (Fig. 5C–E indicated by
*). The
stress on the emerging patella was predicted to be approximately
four times that predicted for the future articular cartilage and
cavity (Fig. 5C). The chondrogenous layers, which first emerge at
HH32 (Roddy et al., 2009), develop in a region characterised by an
elevated fluid velocity (Fig. 5D, red arrows) and a region of
elevated pore pressure midway between the two cartilage anlaga
(Fig. 5E, blue arrows), approximately where the cavity should
form. Cavity formation begins at approximately HH34 (Roddy
et al., 2009). It was also noted that the trend of elevated stimuli
Table 1Mean values (2 independent specimens) for cross-sectional area of dorsal and ventral muscle masses and estimation of the resulting forces exerted by these muscle masses during contraction across developmental stages HH30–34.
Specimen number HH30 HH32 HH34
Area (mm2
) Force (mN) Area (mm2
) Force (mN) Area (mm2
) Force (mN)
Dorsal
1 0.5270.02 0.579 0.8170.14 0.896 0.8670.04 0.949
2 0.5170.03 0.565 0.7470.11 0.818 0.8970.09 0.986
Ventral
1 0.1570.02 0.161 0.3770.07 0.41 0.3770.02 0.414
2 0.1970.02 0.21 0.4770.02 0.52 0.5670.02 0.618
Force per unit area: 1.11mN/mm2, derived fromLandmesser and Morris (1975)
Table 2
Average length of tissue (l), average area separating tibiotarsus and fibula (A) and stiffness (k) of springs, used to represent intervening tissue at HH30, HH32 and HH34. Young’s modulus of cartilage (E),
Stage Average length of tissue (l)
Average area of tissue (A) (mm2)
Stiffness
(k¼E*A/l) (kN/mm)
HH30 0.5 0.30 0.3
HH32 0.9 1.9 1.1
HH34 1.1 2.2 1.2
Fig. 2.Transverse sections through the distal femur (outlined in white) were immunostained for Phospho-histone H3 (red) and DAPI stained (blue), were subdivided into five separate regions (1–5) corresponding to the region adjacent to the intercondylar fossa (1), the dorsal and ventral side of the medial condyle (2, 3) and the dorsal and ventral side of the lateral condyle (4, 5) and examined by confocal microscopy. Within each region cell densities were calculated from two independent sections per specimen and 3 specimens per stage, within a region of 1.44 mm2
within the medial side of the femur was also reflected in elevated
stress and strain in the medial aspect of the interzone (not
shown).
3.3. Growth of the femoral condyles between HH30 and HH34
Growth of the femoral condyles was assessed by comparing
outlines of cartilage tissue from virtual sections of OPT
repre-sentations at stages HH30, HH32 and HH34 (Fig. 6a). Relative
growth of the condyles was compared by dividing each section in
two down the midline of the intercondylar fossa and calculating
the area of each side (Fig. 6b). This was repeated for four
specimens per stage. At HH30, the distal femur was a relatively
simple structure featuring a larger lateral condyle (Fig. 6c); the
cross-sectional area of the medial condyle was 44.6
7
3% of the
lateral condyle in this plane. At HH32, the medial side had grown
to 51.1
7
5% of the lateral side, an increase of approximately 6.5%
with respect to HH30. The most dramatic growth occurred
between stages HH32 and HH34 (Fig. 6f) with the emergence of
a more complex shape including several protrusions on the
ventral aspect of the lateral condyle (Fig. 6g). The area of the
medial condyle was now 65.4
7
8% of the lateral condyle, an
increase of approximately 14.3% on stage HH32 and 20.8% on
stage HH30. Therefore the medial condyle grows at an accelerated
rate relative to the lateral condyle.
3.4. Proliferation, growth and the emergence of shape
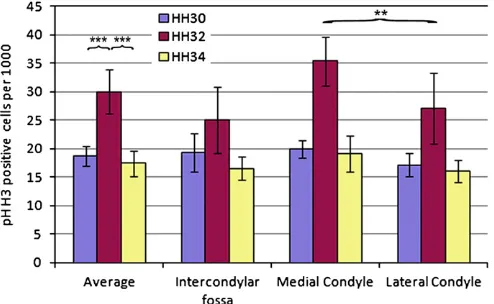
[image:4.595.83.502.60.281.2]Analysis of the relative number of proliferating cells in 5
locations across the distal femur; the dorsal and ventral aspects of
the medial and lateral condyles and the intercondylar fossa (exact
locations outlined in
Fig. 2) revealed a dramatic increase at HH32
relative to HH30 (s.e.
¼
0.1,
p
o
0.01) and HH34 (s.e.
¼
0.1,
p
o0.01)
(Fig. 7). Comparing individual regions it became apparent that the
Fig. 3.Patterns of biophysical stimuli are displayed on the external dorsal aspect of the femur (rows i, ii, indicated in D) and on a section through the femur (rows ii, iv, plane of section indicated in D) across stages HH30–34. Stimuli include Von Mises stress (A), Maximum principal stress (B) and Minimum principal stress (C). Arrow heads in panel A indicate the location of the region adjacent to the intercondylar fossa in all the sections. [image:4.595.125.463.339.504.2]number of proliferating cells varied depending on location within
the femur. At HH32, the increase in proliferating cells on the
medial side of the knee was more pronounced, with a significantly
greater number of proliferating cells on the medial side at HH32
(s.e.
¼
0.1,
p
¼
0.01). This was investigated using a generalised
linear mixed effects model where multiple sections were nested
within individuals (
R
) in order to take account of the nested
nature of the data and verified using a sequential Bonferroni test.
Proliferation at HH34 was lower than that recorded at HH32.
At this stage proliferation still appeared elevated on the medial
side relative to the lateral side of the femur, although significance
was not reached at HH30 or HH34 (R).
4. Discussion
[image:5.595.96.510.60.316.2]In this paper we hypothesised that both joint shape and
cell proliferation co-localise with the pattern of biophysical
stimuli generated by embryonic muscle contraction. Anatomically
accurate FE models of embryonic knee, across three stages
of development, revealed the complex dynamic pattern of
biophysical stimuli in the distal femur, including a consistent
increase in the loading of the medial condyle. Analysis of the
femoral condyles showed that the medial condyle grows more
than the lateral during this developmental period. Differential
rates of cell proliferation revealed a possible mechanism behind
Fig. 5.Predicted biophysical stimuli through the interzone of the developing knee joint shown on section planes indicated by red lines in A and B; transverse sections through the femoral condyles (A, i, vi), medial (B, ii, v) and lateral (B, iii, vi) longitudinal sections. White areas in each section represent the skeletal rudiments. Von mises stresses (C), fluid velocity (D), hydrostatic pressure (E) are shown.*indicates the region of the developing patella in C. Red arrows in D indicate elevated fluid velocity at the boundary of the skeletal rudiments (presumptive chondrogenous layers), elevated hydrostatic pressure midway between skeletal rudiments (presumptive intermediate layer) is indicated by blue arrows. (For interpretation of the references to color in this figure legend, the reader is referred to the web version of this article.) [image:5.595.153.453.393.529.2]this growth, whereby the medial condyle appeared to have a
higher proportion of proliferating cells than the other regions.
This trend was statistically significant at HH32 but not at HH30 or
HH34, possibly due to the small sample number (
n
¼
3). Thus a
relationship was found between elevated cartilage growth and
cell proliferation in the medial condyle of the knee; this, in turn,
associated with an increase in the magnitude of the biophysical
stimuli experienced within this condyle. It was also noted that
the proportion of proliferating cells in the region adjacent to the
intercondylar fossa remained constant over time and this region,
in turn, is highly loaded in both mid-flexion and mid-extension.
Thus the consistently high mechanical loading in the region
adjacent to the intercondylar fossa is associated with a constant
rate of cell proliferation. Therefore the variable pattern of loading
experienced by the condyles may have a stimulatory effect on
outgrowth, while the consistently elevated loading near the
intercondylar fossa maintains a consistent rate of cell
prolifera-tion. Growth would then be encouraged by dynamic loading in
the condyles, while the higher less dynamic loads near the
intercondylar fossa, predicted by the model, maintained a
consistent rate of proliferation.
The mechanoregulation of chondrocyte proliferation and
bio-synthesis has been extensively studied in a varied range of culture
systems and stimuli (reviewed in
McMahon et al., 2008b). It is
difficult to assess the individual effects of each of these potential
stimuli due to the differences between experiments; however
some trends do emerge from the data. Continuous loads or high
frequency, high magnitude loads inhibits cell processes such as
matrix synthesis and growth (Buschmann et al., 1995; Davisson
et al., 2002; Fukuda et al., 1997; Sironen et al., 2002; Wu and Chen,
2000), while low magnitude dynamic loading stimulates matrix
synthesis (Buschmann et al., 1995; Davisson et al., 2002; Fukuda
et al., 1997; Wu and Chen, 2000). Reduced chondrocyte
prolifera-tion was also recorded in DMB immobilised chick growth plates
(Germiller and Goldstein, 1997). Mechanical forces have also been
shown to regulate cell differentiation; particularly adult MSCs have
demonstrated an ability to differentiate into chondrocytes in
response to intermittent hydrostatic pressure (Angele et al.,
2003), and cyclic compressive loading (Angele et al., 2003; Huang
et al., 2004) and cyclic strain (McMahon et al., 2008a).
Some simplifications included in the models should be
mentioned. The choice to focus only on the loads applied to the
knee by the thigh musculature overlooks what influence the
shank muscles may play in the emergence of shape. However,
while it is likely that the shank muscles exert forces on the knee
joint, such forces would be predominately applied to the lower
portions of the tibiotarsus, as represented in
Nowlan et al.
(2008a). Since this work focused on the patterns of loading rather
than the magnitude of the individual loads, a single measurement
for muscle force (derived from
Landmesser and Morris, 1975) was
deemed to be sufficient, particularly as muscle size is already
accounted for. Another limitation is the shape of the mesh model
representing the interzone, particularly its ventral side, which
was defined only by adjacent muscles masses. However patterns
of stimuli at or close to the ventral boundary are not interpreted
here, with focus on the deeper tissues of the interzone and regions
under the capsule.
The material properties of both embryonic cartilage and
interzone tissues were measured using AFM and analysed using
the Hertz model. A proportion (20–40%) of the force curves were
removed during analysis because the height variation across the
section being scanned was larger than the piezo range, rendering
the curves unusable. Other curves did not fit the Hertz model
(approximately 20%) and had to be eliminated from the analysis.
The Hertz model makes a number of assumptions including that
the material being tested is both homogenous and isotropic.
Failure to meet these conditions due to local changes in the
extracellular matrix or cell density could explain why certain
curves do not always fit the Hertz model. The cartilage material
properties (0.535
7
0.072 kPa) measured by AFM were softer than
those previously published for other cartilage tissues using
different methods and older cartilage.
Tanck et al. (2004)
derived
a Young’s modulus of 1.11
7
0.62 MPa, while
Mikic et al. (2004)
recorded 0.08 MPa. However our results were in the range of
values previously recorded for cartilage extracellular matrix
determined using AFM (Allen and Mao, 2004). For the purposes
of the FE model, the relative stiffness of the cartilage and the
interzone (0.535
7
0.072 and 0.287
7
0.066 kPa, respectively) was
of particular importance providing important information on the
relative stiffness of embryonic tissues for the first time. It would be
expected that the material properties of embryonic cartilage and
the interzone would change over time. We did not include this in
the model because of the technical difficulties and time
con-straints associated with using AFM to derive material properties.
A limited number of studies have aimed to investigate the
mechanobiology of shape emergence in joints (Heegaard et al.,
1999; Shefelbine and Carter, 2004; Shefelbine et al., 2002). While
these models cannot be compared directly to the 3D model
presented in this paper, they do support the role of
mechan-oregulation in joint morphogenesis.
Nowlan et al. (2008a)
created
an FE model based on realistic tibiotarsal morphologies, revealing
the importance of dynamic patterns of biophysical stimuli in bone
development in the embryo. This paper indicates a regulatory link
between cell proliferation and tissue growth in the embryo with
the pattern of biophysical stimuli generated by muscle
contrac-tion; however further analysis of how these patterns influence
cell behaviour is required.
[image:6.595.36.283.59.211.2]Previous studies of joint development in the chick have
indicated that preventing muscle contraction can prevent articular
cartilage and patella formation (Drachman and Sokoloff, 1966;
Mikic et al., 2000). FE analysis of the interzone indicated that the
articular cartilages and patella develop under the influence of very
specific patterns of biophysical stimuli. The chondrogenous layers,
which ultimately form the articular cartilages (Mitrovic, 1977),
emerge from locations, which experience a very distinct pattern of
elevated fluid flow of between 0.4 and 0.8
m
m/s depending on the
stage. In contrast the patella develops under much higher
magnitudes of stress, fluid velocity and pore pressure.
Prendergast
et al. (1997)
proposed that a combination of shear strain and fluid
flow regulates cell differentiation in the skeleton, in a model
Fig. 7.The number of phospho Histone H3 positive cells normalized to cell densitycorroborated by experimental results (Isaksson et al., 2006;
Khayyeri et al., 2009). The boundaries for chondrogenic
differ-entiation were also corroborated by analysing the strain and fluid
experienced by MSCs undergoing chondrogenesis in a 3D scaffold
(McMahon et al., 2008a). The biophysical stimuli to which the
developing articular cartilage are exposed are well within the
range proposed by
Prendergast et al. (1997). The specific patterns
of biophysical stimulation in the joint interzone could indicate
that mechanoregulation is vital not only for the regulation of
shape in the embryonic skeleton, but also vital for the definition of
cell fate and resulting tissue boundaries.
Conflict of interest statement
The authors (K.A. Roddy, G.M. Kelly, M.H. van Es, P. Murphy
and P.J. Prendergast) declare that they have no conflict of interest.
We confirm that all authors were fully involved in the study and
preparation of this manuscript, and that the material within has
not been submitted for publication elsewhere.
Acknowledgements
This work was partially funded by a studentship from Trinity
College Dublin (SFI AOIP interdisciplinary programme) and by
Science Foundation Ireland (Programme Award 02/IN1/B267 and
07/IN1/B931). The authors thank Dr. Jason Kilpatrick and Dr. Niamh
Nowlan for their contribution to this work.
References
Allen, D.M., Mao, J.J., 2004. Heterogeneous nanostructural and nanoelastic properties of pericellular and interterritorial matrices of chondrocytes by atomic force microscopy. Journal of Structural Biology 145, 196–204. Angele, P., Yoo, J.U., Smith, C., Mansour, J., Jepsen, K.J., Nerlich, M., Johnstone, B.,
2003. Cyclic hydrostatic pressure enhances the chondrogenic phenotype of human mesenchymal progenitor cells differentiated in vitro. Journal of Orthopaedic Research 21, 451–457.
Buschmann, M., Gluzband, Y., Grodzinsky, A., Hunziker, E., 1995. Mechanical compression modulates matrix biosynthesis in chondrocyte/agarose culture. Journal of Cell Science 108, 1497–1508.
Carter, D.R., Wong, M., 1988. The role of mechanical loading histories in the development of diarthrodial joints. Journal of Orthopaedic Research 6, 804–816.
Davisson, T., Kunig, S., Chen, A., Sah, R., Ratcliffe, A., 2002. Static and dynamic compression modulate matrix metabolism in tissue engineered cartilage. Journal of Orthopaedic Research 20, 842–848.
Drachman, D.B., Sokoloff, L., 1966. The role of movement in embryonic joint development. Developmental Biology 14, 401–420.
Fukuda, K., Asada, S., Kumano, F., Saitoh, M., Otani, K., Tanaka, S., 1997. Cyclic tensile stretch on bovine articular chondrocytes inhibits protein kinase C activity. Journal of Laboratory and Clinical Medicine 130, 209–215. Germiller, J.A., Goldstein, S.A., 1997. Structure and function of embryonic growth
plate in the absence of functioning skeletal muscle. Journal of Orthopaedic Research 15, 362–370.
Hamburger, V., Hamilton, H.L., 1951. A series of normal stages in the development of the chick embryo. Journal of Morphology 88, 49–92.
Heegaard, J.H., Beaupre´, G.S., Carter, D.R., 1999. Mechanically modulated cartilage growth may regulate joint surface morphogenesis. Journal of Orthopaedic Research 17, 509–517.
Hertz, H., 1882. Ueber die Ber ¨uhrung fester elastischer K ¨orper.Journal f¨ur die Reine und Angewandte Mathematik.1882, 156–171.
Huang, C.Y.C., Kristen, L.H., Lauren, E.F., Yubo, S., Herman, S.C., 2004. Effects of cyclic compressive loading on chondrogenesis of rabbit bone-marrow derived mesenchymal stem cells. Stem Cells 22, 313–323.
Hutter, J.L., Bechhoefer, J., 1993. Calibration of atomic-force microscope tips. Review of Scientific Instruments 64, 1868–1873.
Isaksson, H., Wilson, W., van Donkelaar, C.C., Huiskes, R., Ito, K., 2006. Comparison of biophysical stimuli for mechano-regulation of tissue differentiation during fracture healing. Journal of Biomechanics 39, 1507–1516.
Kelly, D.J., Prendergast, P.J., 2005. Mechano-regulation of stem cell differentiation and tissue regeneration in osteochondral defects. Journal of Biomechanics 38, 1413–1422.
Khayyeri, H., Checa, S., T ¨agil, M., Prendergast, P.J., 2009. Corroboration of mechanobiological simulations of tissue differentiation in an in vivo bone
chamber using a lattice-modeling approach. Journal of Orthopaedic Research 27, 1659–1666.
Koyama, E., Shibukawa, Y., Nagayama, M., Sugito, H., Young, B., Yuasa, T., Okabe, T., Ochiai, T., Kamiya, N., Rountree, R.B., Kingsley, D.M., Iwamoto, M., Enomoto-Iwamoto, M., Pacifici, M., 2008. A distinct cohort of progenitor cells participates in synovial joint and articular cartilage formation during mouse limb skeletogenesis. Developmental Biology 316, 62–73.
Landmesser, L., Morris, D.G., 1975. The development of functional innervation in the hind limb of the chick embryo. The Journal of Physiology 249, 301–326. McMahon, L., Reid, A., Campbell, V., Prendergast, P., 2008a. Regulatory effects of
mechanical strain on the chondrogenic differentiation of MSCs in a collagen-GAG Scaffold: experimental and computational analysis. Annals of Biomedical Engineering 36, 185–194.
McMahon, L.A., O’Brien, F.J., Prendergast, P.J., 2008b. Biomechanics and mechan-obiology in osteochondral tissues. Regenerative Medicine 3, 743–759. Mikic, B., Isenstein, A.L., Chhabra, A., 2004. Mechanical modulation of cartilage
structure and function during embryogenesis in the chick. Annals of Biomedical Engineering 32, 18–25.
Mikic, B., Johnson, T.L., Chhabra, A.B., Schalet, B.J., Wong, M., Hunziker, E.B., 2000. Differential effects of embryonic immobilization on the development of fibrocartilaginous skeletal elements. Journal of Rehabilatation Research and Development 37, 127–133.
Mitrovic, D.R., 1977. Development of the metatarsophalangeal joint of the chick embryo: morphological, ultrastructural and histochemical studies. American Journal of Anatomy 150, 333–347.
Murray, P.D., Drachman, D.B., 1969. The role of movement in the development of joints and related structures: the head and neck in the chick embryo. Journal of Embryology and Experimental Morphology 22, 349–371.
Nowlan, N.C., Murphy, P., Prendergast, P.J., 2008a. A dynamic pattern of mechanical stimulation promotes ossification in avian embryonic long bones. Journal of Biomechanics 41, 249–258.
Nowlan, N.C., Prendergast, P.J., Murphy, P., 2008b. Identification of mechanosensi-tive genes during embryonic bone formation. PLoS Computational Biology 4, e1000250.
Osborne, A.C., Lamb, K.J., Lewthwaite, J.C., Dowthwaite, G.P., Pitsillides, A.A., 2002. Short-term rigid and flaccid paralyses diminish growth of embryonic chick limbs and abrogate joint cavity formation but differentially preserve pre-cavitated joints. Journal of Musculoskeletal and Neuronal Interaction 2, 448–456. Persson, M., 1983. The role of movements in the development of sutural and
diarthrodial joints tested by long-term paralysis of chick embryos. Journal of Anatomy 137 (Pt 3), 591–599.
Prendergast, P.J., Huiskes, R., Søballe, K., 1997. Biophysical stimuli on cells during tissue differentiation at implant interfaces. Journal of Biomechanics 30, 539–548. Radhakrishnan, P., Lewis, N.T., Mao, J.J., 2004. Zone-specific micromechanical properties of the extracellular matrices of growth plate cartilage. Annals of Biomedical Engineering 32, 284–291.
Roddy, K.A., Nowlan, N.C., Prendergast, P.J., Murphy, P., 2009. 3D representation of the developing chick knee joint: a novel approach integrating multiple components. Journal of Anatomy 214, 374–387.
Rotsch, C., Braet, F., Wisse, E., Radmacher, M., 1997. AFM imaging and elasticity measurements on living rat liver macrophages. Cell Biology International 21, 685–696.
Shefelbine, S.J., Carter, D.R., 2004. Mechanobiological predictions of growth front morphology in developmental hip dysplasia. Journal of Orthopaedic Research 22, 346–352.
Shefelbine, S.J., Tardieu, C., Carter, D.R., 2002. Development of the femoral bicondylar angle in hominid bipedalism. Bone 30, 765–770.
Sironen, R.K., Karjalainen, H.M., Elo, M.A., Kaarniranta, K., Torronen, K., Takigawa, M., Helminen, H.J., Lammi, M.J., 2002. cDNA array reveals mechanosensitive genes in chondrocytic cells under hydrostatic pressure. Biochimica et Biophysica Acta 1591, 45–54.
Sneddon, I.N., 1965. The relation between load and penetration in the axisym-metric Boussinesq problem for a punch of arbitrary profile. International Journal of Engineering Science 3, 47–57.
Stevens, S.S., Beaupre´, G.S., Carter, D.R., 1999. Computer model of endochondral growth and ossification in long bones: biological and mechanobiological influences. Journal of Orthopaedic Research 17, 646–653.
Stolz, M., Raiteri, R., Daniels, A.U., Van Landingham, M.R., Baschong, W., Aebi, U., 2004. Dynamic elastic modulus of porcine articular cartilage determined at two different levels of tissue organization by indentation-type atomic force microscopy. Biophysical Journal 86, 3269–3283.
Summerhurst, K., Stark, M., Sharpe, J., Davidson, D., Murphy, P., 2008. 3D representation of Wnt and Frizzled gene expression patterns in the mouse embryo at embryonic day 11.5 (Ts19). Gene Expression Patterns 8, 331–348. Tanck, E., Blankevoort, L., Haaijman, A., Burger, E.H., Huiskes, R., 2000. Influence of
muscular activity on local mineralization patterns in metatarsals of the embryonic mouse. Journal of Orthopaedic Research 18, 613–619.
Tanck, E., Van Donkelaar, C.C., Jepsen, K.J., Goldstein, S.A., Weinans, H., Burger, E.H., Huiskes, R., 2004. The mechanical consequences of mineralization in embryonic bone. Bone 35, 186–190.
Wilsman, N.J., Leiferman, E.M., Fry, M., Farnum, C.E., Barreto, C., 1996. Differential growth by growth plates as a function of multiple parameters of chondrocytic kinetics. Journal of Orthopaedic Research 14, 927–936.