Czech J. Anim. Sci., 63, 2018 (8): 305–312 Original Paper
https://doi.org/10.17221/21/2018-CJAS
Supported by the Ministry of Education, Youth and Sports of the Czech Republic (S grant) and by the Ministry of Agriculture of the Czech Republic (Project No. MZeRO0714).
Response to Selection of a Breeding Program
for Suffolk Sheep in the Czech Republic
Martin Ptáček
1*, Jaromír Ducháček
1, Jitka Schmidová
2, Luděk Stádník
11Department of Animal Husbandry, Faculty of Agrobiology, Food and Natural Resources,
Czech University of Life Sciences Prague, Prague, Czech Republic
2Institute of Animal Science, Prague-Uhříněves, Czech Republic
*Corresponding author: [email protected]
ABSTRACT
Ptáček M., Ducháček J., Schmidová J., Stádník L. (2018): Response to selection of a breeding program for
Suffolk sheep in the Czech Republic. Czech J. Anim. Sci., 63, 305–312.
Lamb growth performance traits in relation to parental breeding values (BVs) for these traits were evaluated in a purebred Suffolk sheep population in the Czech Republic. The research lasted over 8 years and included 24 886 lambs. Four relevant parental BVs were observed: BV predicted for lamb live weight direct effect (BVLW-DE), BV predicted for lamb live weight maternal effect (BVLW-ME), BV predicted for lamb musculus longissimus lumborum et thoracis depth (BV-MLLT), and BV predicted for lamb backfat thickness (BV-BT). The lamb live weight (LW; kg), musculus longissimus lumborum et thoracis depth (MLLT; mm), and backfat thickness (BT; mm) were assessed at 100 days of age. A dataset was created using the most current parental BVs for each year (2007–2014) and subsequent growth traits of their lambs in the next season (2008–2015). Linear regres-sions showed an increased tendency when one point in dam BVs was associated with an increase in lamb LW (0.393 kg; P < 0.01 in BVLW-DE and 0.090 kg; P < 0.05 in BVLW-ME), MLLT (0.340 mm; P < 0.01 in BV-MLLT), or BT (0.243; P < 0.01 mm in BV-BT). Lower (but significant – P < 0.01) values on linear regression were detected for sire BVs, when 0.135 kg of LW, 0.217 mm of MLLT, and 0.214 mm of BT corresponded to 1-point increases of BVLW-DE, BV-MLLT, or BV-BT. This was confirmed by ANOVA evaluation, especially for LW and MLLT traits. Maximal differences (P < 0.05) in lamb LW were 1.84 kg or 0.88 kg regarding to dam or sire BVLW-DE groups. Similarly, the difference (P < 0.05) in lamb MLLT reached 0.82 mm in dam BV-MLLT, while 0.57 mm was detected in sire BV-MLLT groups. These results have practical implications for the objectives of selection schemes used in the Suffolk sheep population in the Czech Republic.
Keywords: lamb; breeding values; growth performance traits; performance recording
World mutton meat production totals 9 million tons per year (Cawthorn and Hoffman 2014). The Czech sheep production sector has been primarily oriented towards meat production, from prac-tically 90%. Suffolk is the most abundant meat
sheep breed in the Czech Republic (Ptacek et al.
non-prolific period. Therefore, the effort is aimed at improving lamb growth abilities; especially in breeds intended for paternal position in breeding scheme for meat production. Effective improve-ment of growth performance traits can be ensured by correctly performed selection, with regard to an applied breeding program. Since 2003, breed-ing values (BVs) have been estimated in the Czech Republic by the Best linear unbiased prediction (BLUP) animal model method (Schmidova et al. 2014). BVs for live weight direct effect and ma-ternal effect, musculus longissimus lumborum et thoracis depth, and backfat thickness are predicted for particular growth performance traits based on individual growth performance or the character-istics of previous progeny (Wolfova et al. 2011). Lamb growth traits are performance recorded in the Czech Republic at 100 days of age (in the range 70–130 days of age). Lamb live weight and ultrasound measurements of musculus longissimus lumborum et thoracis depth and backfat thickness are determined by official measurements (Milerski et al. 2006; Maxa et al. 2007; Svitakova et al. 2014).
Previous studies have described the genetic trends of different sheep populations; improve-ments in the sheep population genotypes was noted based on the increase in positive BVs during the observation period (Shrestha et al. 1996; Hanford et al. 2003; Gizaw et al. 2007). Simm et al. (2002) compared a selected Suffolk population with a control population in an attempt to describe the response to selection for lean growth. Simm et al. (2001) also tested sire referencing schemes, widely used in breeding programs in Great Britain, for genetic improvement in meat sheep breeds. The authors documented positive genetic progress in animals from those flocks compared with a con-trol population. Other studies have investigated relationships between selection schemes in dif-ferent countries (Santos et al. 2015), genetic and non-genetic factors affecting growth traits (Gizaw et al.2007; Vostry and Milerski 2013; Mortimer et al. 2014; Ptacek et al. 2017a, b), and economic models related to these attributes (Wolfova et al. 2009). This study differed from previous reports because it assessed the manifestation of pheno-typical values of lamb growth traits corrected by environmental effects in relation to the genetic predisposition of parents. Therefore, the results of this study may be useful for sheep breeders and scientists who rely on genetic trends in
popula-tions expressed by individual BVs to verify the breeding program.
The aim of this study was to evaluate lamb growth performance traits in relation to parental BVs for these traits in a purebred Suffolk population in the Czech Republic. Therefore, the results aim to verify the breeding program applied in the Czech Republic and to elaborate recommendations for the selection of dams and sires used for sheep reproduction.
MATERIAL AND METHODS
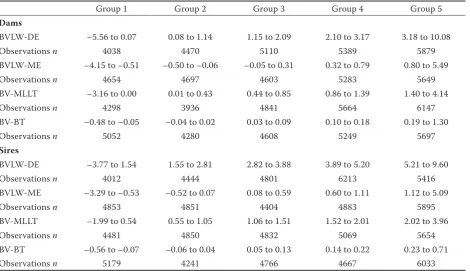
Data collection.The study was performed using a Suffolk sheep purebred population from 151 dif-ferent flocks during an 8-year period; in total, 9831 dams and 677 sires were monitored. Five groups (20% for each group) were created based on the frequency distribution of BVs for individual dams and sires (Table 1): breeding value predicted for lamb live weight at 100 days of age – direct effect (BVLW-DE), breeding value predicted for lamb live weight at 100 days of age – maternal effect (BVLW-ME), breeding value predicted for lamb live musculus longissimus lumborum et thoracis
depth at 100 days of age (BV-MLLT), and breed-ing value predicted for lamb backfat thickness at 100 days of age (BV-BT). BVs for dams and sires were provided by the Union of Sheep and Goat Breeders in the Czech Republic using the BLUP animal model method.
Growth performance traits of lambs were mea-sured in the official manner authorised by the Council of Herd Book of the Union of Sheep and Goat Breeders in the Czech Republic. The lambs’ performance was recorded at an average age of 100 days (observations at days 70–130 of age re-calculated on the average age of 100 days). The evaluation included live weight of lambs (LW; kg) and ultrasound measurements of musculus longis-simus lumborum et thoracis depth (MLLT; mm) and backfat thickness (BT; mm) performed in the area of the last thoracis vertebra(Milerski et al. 2006).
Czech J. Anim. Sci., 63, 2018 (8): 305–312 Original Paper
https://doi.org/10.17221/21/2018-CJAS
those with parents with predicted and available BVs in the official dataset. Additionally, outliers were excluded from the trial.
Statistical analysis. Statistical analyses were performed using SAS/STAT9.3 (2011). Procedure MEANS was used to determine genetic trends in the Suffolk sheep population, expressed as mean breed-ing values by year of birth. Factors in the model were selected based on the STEPWISE method REG procedure and grouped as follows: flock (151 levels), year of observation (2007/2008, n = 2344; 2008/2009, n = 2601; 2009/2010, n = 2287; 2010/2011, n = 3197; 2011/2012, n = 3168; 2012/2013, n = 2786; 2013/2014, n = 3963; 2014/2015, n = 4540), season of lambing (Oc-tober to February, n = 4456; March, n = 8049; April, n = 9483; May to July, n = 2898), litter size (singles, n = 5437; twins, n = 16 329; triplets and quadruplets, n = 3120), sex of lamb (ewe lambs,
n = 12 766; ram lambs, n = 12 120), age of dam at lambing (1 year, n = 1026; 2 years, n = 4750; 3 years,
n = 5813; 4 years, n = 4769; 5 years, n = 3599; 6 years, n = 2493; 7 years and older, n = 2436).
Linear regression. The GLM procedure was used to determine linear regressions between individual values of parental BVs and the subsequent growth performance traits of lambs, such that relation-ships between BVLW-DE and LW, BVLW-ME and LW, BV-MLLT and MLLT, or BV-BT and BT were assessed. All the linear regressions were corrected for flock, year, season of lambing, litter size, age of dam at lambing, and sex of lambs. Addition-ally, linear regressions for the BVs of dam were corrected for groups of sire BVs and vice versa.
ANOVA evaluation. The influence of groups of parental BVs (Table 1) on lamb growth performance traits was tested by analysis of variance (ANOVA), such that the effects of dam or sire groups of BVLW-DE on LW, BVLW-ME on LW, BV-MLLT on MLLT, or BV-BT on BT were investigated. A generalised model with fixed effects of year, flock, season of lambing, litter size, age of dam at lambing, sex of lambs, groups of dam BVs, or groups of sire BVs was used to examine the effects of groups of parental BVs on the growth performance of their offspring. Differences estimated between
vari-Table 1. Breeding values for dam and sire groups
Group 1 Group 2 Group 3 Group 4 Group 5
Dams
BVLW-DE –5.56 to 0.07 0.08 to 1.14 1.15 to 2.09 2.10 to 3.17 3.18 to 10.08
Observations n 4038 4470 5110 5389 5879
BVLW-ME –4.15 to –0.51 –0.50 to –0.06 –0.05 to 0.31 0.32 to 0.79 0.80 to 5.49
Observations n 4654 4697 4603 5283 5649
BV-MLLT –3.16 to 0.00 0.01 to 0.43 0.44 to 0.85 0.86 to 1.39 1.40 to 4.14
Observations n 4298 3936 4841 5664 6147
BV-BT –0.48 to –0.05 –0.04 to 0.02 0.03 to 0.09 0.10 to 0.18 0.19 to 1.30
Observations n 5052 4280 4608 5249 5697
Sires
BVLW-DE –3.77 to 1.54 1.55 to 2.81 2.82 to 3.88 3.89 to 5.20 5.21 to 9.60
Observations n 4012 4444 4801 6213 5416
BVLW-ME –3.29 to –0.53 –0.52 to 0.07 0.08 to 0.59 0.60 to 1.11 1.12 to 5.09
Observations n 4853 4851 4404 4883 5895
BV-MLLT –1.99 to 0.54 0.55 to 1.05 1.06 to 1.51 1.52 to 2.01 2.02 to 3.96
Observations n 4481 4850 4832 5069 5654
BV-BT –0.56 to –0.07 –0.06 to 0.04 0.05 to 0.13 0.14 to 0.22 0.23 to 0.71
Observations n 5179 4241 4766 4667 6033
BVLW-DE = breeding value predicted for lamb live weight at 100 days of age – direct effect (kg), BVLW-ME = breeding value predicted for lamb live weight at 100 days of age – maternal effect (kg), BV-MLLT = breeding value predicted for lamb
[image:3.595.65.536.434.705.2]Original Paper Czech J. Anim. Sci., 63, 2018 (8): 305–312
https://doi.org/10.17221/21/2018-CJAS
ables were tested by the Tukey-Kramer method at a significance level of P < 0.05.
RESULTS
Genetic trends in the Suffolk sheep population.
Genetic trends for evaluated BVs in the Suffolk sheep population are presented in Figures 1 and 2. A posi-tive genetic trend was demonstrated by an annual increase of 158.8 g BVLW-DE from 2007 to 2014, while the genetic trend for BVLW-ME was close to zero during this period. Annual genetic progress in the Suffolk population was 0.07 mm in BV-MLLT from 2007 to 2014. A small, but positive, improve-ment in genetic predisposition (0.004 mm) was also noted in BV-BT during the observation period.
Model description. Results of the linear regres-sion models and ANOVA evaluation used to explain the variation in growth performance traits were significant (r2 = 0.32 to 0.40; P < 0.01). Season of lambing in the evaluation of BV-MLLT on MLLT,
and the effect of sire BVLW-ME on LW were not significant in the linear regression models and ANOVA evaluation. All other factors in the models were significant.
Linear regression.Table 2 shows the linear relation-ships between parental BVs and lamb growth per-formance attributes, after correction for the defined factors in the model. A significant positive effect of parental BV was detected on growth performance attributes in all BVs, except for sire BVLW-ME on the LW of subsequent lambs. An increase of one point in dam BVs was associated with a significant increase in lamb LW (0.393 kg in BVLW-DE and 0.090 kg in BVLW-ME), MLLT (0.340 mm in BV-MLLT), or BT (0.243 mm in BV-BT). Generally, lower values on linear regression were detected for sire BVs, when 0.135 kg of LW, 0.217 mm of MLLT, and 0.214 mm of BT corresponded to 1-point increases of BVLW-DE, BV-MLLT, or BV-BT.
ANOVA evaluation. The effects of dam and sire BV groups on the growth performance of lambs are presented in Tables 3–5. Generally, parents
Figure 2. Genetic trends in BV-MLLT and BV-BT during the observation period
BV-MLLT = breeding value predicted for lamb musculus longissimus lumborum et thoracis depth at 100 days of age, BV-BT = breeding value predicted for lamb backfat thickness at 100 days of age
Figure 1. Genetic trend of BVLW-DE and BVLW-ME during the observation period
BVLW-DE = breeding value predicted for lamb live weight at 100 days of age – direct effect, BVLW-ME = breeding value predicted for lamb live weight at 100 days of age – maternal effect
0 10 0.20 0.30 0.40 1.00 1.50 2.00 2.50 3.00 BV LW -M E (k g) BV LW -D E ( kg ) 0.00 0.10 0.00 0.50
2007 2008 2009 2010 2011 2012 2013 2014 Year of observing
BVLW-DE BVLW-ME 0 10 0.20 0.30 0.40 1.00 1.50 2.00 2.50 3.00 BV LW -M E (k g) BV LW -D E ( kg ) 0.00 0.10 0.00 0.50
2007 2008 2009 2010 2011 2012 2013 2014
Year of observing
BVLW-DE BVLW-ME 0 10 0.20 1.00 1.50 BV LW -M E (k BV LW -D E (k 0.00 0.10 0.00 0.50
2007 2008 2009 2010 2011 2012 2013 2014
Year of observing
BVLW-DE BVLW-ME 0 10 0.20 0.30 0.40 1.00 1.50 2.00 2.50 3.00 BV LW -M E (k g) BV LW -D E ( kg ) 0.00 0.10 0.00 0.50
2007 2008 2009 2010 2011 2012 2013 2014
Year of observing
BVLW-DE BVLW-ME 3.0 2.5 2.0 1.5 1.0 0.5 0.0 0.4 0.3 0.2 0.1 0.0 2007 2008 2009 2010 2011 2012 2013 2014
Years of observing
0.06 0.08 0.10 0.40 0.60 0.80 1.00 1.20 BV -BT (mm ) BV -M LL T (mm ) 0.04 0.00 0.20
2007 2008 2009 2010 2011 2012 2013 2014
Year of observing
BV-MLLT BV-BT 1.2 1.0 0.8 0.6 0.4 0.2 0.0 0.10 0.08 0.06 0.04 2007 2008 2009 2010 2011 2012 2013 2014
Years of observing
0.06 0.08 0.10 0.40 0.60 0.80 1.00 1.20 BV -BT (mm ) BV -M LL T (mm ) 0.04 0.00 0.20
2007 2008 2009 2010 2011 2012 2013 2014
Year of observing
BV-MLLT BV-BT 0.06 0.08 0.10 0.40 0.60 0.80 1.00 1.20 BV -BT (mm ) BV -M LL T (mm ) 0.04 0.00 0.20
2007 2008 2009 2010 2011 2012 2013 2014
Year of observing
BV-MLLT BV-BT 0.06 0.08 0.10 0.40 0.60 0.80 1.00 1.20 BV -BT (mm ) BV -M LL T (mm ) 0.04 0.00 0.20
2007 2008 2009 2010 2011 2012 2013 2014
Year of observing
Czech J. Anim. Sci., 63, 2018 (8): 305–312 Original Paper
https://doi.org/10.17221/21/2018-CJAS
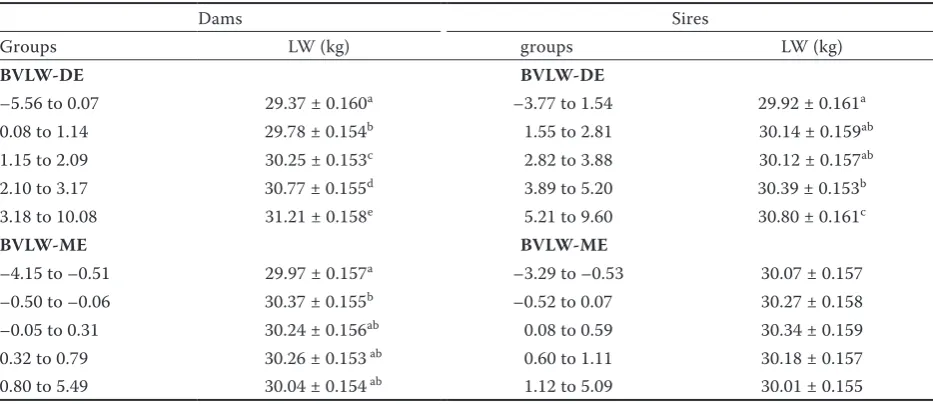
with a better genetic predisposition (group BVs: 4 or 5) produced offspring with higher growth performance attributes than did parents with poor genetic predisposition (group BVs: 1 or 2). This was demonstrated in all evaluated BVs. In con-trast, no differences were detected among groups of parental BVLW-ME and lamb LW. Significant differences were more variable among the dam
[image:5.595.66.532.110.270.2]BVs groups than among sire BVs groups. Namely, maximal variability in lamb LW with regard to dam BVLW-DE was 4.47%, while 2.87% maximal variability was detected among sire BVLW-DE groups. Similarly, the difference in lamb MLLT reached 0.82 mm in dam BV-MLLT, while a lower value of 0.25 mm was detected in sire BV-MLLT. Clearly, a positive tendency was detected in the
Table 2. Linear regressions among parental breeding values and the growth performance of lambs
Breeding value Variable Linear regression r2 P model
Dams
BVLW-DE LW y = 21.257 + 0.393x** 0.396 **
BVLW-ME LW y = 21.044 + 0.090x* 0.391 **
BV-MLLT MLLT y = 22.183 + 0.370x** 0.322 **
BV-BT BT y = 2.571 + 0.243x** 0.322 **
Sires
BVLW-DE LW y = 21.937 + 0.135x** 0.397 **
BVLW-ME LW y = 21.052 – 0.047xns 0.391 **
BV-MLLT MLLT y = 22.234 + 0.217x** 0.323 **
BV-BT BT y = 2.596 + 0.214x** 0.323 **
BV = breeding value, BVLW-DE = breeding value predicted for lamb live weight at 100 days of age – direct effect (kg), BVLW-ME = breeding value predicted for lamb live weight at 100 days of age – maternal effect (kg), BV-MLLT = breeding value predicted for lamb musculus longissimus lumborum et thoracis depth at 100 days of age (mm), BV-BT = breeding value predicted for lamb backfat thickness at 100 days of age (mm), LW = lamb live weight at 100 days of age, MLLT = lamb musculus longissimus lumborum et thoracis depth at 100 days of age, BT = lamb backfat thickness at 100 days of age *significant at P < 0.01, **significant at P < 0.001, nsnonsignificant
Table 3. Effect of parental breeding values for direct and maternal effects on lamb live weight at 100 days of age
Dams Sires
Groups LW (kg) groups LW (kg)
BVLW-DE BVLW-DE
–5.56 to 0.07 29.37 ± 0.160a –3.77 to 1.54 29.92 ± 0.161a
0.08 to 1.14 29.78 ± 0.154b 1.55 to 2.81 30.14 ± 0.159ab
1.15 to 2.09 30.25 ± 0.153c 2.82 to 3.88 30.12 ± 0.157ab
2.10 to 3.17 30.77 ± 0.155d 3.89 to 5.20 30.39 ± 0.153b
3.18 to 10.08 31.21 ± 0.158e 5.21 to 9.60 30.80 ± 0.161c
BVLW-ME BVLW-ME
–4.15 to –0.51 29.97 ± 0.157a –3.29 to –0.53 30.07 ± 0.157
–0.50 to –0.06 30.37 ± 0.155b –0.52 to 0.07 30.27 ± 0.158
–0.05 to 0.31 30.24 ± 0.156ab 0.08 to 0.59 30.34 ± 0.159
0.32 to 0.79 30.26 ± 0.153 ab 0.60 to 1.11 30.18 ± 0.157
0.80 to 5.49 30.04 ± 0.154 ab 1.12 to 5.09 30.01 ± 0.155
BVLW-DE = breeding value predicted for lamb live weight at 100 days of age – direct effect (kg), BVLW-ME = breeding value predicted for lamb live weight at 100 days of age – maternal effect (kg), LW = lamb live weight at 100 days of age (Least Squares Means ± standard error)
[image:5.595.64.531.504.706.2]BT and BV-BT of dams. In contrast, relatively low variability was found in BV-BT in sires. Despite this low variability, the group with the lowest BV-BT had the lowest values for lamb BT in both parental populations.
DISCUSSION
The study aimed to evaluate growth performance traits of lambs in relation to the BVs of their par-ents, thus, to verify the selection scheme applied in the Czech Republic. Generally, the objective of breeding programs is to obtain genetic gains in the population, as also monitored in previous studies. Hanford et al. (2002, 2003) found an increase in BV for weaning weight at 120 days of age (+4.0 or +7.5 kg) in Columbia or Targhee sheep during the period 1956–1998. The positive development of BV for live weight at 12 weeks of age (from 1.07 kg in 1998 to
[image:6.595.65.532.126.225.2]3.07 kg in 2003) in the fat-tailed Menz sheep breed was noted by Gizaw et al. (2007). The same tendency of BV for growth performance traits at different ages has been described in various sheep breeds by Shrestha et al. (1996), Shaat et al. (2004), Mokhtari and Rashidi (2010), and Gholizadeh and Ghafouri-Kesbi (2015). A genetic progress was also clear in the evaluated BVs of the Suffolk population in the present study. These results provide good assump-tions for accuracy of the breeding process. However, the response of breeding programs, expressed by genetic trends in the population, primarily shows whether the breeders select animals with regards to their breeding values. Nevertheless, this method does not directly reflect the relationship between the genetic predisposition of parents for growth performance traits and their manifestation in off-spring. The results of the present study confirm that the BVs of parents have a positive impact on the growth performance of lambs at 100 days of age.
Table 4. Effect of parental breeding values for musculus longissimus lumborum et thoracis depth on lamb musculus longissimus lumborum et thoracis depth at 100 days of age
Dams Sires
BV-MLLT groups MLLT (mm) BV-MLLT groups MLLT (mm)
–3.16 to 0.00 24.59 ± 0.095a –1.99 to 0.54 24.86 ±0.094ab
0.01 to 0.43 24.92 ± 0.096b 0.55 to 1.05 24.76 ± 0.095a
0.44 to 0.85 24.99 ± 0.092bc 1.06 to 1.51 25.00 ± 0.093bc
0.86 to 1.39 25.18 ± 0.090c 1.52 to 2.01 25.14 ± 0.095cd
1.40 to 4.14 25.41 ± 0.092d 2.02 to 3.96 25.33 ± 0.092d
BV-MLLT = breeding value predicted for lamb musculus longissimus lumborum et thoracis depth at 100 days of age (mm), MLLT = lamb musculus longissimus lumborum et thoracis depth at 100 days of age (values are Least Squares Means ± standard error)
a–ddifferent superscripts within columns indicate that means differ at P < 0.05
Table 5. Effect of parental breeding values for backfat thickness on subsequent backfat thickness of their lambs at 100 days of age
Dams Sires
BV-BT groups BT (mm) BV-BT groups BT (mm)
–0.48 to –0.05 3.27 ± 0.022a –0.56 to –0.07 3.22 ± 0.022a
–0.04 to 0.02 3.30 ± 0.023a –0.06 to 0.04 3.33 ± 0.023b
0.03 to 0.09 3.31 ± 0.022ab 0.05 to 0.13 3.33 ± 0.023b
0.10 to 0.18 3.33 ± 0.022bc 0.14 to 0.22 3.36 ± 0.023b
0.19 to 1.30 3.37 ± 0.022c 0.23 to 0.71 3.33 ± 0.022b
BV-BT = breeding value predicted for lamb backfat thickness at 100 days of age (mm), BT = lamb backfat thickness at 100 days of age (values are Least Squares Means ± standard error)
[image:6.595.63.531.614.717.2]Czech J. Anim. Sci., 63, 2018 (8): 305–312 Original Paper
https://doi.org/10.17221/21/2018-CJAS
This was observed through both linear regressions and ANOVA evaluation. No influence or a negative influence of maternal BVs is explicable in terms of opposing relationships between maternal and direct effects (Splan et al. 2002). In terms of lamb producers and other sheep breeders, it is important to note that the selection of animals with higher genetic predisposition provides feedback in the form of higher lamb growth performance. The breeding program for the Suffolk sheep popula-tion in the Czech Republic reflects relapopula-tionships among parental BVs and the growth performance of their offspring. It is also important to note that genetic progress in the Suffolk population is higher than that achieved by growth performance traits. This was demonstrated by the distribution of BVs in particular groups and the values for growth performance traits in lambs in these groups.
Higher differences among groups of dam BVs in comparison to sire BVs should be associated with more intense selection pressure in sires. Sires have to be classified before subsequent breedings, such that they are pre-selected based on their growth ability, estimated BVs, and appearance. Therefore, overall, less than 50% of all rams are used in breeding. Dams are also classified, but are usually selected at the discretion of the breeder.
Therefore, groups of sire BVs are in general less variable than those of dam BVs. Furthermore, ewes are frequently selected for breeding in the flock they were bred. Conversely, rams are usu-ally sold to other flocks. The different breeding conditions across flocks could also influence the genetic potential of sires if a genotype × environ-ment interaction is manifested (Vostry et al. 2009). Generally, genetic inter-relatedness of flocks is low in the Czech Republic, which enables individual sires to be compared only within flocks. Conversely, testing the offspring in different flocks increases the accuracy of the estimations. In this situation, more measures to improve gene flow between flocks, such as creating reference flocks (Lewis and Simm 2000; Simm et al. 2001, 2002) or the spreading of artificial insemination (Paulenz et al. 2005, 2007), could effectively increase the selec-tion pressure in the sire populaselec-tion. Conversely, these steps can further decrease variability among sires. Larger variability in dam populations is im-portant in this connection, because it guarantees an essential space for the continuous selection of breeding animals in subsequent generations.
CONCLUSION
Results of the present study confirmed a posi-tive response of the selection scheme used in the Suffolk sheep population in the Czech Republic. Higher variability was detected within the dam population, which should ensure the adequate space for more precise selection of breeding ani-mals. A positive response was also obvious in sires; however, the differences among groups of particular BVs showed lower variability than in the dam population. Thus, more intensive selec-tion of the sire populaselec-tion should further increase the selection pressure. Creating sire reference flocks, using tested sires, or spreading artificial insemination were suggested as goals to improve the accuracy of the estimations.
Acknowledgement. We thank the Sheep and Goat Breeders Association of the Czech Republic for providing the data.
REFERENCES
Cawthorn D.M., Hoffman L.C. (2014): The role of tradi-tional and non-traditradi-tional meat animals in feeding a growing and evolving world. Animal Frontiers, 4, 6–12. Gholizadeh M., Ghafouri-Kesbi F. (2015): Estimation of
genetic parameters for growth-related traits and evaluat-ing the results of a 27-year selection program in Baluchi sheep. Small Ruminant Research, 130, 8–14.
Gizaw S., Lemma S., Komen H., Van Arendonk J.A.M. (2007): Estimates of genetic parameters and genetic trends for live weight and fleece traits in Menz sheep. Small Ruminant Research, 70, 145–153.
Hanford J.K., Van Vleck L.D., Snowder G.D. (2002): Esti-mates of genetic parameters and genetic change for re-production, weight, and wool characteristics of Columbia sheep. Journal of Animal Science, 80, 3086–3098. Hanford J.K., Van Vleck L.D., Snowder G.D. (2003):
Es-timates of genetic parameters and genetic change for reproduction, weight, and wool characteristics of Targhee sheep. Journal of Animal Science, 81, 630–640.
Hasiec M., Szlis M., Chmielewska N., Gorski K., Romano-wicz K., Misztal T. (2017): Effect of salsolinol on ACTH and cortisol response to handling stress in early anestrous sheep. Czech Journal of Animal Science, 62, 130–139. Lewis R.M., Simm G. (2000): Selection strategies in sire
Maxa J., Norberg E., Berg P., Milerski M. (2007): Genetic parameters for body weight, longissimus muscle depth and fat depth for Suffolk sheep in the Czech Republic. Small Ruminant Research, 72, 87–91.
Maximini L., Brown D.J., Baumung R., Fuerst-Waltl B. (2012): Genetic parameters of ultrasound and computer tomography scan traits in Austrian meat sheep. Livestock Science, 146, 168–174.
Milerski M., Margetin M., Maxa J. (2006): Factors affecting the longissimus dorsi muscle depth and backfat thickness measured by ultrasound technique in lambs. Archives Animal Breeding, 49, 282–288.
Mokhtari M.S., Rashidi A. (2010): Genetic trends estimation for body weights of Kermani sheep at different ages using multivariate animal models. Small Ruminant Research, 88, 23–26.
Molik E., Blasiak M., Misztal T., Romanowicz K., Zieba D.A. (2017): Profile of gonadotropic hormone secretion in sheep with disturbed rhythm of seasonality. Czech Journal of Animal Science, 62, 242–248.
Mortimer S.I., van der Werf J.H.J., Jacob R.H., Hopkins D.L., Pannier L., Pearce K.L., Gardner G.E., Warner R.D., Geesink G.H., Hocking Edwards J.E., Ponnampalam E.N., Ball A.J., Gilmour A.R., Pethick D.W. (2014): Genetic pa-rameters for meat quality traits of Australian lamb meat. Meat Science, 96, 1016–1024.
Paulenz H., Soderquist L., Adnoy T., Nordstoga A.B., An-dersen Berg K. (2005): Effect of vaginal and cervical depo-sition of semen on the fertility of sheep inseminated with frozen-thawed semen. Veterinary Record, 156, 372–375. Paulenz H., Adnoy T., Soderquist L. (2007): Comparison of
fertility results after vaginal insemination using different thawing procedures and packages for frozen ram semen. Acta Veterinaria Scandinavica, 49: 26.
Ptacek M., Duchacek J., Stadnik L., Hakl J., Fantova M. (2017a): Analysis of multivariate relations among birth weight, survivability traits, growth performance, and some important factors in Suffolk lambs. Archives Animal Breeding, 60, 43–50.
Ptacek M., Duchacek J., Stadnik L., Fantova M. (2017b): Effects of age and nutritional status at mating on the reproductive and productive traits in Suffolk sheep kept under permanent outdoor management system. Czech Journal of Animal Science, 62, 211–218.
Rasali D.P., Shrestha J.N.B., Crow G.H. (2006): Develop-ment of composite sheep breeds in the world: a review. Canadian Journal of Animal Science, 86, 1–24.
Santos B.F.S., McHugh N., Byrne T.J., Berry D.P., Amer P.R. (2015): Comparison of breeding objectives across coun-tries with application to sheep indexes in New Zealand
and Ireland. Journal of Animal Breeding and Genetics, 132, 144–154.
Schmidova J., Milerski M., Svitakova A., Vostry L., Novotna A. (2014): Estimation of genetic parameters for litter size in Charollais, Romney, Merinolandschaf, Romanov, Suf-folk, Šumava and Texel breeds of sheep. Small Ruminant Research, 119, 33–38.
Shaat I., Galal S., Mansour M. (2004): Genetic trends for lamb weights in flocks of Egyptian Rahmani and Ossimi sheep. Small Ruminant Research, 51, 23–28.
Shrestha J.N.B., Peters H.F., Heaney D.P., Van Vleck L.D. (1996): Genetic trends over 20 years of selection in the three synthetic Arcotts, Suffolk and Finnish Landrace sheep breeds. 1. Early growth traits. Canadian Journal of Animal Science, 76, 23–34.
Simm G., Lewis R.M., Collins J.E., Nieuwhof G.J. (2001): Use of sire referencing schemes to select for improved carcass composition in sheep. Journal of Animal Science, 79, 255–259.
Simm G., Lewis R.M., Grundy B., Dingwall W.S. (2002): Responses to selection for lean growth in sheep. Animal Science, 74, 39–50.
Splan R.K., Cundiff L.V., Dikeman M.E., Van Vleck L.D. (2002): Estimates of parameters between direct and ma-ternal genetic effects for weaning weight and direct ge-netic effects for carcass traits in crossbred cattle. Journal of Animal Science, 80, 3107–3111.
Svitakova A., Schmidova J., Pesek P., Novotna A. (2014): Recent developments in cattle, pig, sheep and horse breeding – a review. Acta Veterinaria Brno, 83, 327–340. Vostry L., Milerski M. (2013): Genetic and non-genetic
effects influencing lamb survivability in the Czech Re-public. Small Ruminant Research, 119, 33–38.
Vostry L., Pribyl J., Schlote W., Vesela Z., Jakubec V., Majzlik I., Mach K. (2009): Estimation of animal × environment interaction in Czech beef cattle. Archives Animal Breed-ing, 52, 15–22.
Wolfova M., Wolf J., Milerski M. (2009): Calculating eco-nomic values for growth and functional traits in non-dairy sheep. Journal of Animal Breeding and Genetics, 126, 480–491.
Wolfova M., Wolf J., Milerski M. (2011): Economic weights of production and functional traits for Merinolandschaf, Romney, Romanov and Sumavska sheep in the Czech Republic. Small Ruminant Research, 99, 25–33.