Robert M. Quencer 1
This article appears in the July / August 1982 issue of AJNR and the September 1982 issue of AJR.
Received November 5, 1981; accepted after revision January 18, 1982.
I Department of Radiology (R 130), University of Miami School of Medicine, Jackson Memorial Hospital, P.O. Box 016960, Miami, FL 33101.
AJNR 3:365-372, July / August 1982 0195-6108/82/0304-0365 $00.00 © American Roentgen Ray Society
Maturation of Normal
Primate White Matter:
Computed
Tomographic
Correlation
365
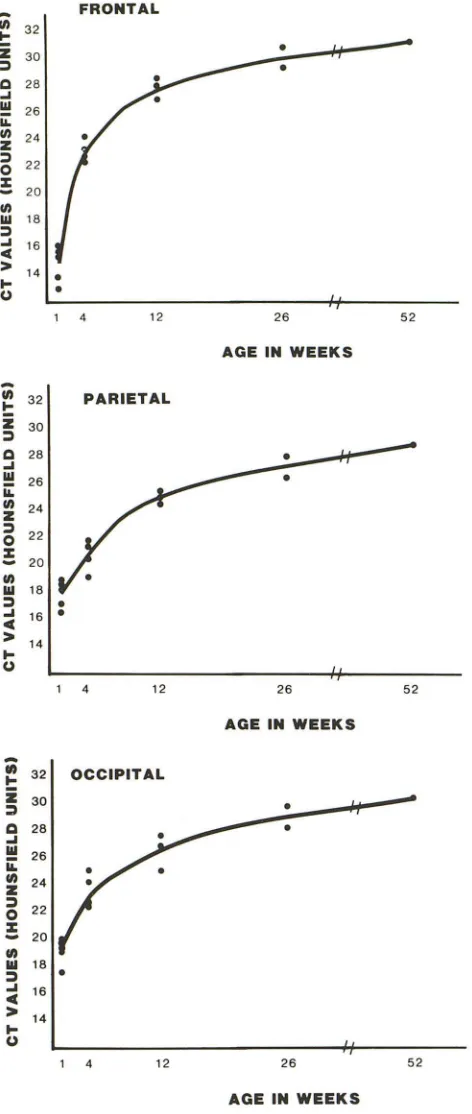
Five infant baboons were examined with computed tomography (CT) during the first year of their lives to determine the rate and degree of normal white matter maturation in frontal, occipital, and parietal areas. The increase in CT numbers with age was correlated with gross and histologic specimens. Two phases of maturation were identified: a rapid phase (first 8-12 weeks) and a gradual phase (after 12 weeks). Frontal white matter was the most immature in the immediate postnatal period but it became equal in attenuation to the other regions by 4 weeks of age. Knowledge of white matter maturation rates may be particularly useful in cases of neonatal hypoxial ischemia where zones of periventricular hypodensity are identified. The failure of such regions to follow a normal rate of maturation may indicate damage to the white matter and have significant prognostic implications.
Although the measurement of cerebral tissue attenuation by computed tomog-raphy (CT) has been the subject of a number of reports within the past few years [1-9], determining the significance of regions of low attenuation in the white matter of newborns has remained a difficult problem. In order to understand the CT appearance of neonatal white matter and to explain its change during the first year of life, knowledge of the rate and degree of white matter maturation during normal infancy is necessary. In this report, infant primates (baboon) underwent a comparative CT /anatomic study of the change in appearance of the frontal, parietal, and occipital white matter with age. Possibly, the accompanying matu-ration curves will be useful in evaluating immature white matter in human infants and distinguishing normal from leukoencephalopathic processes. Preliminary results of this work have already been reported [10].
Materials and Methods
The brains of five full-term normal baboons (Papio hamadryas) were scanned (GE CT IT
8800) and examined grossly and histologically to evaluate, at various time intervals up to 1 year of age, the change in appearance of the frontal, parietal, and occipital white matter. The baboon was chosen for this study because its brain was sufficiently large to allow proper separation of gray from white matter on CT and because the cerebral maturation of primates approximates that of a human infant. The animals were scanned at about 1,4,12, 26, and 52 weeks of age (table 1). Because of the clinical demands on the CT unit, Ihese animals could not all be scanned at exactly the same number of days after birth, but, for the purposes of this report, the time of scanning will be referred to as the intervals mentioned above.
Noncontrast CT was performed in the axial plane parallel to the orbitomeatal line with contiguous 5 mm thick sections through the entire brain. The animals were sedated with ketamine before scanning. The CT radiographic factors were 120 kVp, 200 mA, 2.2 msec pulse width, a 9.6 sec scan speed, and a 25 cm field size. A daily calibration check before scanning was performed to ensure the constancy and comparability of the attenuation coefficient measurements.
and the parietal centrum semiovale were identified on each scan. These regions were far enough away from the cortical gray matter and the bony calvarium to avoid including these structures with the white matter measurements. CT numbers, expressed as Hounsfield units (H), were obtained by placing a cursor of 0.2 cm2
(31 pixels) over each area on an image magnified 2.5 times normal. Ten region of interest samples (CT number ± standard deviation) were ob-tained in both the right and left cerebral hemispheres in the frontal, occipital, and parietal regions. No difference in measurements between the two hemispheres was noted. These multiple samples were necessary to minimize the small changes in attenuation coef-ficients that occur with small shifts in cursor position. The average of the 20 values was tabulated for each region and age (table 2). Variations of CT numbers within each age group are believed to represent biologic and age differences between individual baboons. For each of the three brain areas, a separate regression analysis was used as a statistical technique to determine the degree to which CT values varied as a function of age. In addition, the use of regression analysis afforded the possibility of deriving the "best" equation for the prediction of CT values from age. Within each regression analysis, the CT value served as the criterion variable,
while age served as the single predictor variable.
One baboon was sacrificed at each of the intervals, 1, 4, 12, 26, and 52 weeks of age, using 161 Euthansia solution. The brain was removed intact from the skull, weighed, fixed in formalin for 2
TABLE 1: Ages of Baboons When Scanned and Ages and Weight of Brain When Sacrificed
Ages (days) •
Weight at Baboon
Sacrifice (g)
At Scanning AI Sacrifice
A 7 7 76
B 11, 32 32 82
C 8,29,92 92 91
0 6, 27, 83, 181 181 104
E 10,32,87,185,367 367 125
• Ages al scanning and sacrifice correspond roughly to 1. 4, 12, 26, and 52 weeks, respectively.
TABLE 2: White Matter CT Values
Region: Age (weeks)
A B
weeks, cut in a series of 1-cm-thick sections parallel to the plane of the CT scan, and inspected for changes in the appearance of the white matter. Staining of tissue specimens from each of the regions with hematoxylin-eosin luxol fast blue allowed visualization of the myelin that was present. Mishandling of the 4-week-old brain caused loss of some frontal cerebral tissue. These gross and histologic specimens were compared with the CT sections and the CT values (table 2).
Results
In figure 1, graphs of the change in average CT values as
a function of age are presented for each area of the brain.
Similar maturation curves were found for the three areas.
Specifically, the white matter matured rapidly during the first
8-12 weeks of life and then more gradually thereafter.
Highly consistent results were also obtained from the three
regression analyses, namely, CT values associated with
each area were found to be logarithmic functions of age,
having the form: CT number = a
+
b (/og,oage), whereas a= the CT number at 1 week of age and b = the rate of
change of the CT numbers.
For each of the three white matter areas, the following
functions were derived: Frontal white matter-CT number
= 15.8
+
10.4 (/oglOage); occipital white matter-CT num-ber = 19.6+
6.7 (/oglOage); and parietal white matter-CT number = 18.4+
6.6 (/og,oage).Since these equations were calculated by regression
analyses and represent the best fit line to the data, the a
values are the predicted CT values at 1 week and, therefore,
are not expected to be exactly equal to the average
ob-served values. This explains why the a values from these
equations for the frontal, occipital, and parietal white matter
are 15.8, 19.6, and 18.4 and differ slightly from the
ob-served values of 15.0, 19.4, and 18.8, as shown in table 2 .
The regression analyses also allowed computation of the
CT Vatues (H) (±SD) of Baboon:
C o E Average
Frontal: 1 4 12
13.4 (2.0) 15.4 (2.0) 22.7 (2.5)
15.9 (2.0) 23.0 (2.6) 27.0 (2.0)
16.3 (2.7) 24.3 (2.1) 28.1 (2.4) 30.8 (2.0)
14.1 (2.0) 22.6 (2.4) 28.5 (2.2) 29.4 (2.0) 31.1 (2.0)
15.0 (2.2) 23.2 (2.4) 27.9 (22) 30.1 (2.0) 31.1 (2.0) 26
52 Occipital:
1 . . . . 4 12 26 52 Parietal: 1 4 12 26 52 19.4(2.1)
18.2 (2.5)
19.8 (2.9) 24.5 (1.7)
19.0 (1.8) 22.1 (1.8)
20.5 (2.7) 22.8 (2.0) 25.4 (1.7)
19.3 (1.9) 21.1 (2.3) 26.0 (2.0)
20.1 (2.9) 25.1 (2.0) 27.9 (2.0) 28.5 (1.8)
19.7 (1.9) 22.7 (2.1) 26.1 (2.1) 27.2 (1.8)
17.7(2.4) 22.5 (1.9) 27.2 (19) 30.1 (1.9) 30.6 (1.5)
17.5(2.1) 20.1 (2.0) 25.3 (2.1) 28.8 (1.8) 29.6 (1.7)
19.5 (2.6) 23.7 (1 .9) 26.8 (2.0) 29.3 (1 .9) 30.6 (1.5)
18.8 (2.0) 21.5 (2.1) 25.8 (2.1) 28.0 (1.8) 29.6 (1.7)
[image:2.612.54.298.386.463.2] [image:2.612.54.561.524.723.2]AJNR:3, July/August 1982 WHITE MATTER MATURATION 367
-
en
32 ~~ 30
C 28 ~
III 26 ii:
~ 24
5
22 :E:-
en
III 18 ~ ~ 16FRONTAL
•
•
=
14 •U L-. __________________________
~---
~ 32i
30~ C ~
!!!
ILen
Z ~o
:E:-
en
III 18~
.
~ 16 •
>
14...
U;;
... 32i
30:) C ~ III ii:
en
z
~o
:E:-
en
III 18 ~.
~ 16
>
14...
U
4 12 26 52
AGE IN WEEKS
PARIETAL
4 12 26 52
AGE IN WEEKS
OCCIPITAL
•
•
4 12 26 52
AGE IN WEEKS
Fig. 1.-Graphs of age versus white matter attenuation demonstrate a logarithmic relation between the two variables. Compressing the distance
between 26 and 52 weeks visually deemphasizes the nearly asymptotic relationship of the curve to the y axis after 12 weeks of age. Although there are some differences among the three curves, they can be roughly divided into two phases: rapid maturation (first 8-12 weeks) and gradual maturation (after 12 weeks). Equations expressing this plotted data are the Results.
rate of change in CT numbers (b value) and indicate that the
rate of change is 10.4, 6.7, and 6.6 in the frontal, occipital,
and parietal areas, respectively.
Each of the above functions was found to be highly
significant (p
< 0.0001). Moreover
, results of the regression analyses indicated that nearly all the variance in CT values is explained by the logarithmic transformation of age. Theproportions of explained variance in CT values for frontal,
occipital, and parietal white matter areas were 95.2%,
94.1 % and 94.4% respectively. A statistic that reflects the
degree of prediction accuracy associated with each function
is the standard error of estimate. For the purposes of this
study, the standard error of estimate indicates the standard
deviation of the actual CT values from those predicted.
Extremely low standard errors of estimate were found in the
regression analyses to be associated with the three derived
functions and, thereby, indicate relatively high degrees of
prediction accuracy. The standard errors of estimate for
frontal, occipital, and parietal white matter areas were 1.4,
0.97, and 1.4, respectively. These standard errors show
that the average error that would be committed in predicting
CT value from age using one of the above equations would
only be about 1 H. In addition, it is important to note that the
standard deviations of the obtained CT values were found
to be relatively uniform at each of the ages within the three brain areas.
These equations and the graphs indicate that in the
im-mediate postnatal period the frontal white matter has lower CT values than either the occipital or parietal white matter
and that the rate of increase of CT values of the frontal white
matter is more rapid than the white matter in either the
occipital or parietal regions. By 4 weeks of age, the CT
values in all three areas became nearly equal, and, after 12
weeks, the curves that relate CT values to age (fig. 1) reach
a virtually asymptotic relationship with the CT values. With increasing age, the skull thickens and the brain enlarges,
resulting in a beam-hardening effect. The result of this
phenomenon is that, in the older animals, the CT values are
lower than they would have been had the skull remained as
thin and the brain as small as it was in the newborn. Were
CT values of maturing white matter obtained without the
effect of beam-hardening, the points displayed for the older
animals in figure 1 would be greater than shown. Therefore,
although comparing absolute CT numbers of maturing
in-fants is a theoretical drawback, because increasing skull
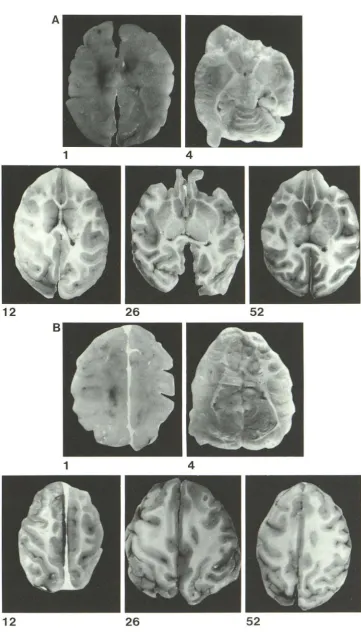
thickness is normal with aging, relative CT value compar i-sons can be made. With visual inspection only, the differ -ences in densities between the three regions at any given time period or change in density of a given region over a
span of time cannot be appreciated (fig. 2), which dictates
that CT numbers must be used when determining relative
changes over a period of time.
Both gross (fig. 3) histologic (fig. 4) specimens show a significant change in the appearance of the white matter over the first 3 months of life, but no visible change for the rest of the first year of life. The lack of a significant myelin stain and the absence of broad bands of white matter is
evident in the 1-week-old baboon. There is faint myelin
[image:3.612.61.297.89.646.2]4-week-A
1
12
26
B
1
12
26
4
52
4
52
Fig. 2.-Frontal and occipital (A) and parietal (8) areas at 1,4, 12,26, and 52 weeks, respectively. Window width is 150 and window level is +40 (scale =
-1,000 to + 1,000). Measurements in
preventricular white matter, forceps ma-jor, and pariental centrum semiovale are described in Materials and Methods. Even though visual differences are not readily apparent when 1-, 4-, and 1 2-week-old sections are compared, sig -nificant differences in CT numbers did
[image:4.613.54.406.82.736.2]AJNR:3, July/August 1982
Fig. 3.-Gross specimens. Frontal
and occipital (A) and parietal (B) white
matter at sacrifice: 1,4, 12, 26, and 52 weeks of age, respectively. There are no
well defined bands of white matter in the 1-week-old, but there is a definite
ap-pearance of white matter by 4 weeks.
Improper handling of the 4-week-old
specimen resulted in foss of some left
frontal cerebral tissue. White matter is broader and better defined by 12 weeks.
No striking changes were seen after that.
12
12
WHITE MATTER MATURATION
A
1
26
B
1
26
369
4
52
4
[image:5.614.191.552.94.726.2]Fig. 4.-Histologic specimens from occipital lobe are representative of
simultaneous changes in frontal and parietal regions at 1,4, 12, 26, and 52 weeks of age, respectively. Hand E luxol fast blue stains myelin blue. At 1
week of age, there is a lack of any significant myelin stain; at 4 weeks, there
old and this becomes even more noticeable in the
12-week-old. There is no significant change after that. This correlates well with the CT changes described above, that is, a rapid
change during the first 3 months and more gradual changes
thereafter. The fact that there is an increasing myelin stain
over the first 12 weeks is not due simply to water loss but to
more complicated changes.
Discussion
The change in photon attenuation of the newborn human
brain with age is a result of a complex series of chemical
alterations. The major changes include a decrease in water
content, which creates a 50% increase in the dry weight of
the brain during the first 6 months of life [6, 11] and an increase in both the lipid and protein content [1, 11].
Dobbing and Sands [11] used changes in whole brain
cholesterol levels to judge the degree of brain myelination.
T~ey found a doubling of the cholesterol levels in the first 6
months of life, then a continued steady increase to 2 years
of age, followed by a gradual leveling off of the cholesterol
levels thereafter. However, since cholesterol is not a
myelin-specific lipid, they recognized that this method of judging
progressive myelination is imprecise. At the time their work
was published in 1973, they believed no satisfactory
mor-phologic method existed for measuring the rate and degree
of myelination.
Since that time, various investigators have used CT to
characterize features of normal infant brain tissue.
Brant-Zawadski and Enzmann [1] and Schrump et al. [12] found
a decreasing difference between white and gray matter
photon attenuation with age. Serial measurements indicate
that while there is no significant variation in gray matter
attenuation because it is relatively mature at term, there is
an increase of white matter tissue attenuation with age [1] .
Both water loss and myelination within the white matter
contribute to this changing brain density.
Brooks et al. [13] explained that white matter appeared
more lucent than gray matter on the basis of differences in
their atomic structures. They showed that at typical CT
is faint staining (between arrows); and at 12 weeks, there are well defined
bands of myelin. There is no significant change in staining characteristics at 26-52 weeks.
energies, average gray-white differences of 5.5 H relate to
the lower water content (8% less oxygen) and the higher lipid content (8% more carbon) of white matter. This lower water content and higher lipid content means that oxygen, with its higher atomic number, is less abundant, and carbon, with its lower atomic number, is more abundant in the white matter than in the gray matter. The result is less photoelec-tric absorption and, hence, lower photon attenuation of the white matter. Differences in blood supply and actual varia-tion in tissue densities of these two areas were calculated to have made only minor contributions to their appearance on CT [13]. It is clear, therefore, that the CT changes of white matter during infancy is a result of more than simple myelination. They reflect overall maturation of the cerebral white matter.
Agreement exists that decreased brain tissue attenuation,
particularly in the periventricular regions, is a normal finding
in normal premature infants [2, 3, 14]. Even with these reports, there remains a number of unanswered questions: (1) what is the lowest CT number for white matter that can
be considered as normal; (2) at what rate does the CT
number of white matter change; (3) is the rate of change of the CT number of white matter constant or does it vary at
different ages; and (4) at what age does the CT number of
white matter reach an adult value? To answer these ques-tions, repetitive scanning of a group of normal human neo-nates and infants would be desirable but cannot be ethically justified. Therefore, despite the fact that at birth the non-human primate brain is more mature then the non-human brain [15], the baboon was chosen as an experimental subject to
determine the rate and degree of white matter maturation
In the 1-week-old baboons, consistently and significantly lower CT values were found in the frontal white matter than in the OCCipital and parietal white matter. This is seen not
only in table 2 but also in the regression equations (see
Results) of three regions. Note that the prediction of the CT value at 1 week for the frontal white matter is 15.8 (i.e., a
value), whereas it is 19.6 and 18.4 for the occipital and
parietal areas, respectively. These data correlate well with
atten-AJNR:3, July/August 1982 WHITE MATTER MATURATION 371
uation were found mainly in the frontal region in both normal premature and full-term human infants. In the baboon, this regional difference in CT numbers no longer exists at 1 month of age and thereafter. The discrepancy between these observations and the prior clinical work or premature human infants [3], which indicated that the frontal periven-tricular area remains low density for a long time, is not
surprising since the brain of a 4-week-old full-term normal baboon is more mature than that of a 4-week-old premature human. The fact that the CT numbers of frontal white matter
are low at 1 week but reach levels similar to that of the occipital and parietal white matter 3 weeks later is reflected
in the b values of the calculated regression equation (see Results). The b values for the frontal area is 10.4, whereas
it is 6.7 and 6.6 for the occipital and parietal regions, respectively.
These regression equations may be useful in predicting
the white matter CT values at different ages early in life. Inspection of figure 1 shows that, in all three regions, a
relatively rapid maturation phase exists during the first
8-12 weeks of life, followed by gradual maturation thereafter. This gradual maturation appears to correlate with the work of Penn et al. [6] and Brant-Zawadski and Enzmann [1 ], who found a continual change in whole brain CT measurements [6] and differences in gray-white attenuation [1] up to about
6 months of age in human. The small changes that figure 1 does show from 12 weeks onward may correspond to the fact that total myelination is not complete until the second
decade of life [1 6].
The gross anatomic (fig. 3) and histologic (fig. 4) speci-mens also show a similar pattern of white matter change
with time. In all three regions (fig. 3), barely discernible
bands of white matter in the 1-week-old give way to the broadening areas of white matter in the 4-and 12-week-old. After 12 weeks of age, no visual difference is seen in the gross specimens. Representative histologic specimens (fig.
4) reflect more vividly the white matter maturation by s how-ing part of that maturation process, namely its myelination. There is no significant myelin staining at 1 week of age, faint
staining at 4 weeks and increased staining at 12 weeks. No
change is seen after that. From a visual standpoint, these
increases in myelination parallel the white matter maturation
curves (fig. 1).
Clinically, these considerations are important when e val-uating the periventricular hypodensity in neonates who have
suffered hypoxic/ischemic brain damage [2-5, 9, 12, 17,
18]. A number of authors have tried to determine the signif-icance of these regions by correlation with the eventual clinical outcome [2,4, 12, 17]. Although moderate to severe periventricular leukomalacia in neonates commonly results
in abnormal motor and mental development [4, 12], reversal of similarly affected regions of white matter with a normal follow-up CT scan [18] and with a good clinical outcome has also been reported [17]. In addition, since mild forms of
decreased brain tissue attenuation are generally accepted
as normal [2, 3], it is apparent that in the spectrum of mild
to severe periventricular low density, a point is reached that
should be considered abnormal. In practice, this judgment
is reached by a qualitative rather than a quantitative
assess-ment and, therefore, is subject to a significant variation on
the basis of the observer's experience. Since it is the change in attenuation with time rather than the value of a single measurement that is important, the use of maturation curves like those presented here may be helpful. From a practical standpoint, if an area of hypodensity in the white matter is visualized and is suspected of being abnormal, accurate CT
numbers of that area could be compared with subsequent measurements of the same area some weeks later. The
failure of that area to show increasing CT numbers with time and to parallel normal maturation curves may indicate si g-nificant damage to the white matter.
ACKNOWLEDGMENTS
I thank Joseph Parker and James Ongley, Department of
Pathol-ogy, for help in the preparation and interpretation of the gross and
histologic specimens; Myron Goldberg, Department of Neurological Surgery, for help in the statistical analysis of the data; Donald
Hinkle, Manheimer Primatological Foundation, Homestead, Fla. for
help in obtaining and caring for the animals; Martin Trefler for
technical advice; and Humberto Palomares for help in obtaining the
scans.
REFERENCES
1. Brant-Zawadzki M, Enzmann DR. Using computed tomography
of the brain to correlate low white matter attenuation with early
gestational age in neonates. Radiology 1981; 139: 1 05-1 08
2. Floodmark 0, Fitz CR, Harwood-Nash DC. CT diagnosis and
short term prognosis of intracranial hemorrhage and hypoxic/
ischemic brain damage in neonates. J Comput 1980;4:
775-787
3. Picard L, Claudon M, Ronald J, et al. Cerebral computed
tomography in premature infants with an attempt at staging
development features. J Comput Assist Tomogr 1980;4:
435-444
4. Maginer AD, Wertheimer IS. Preliminary results of a computed tomography study of neonatal brain hypoxia-ischemia. J Com-put Assist Tomogr 1980;4: 457 -463
5. Ludwig B, Brand M, Brockerhoff PL. Postpartum CT exa
mina-tion of the head of full term infants. Neuradiology
1980;20: 145-154
6. Penn RD, Trenko B, Baldwin L. Brain maturation followed by
computed tomography. J Comput Assist Tomogr 1980;4: 6
14-616
7. Weinstein MA, Duchesneau PM, Macintyre WJ. White and gray
matter differentiated by computed tomography. Radiology
1977; 122: 699-702
8. Arimitsu T, DiChiro G, Brooks RA, Smith PB. White-gray matter differentiation in computed tomography. J Comput Assist Tom -ogr 1977; 1 : 437 -442
9. Barnes OM, Enzmann DR. The evolution of white matter
dis-ease as seen on computed tomography. Radiology
1981 ;138: 379-383
10. Quencer RM, Parker JC, Hinkle OK. Maturation of normal
primate cerebral tissue: preliminary results of a computed
tomographic-anatomic correlation. J Comput Assist Tomogr
1980;4: 464-465
11. Dobbing J, Sands J. Quantitative growth and development of human brain. Arch Dis Child 1973;48: 757 -767
12. Schrump JD, Sehring S, Killpack S, Brady JP, Hirata T,
find-ings in neonatal brain hypoxia and injury. J Comput Assist Tomogr 1980;4: 445-450
13. Brooks RA, DiChiro G, Keller MR. Explanation of cerebral white-gray contrast in computed tomography. J Comput Assist
Tomogr 1980;4: 489-491
14. Estrada M, EI Gammal T, Dyken PRo Periventricular low atte n-uations. A normal finding in computerized tomographic scans of neonates? Arch Neuro/1980;754: 756
15. Van Bogaert L, Inner JRM. Neurologic diseases of apes and
monkeys. In: Innes JRM, Saunders LZ, eds. Comparative
neu-ropathology. New York, Academic Press, 1962: 55-146
16. Moore RY. Intrauterine asphyxia and the developing fetal brain.
Chicago: Yearbook Medical, 197: 9-23
17. DiChiro G, Arimitsu T, Pellock JM, Lander RD. Periventricular leukomalacia related to neonatal anoxia: recognition by com-puted tomography. J Comput Assist Tomogr 1978; 2: 352-355
18. Hirabayashi S, Kitahara T, Hishida T. Computed tomography
in prenatal hypoxic and hypoglycemic encephalopathy with
emphasis on follow-up studies. J Comput Assist Tomogr