J. exp. Biol. (1980), 87, 317-228 2 1 7 With 6 figures
mrintcd in Great Britain
REPRIMING OF DELAYED POTASSIUM CONDUCTANCE
IN FROG SKELETAL MUSCLE
BY E. W. BALLOU*
Department of Physiology, Washington University School of Medicine, St Louis, Missouri 63110
(Received 14 November 1979)
SUMMARY
A dissection of the semitendinosus muscle from Rana pipiens was de-veloped for three-microelectrode voltage-clamp studies of the delayed potas-sium-selective conductance system. The delayed conductance inactivates in muscles bathed in high concentrations of potassium or rubidium, but can be reprimed by hyperpolarizing voltage pulses to membrane potentials beyond — 80 mV. The repriming time-course was studied by measuring the delayed conductance that could be activated following hyperpolarizing pulses of vary-ing duration. Responses followvary-ing 20-100 s pulses to potentials between
— 90 and — 140 mV could not be reconciled with an exponential approach to the conductance present in normally polarized fibres. The sigmoid appear-ance of the early (< 25 s) time course was exaggerated by cooling from 20 to 10 °C. This effect was described by a sequential model invoking two in-activated states with different temperature dependences. An explanation is suggested for differences in the kinetics and voltage dependence of repriming between briefly and chronically depolarized muscle cells.
INTRODUCTION
Hodgkin and Huxley (1952) proposed a mathematical scheme for describing the transient increase in sodium conductance responsible for nerve cell excitability. In their model, sodium conductance was proportional to the product of a rapidly develop-ing (activatdevelop-ing) third-order rate parameter and a more slowly declindevelop-ing (inactivatdevelop-ing) first-order rate parameter, each of which was a function only of the membrane potential and time. This type of scheme has been successfully used to describe transient con-ductances in many different membrane systems (Cole, 1968). However, in the last decade there have arisen several difficulties in interpreting inactivation phenomena using the Hodgkin-Huxley model, notably in experiments on the transient sodium conductance in Myxicola axons. The kinetics of inactivation (Armstrong, 1970; Goldman & Schauf, 1972; Schauf & Davis, 1975; Bezanilla & Armstrong, 1977) and of recovery from inactivation (repriming) (Schauf, 1974) are sigmoid rather than expo-nential, the time course of inactivation depends on the activating test-pulse (Goldman
& Schauf, 1972, 1973), the 'steady state' inactivation level varies with conditioning prepulses and also depends on the activating test-pulse potential (Goldman & Schaurj 1972), and inactivation takes place more rapidly than repriming at the same mem-brane potential (Schauf, 1976). These deviations from the inactivation scheme pro-posed by Hodgkin and Huxley have been interpreted in terms of coupling between activation and inactivation (Hoyt, 1968; Goldman, 1975). An alternative is to postulate a sequential kinetic model (Armstrong, 1969, 1971; Moore & Cox, 1976) in which inactivation is subsequent to activation (a form of coupling in that activation must precede inactivation). It has been suggested that biphasic kinetics observed in multi-pulse experiments might be explained by multiple inactivated states (Argibay & Hutter, 1973; Hille, 1976).
Relatively few studies of the inactivating delayed conductance of skeletal muscle have been reported. Heistracher and Hunt (1969) observed a sigmoid repriming time course in snake fibres maintained in Ringer containing 100 rnM-K. Adrian, Chandler & Hodgkin (1970) also observed a sigmoid repriming time course in frog fibres in high potassium, in contrast to the exponential repriming they found in briefly (< 10 s) de-polarized fibres in 2-5 mM potassium Ringer. In a series of multi-pulse experiments on frog skeletal muscle fibres, Argibay & Hutter (1973) apparently detected multiple inactivated states. In one such experiment a brief repriming pulse was ineffective in eliciting recovery from a chronically inactivated membrane; after a long repriming pulse followed by a depolarization sufficient for full inactivation of conductance, the same brief repriming pulse did elicit some recovery of delayed conductance.
The purpose of this paper is to report voltage-clamp experiments on the repriming of frog skeletal muscle fibres with a chronically inactivated delayed conductance. In these experiments the temperature was varied in order to provide more detailed kinetic information. A dissection that permits good visualization of fibre terminations for use with the three-electrode voltage-clamp technique, using American frogs, is also described.
METHODS
Electrical measurements
Adrian & Freygang (1962) first suggested measuring the potential difference be-tween two points near the termination of a cylindrical cell to obtain an approximation of membrane current density. Refinements by Adrian et al. (1970) and Schneider & Chandler (1976) have made the three-electrode voltage clamp a standard technique in muscle electrophysiology. To apply the technique a cell is impaled by voltage-recording electrodes at distances xx and x2 5 2.xx from the fibre terminus. A third microelectrode inserted at x3 > x2 receives the output of a feedback circuit designed to maintain Fx (the potential difference across the membrane at x±) at a chosen level.
The internal resistivity per unit length is estimated using linear cable theory: _ V1
Potassium conductance reprinting 219
(xt) — V(xi). Membrane current density per unit cell length is approximately given by
(Aimers, 1971).
Current density was referred to cell surface area by the conversion
where a is the cell radius; Gi was assumed to have a value of 2-56 mmho/cm at 2 °C with a Q10 of 1-3 (Hodgkin & Nakajima, 1972).
Voltage-recording electrodes filled with 3 M-KC1 had resistances of 6-15 MQ and tip potentials of less than 5 mV. Current passing electrodes filled with 2 M potassium citrate had resistances of 5-12 M£2. Electrodes were shielded just before mounting using colloidal silver paint (Valdiosera, Clausen & Eisenberg, 1974). After successful impalement of a fibre with three microelectrodes, the potential difference across the membrane at position xt was clamped to its initial value. Command pulses could then be imposed on Vlt with 90% completion within about 0-5 ms.
Control studies confirmed the findings of Adrian et al. (1970), and Stanfield(i97o), in showing that the 'instantaneous' conductance of the delayed rectifier is linear over the voltage range — 80 to + 20 mV. In a given experiment a fixed voltage step (typically from +10 to —40 mV) was used for all conductance measurements, and the instan-taneous change in current divided by the size of the voltage step was taken to be the membrane conductance. Conductance was routinely measured both before and after a hyperpolarizing pulse, and the difference (having leakage current subtracted) was recorded as the 'reprimed' conductance (GTe). Inactivation was allowed to redevelop for five minutes following each repriming protocol.
Preparation
Accurate measurement of distances from the electrodes to the end of the cell is difficult in the sartorius muscle of Rana pipiens, so a new preparation using the semi-tendinosus muscle was developed. The two heads of the semisemi-tendinosus muscle are attached to opposite faces of the sheet-like distal tendon. Cutting away some of the fibres on the ventral side of this tendon resulted in excellent visualization of the fibre ends on the dorsal side of the sheet. A loose tie around the remaining ventral head fibres permitted effective spreading of the muscle in a small chamber. The region of muscle to be impaled by microelectrodes was supported by a Lucite pedestal coated with petroleum jelly. The muscle was usually mounted at about 1-3 times slack length.
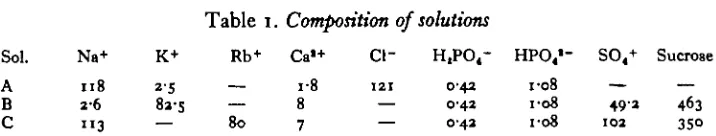
A B C 118 2-6 "3 i-8 8 7 121 0-42 0-42 0-42 1-08 1-08 1-08 — 492 102 — 463 350 Table 1. Composition of solutions
Sol. Na+ K+ Rb+ Ca'+ Cl" H,PO4- HP04«- S 04+ Sucrose
82-5 -— 80
Concentrations given in mM throughout. Tetrodotoxin was present in C and sometimes B at a con-centration of 1 fiM (32 fig/100 ml). Actual ionized calcium in chloride-free solutions is about 1 mM (Hodgkin & Horowicx, 1959).
Solutions
Extracellular bathing solutions are listed in Table 1. Muscles were dissected and mounted in normal Ringer, solution A (Adrian, 1956). Experimental solutions B and C had sulphate substituted for chloride to eliminate chloride conductance and 350 mM added sucrose to abolish movement. Solution B had the same ionic strength as A (Hodgkin & Horowicz, 1959). Rubidium-containing solution C was introduced at a later stage in the investigation to block currents through the' inward rectifier' (Adrian, 1964); sucrose was reduced and ionic strength increased to retard the deleterious effects of sucrose, and so that the results would be more directly comparable to recent experi-ments of Adrian & Rakowski (1978).
Data analysis
Oscilloscope traces were photographed by a Grass Camera on Recordak film (Kodak). Results were projected on graph paper and measurements made directly on the projected image or on tracings. Instantaneous currents were measured by deter-mining the current time course 5-15 ms after a voltage step and linearly extrapolating back to the end of the step, as the current was obscured by the capacity transient during the first few milliseconds.
Curve-fitting was carried out on a PDP n / 4 0 computer (Digital Equipment Corporation) using a random direction search method (Bremmerman, 1970).
RESULTS
Reprinting of delayed conductance
The delayed potassium conductance in skeletal muscle fibres is activated in normally polarized fibres by voltage-clamp steps to membrane potentials above — 40 mV, and conductance reaches a maximum at positive membrane potentials (Adrian et al. 1970). With prolonged depolarization the system inactivates, and recovery at a polarized potential (repriming) is necessary before conductance can again be activated by depolarization (Heistracher & Hunt, 1969; Adrian et al. 1970; Stanfield, 1970). In the present experiments, fibres placed in solutions containing 80 mM potassium or rubidium spontaneously depolarized to membrane potentials of — 30 to — 20 mV. In these fibres the delayed conductance system is chronically inactivated. Voltage-clamp steps to membrane potentials of — 140 to — 90 mV resulted in recovery of the delayed conductance.
Potassium conductance repriming 221
(a)
AK 50mv[
20 ms
(b)
50mv[
50mv[
[image:5.451.111.341.40.311.2]20 nu
Fig. 1. Conductance repriming. Membrane conductance was taken to be the ratio of current change to voltage change at the times indicated by the arrows. Test pulses to V, = +3-3 mV, post-pulses ioVp= — S4'S mV . 50 mV of A V corresponds to a membrane current density of 065 mA/cm1. (a) Conductance measurement without repriming. GC^R, = o) = 2-8 mmho/ cm1. (6) Conductance measurement after 4 s repriming at —108 mV. G(t^ = 4) = 250 mmho/cm1. GR, = 22-2 mmho /cm*. Holding potential Vk = —20 mV. Solution C, 20 °C. Fibre 27104: length constant A = 2'5 mm, r{ = 2-9 MO/cm. xl = 213 urn, x, = 470 fim,
*» = S'S /*m.
to + 4 mV, and very little ' tail' current is seen with a post-pulse to — 54 mV (Fig. 1 a). With an identical voltage sequence immediately following a 4 s repriming pulse to
— 108 mV, a large delayed current accompanies the test-pulse to + 4 mV, and a large tail current is seen with the post-pulse to — 54 mV (Fig. 1 b). Conductance was measured as the ratio of the 'instantaneous' current change to voltage change at the time of the step from the test-pulse voltage (Vt) to the post-pulse voltage (PJ,) (arrows). The difference in conductance before and after a hyperpolarizing pulse, the 'reprimed conductance', was 22-2 mmho/cm2.
Recovery following long repriming pulses
Repriming of conductance by 90 s pulses to — 109 mV, between 2-5 and 20 °C, is shown in Fig. 2. Conclusions based on these data are limited since they reflect tem-perature effects on both the maximum conductance 0K and the recovery rate. How-ever, the absence of an abrupt drop in this range rules out a phase change effect such as has been reported in end-plate tissue culture (Lass & Fischbach, 1976), and suggests a reasonably smooth temperature dependence of both the maximum conductance and the recovery rate.
A repriming time course for relatively long pulses is shown in Fig. 3. Most of the Milses delivered to this fibre were to —95 mV; at this potential, an exponential fit
60
5-0
jl 4-0 o
I 30
20
10
0
_L
5 10
7" (°C
15 20
Fig. 2. Repriming temperature dependence with long pulses. Ordinate is reprimed conductance, the difference between conductance measured with and without a hyperpolarizing pulse. Re-priming duration ta, = go s ( # ) , 6o s (A), reRe-priming potential KR, = — 109 mV. Vh = —22 mV, V, = +10 mV, Vr — — 45 mV. Solution C. Fibre 03091: A = i-o mm, r, = 5-6 MO/cm, a,! = 36 /im, A:, = 258 ^m, * , = 470 (tm, x, =• 549 /tm. Line drawn by eye. Value of leakage conductance subtracted before plotting ranged from 0-77 to 1-43 mmho/cm1 except for the points at 2 8 and 50 where it was 3-73 and 5-46 mmho/cm.1
2-0
1-5
1 0
0-5
0 L
20 40 60 80 100
25
20
15
10
Potassium conductance repriming
223 [image:7.451.88.344.50.213.2]'Ro (5)
Fig. 4. Repriming time course at 20 °C. Ordinate is reprimed conductance, the difference be-tween conductance measured with and without a repriming pulse having duration indicated on the abscissa. Abscissa is time reprimed at —108 mV. Same fibre as in Fig. 1. Line is the least-squares fit to equation 3. Model parameters for the fit: G = 24-1 mmho/cm1, a
t = 1-62 s"1, ft, = 080 s"1. Leakage conductance ranged from 070 to 3-1 mmho/cm1.
3 0 2-5 20 1-5 10 0-5 0
10 'Re(s)
15 20
Fig. 5. Sigmoid time course at 10 °C. VR. - —107 mV, V^= - 2 7 mV, V, = + n m V , I', = -35mV. Solution B. Fibre 15043^ = n i r a m , r , = 87Mf!/cm, an = 34/<m, .v, = 224
cm
J ^ l l l T . L J U I U I I U I I U , l l ^ l V 1 ^ W ^ ^ J . ' i — i 1 1 n u l l , ( j \J / m * * / * - ! ! ! , lV l J " t / * * ' t "^1 * —T i, .^t = 4 7 0 / ' m , .v, = 526 /<m. M o d e l p a r a m e t e r s for t h e fit t o e q u a t i o n 3 : ( 7 = 3 9 3 m m h o / ' , 0 4 = O I 2 8 8 -1, ; ? , - 0-128 s ~ ' . L e a k a g e c o n d u c t a n c e r a n g e d from 0 0 7 t o 1 0 3 m m h o / c m ' .
resulted in a time constant of 75 seconds and an assymptote of i-6 mmho/cm2. Two measurements at more negative potentials indicate that this was not a true steady state value, however, and suggest the presence of a component requiring many minutes to develop at —95 mV (Adrian & Rakowski, 1978). Other experiments using 20-100 s pulses to membrane potentials between —90 and — 140 mV confirmed the multi-state character of repriming at long times, and demonstrated the difficulty of taking recovery to completion within a reasonable time.
Early repriming time course
Experiments at 20 °C were performed with a fixed repriming potential while varying Use duration (tno). Figure 4 illustrates the time course of repriming at — 108 mV.
[image:7.451.82.350.280.442.2]7-0
6-0
5-0
4-0
£ 3 - 0
20
10
0 5 10 15 20 25
'R.(S)
Fig. 6. Time courses at 9-2° (O), ii'9° (D), 145° (A), and 9-1° ( # ) . VR. = - 1 0 7 mV,
Vj, = — 27 mV, V, = o mV, Vr = —46 mV. Solution B. Fibre 27031: A = I-OI mm, r( =
6 4 MO/cm, a,i = 39 fwn. xt = 246 /tm, *f = 5°4 /rn, *t = 549 /«n. Lines are the
least-squares fit to equation 3, with temperature coefficients referred to 9 20 included as adjustable parameters. Model parameters for the fit: & = 4-32 mmho/cm1, Qo = 2-45, a, = 0523 s"1,
Qa = 14-4, /},
D
0055 s"1, Qp «= 4'og. Leakage conductance ranged from 0-51 to 1-64 mmho/cm*.
The least-squares fit of the data in Fig. 4 to a rising exponential (not shown) resulted in a time constant of 3-9 s. Data from another cell studied at — 117 mV was fitted by a rising exponential with a 3-1 s time constant. Both fits deviated from the data at short times, however, since conductance appeared following an initial delay.
Cooling to 10 °C considerably slowed the early recovery from inactivation. The cell illustrated in Fig. 5 required hyperpolarizing pulses of several seconds in length to begin to elicit repriming, compared with the delay of o-i s seen in Fig. 4. Data from another cell studied at three different temperatures are shown in Fig. 6. With cooling from 14-5 to 0/2 °C the initial delay appeared to become more pronounced.
DISCUSSION
Use of American frogs for the ^-electrode clamp
The three microelectrode voltage-clamp has emerged as a convenient and reliable technique for measuring membrane current density at a site of controlled membrane potential in preparations where space clamping is not feasible. Previous work using this method has mainly utilized the pelvic end of the sartorius muscle from the English frog, Rana temporaria, since pelvic terminations of sartorius muscle cells from Rana pipiens are poorly visualized (Schneider & Chandler, 1976). However, terminations of
Potassium conductance reprinting 225
Wleasurement of reprinted conductance
Although the instantaneous conductance is linear in this preparation, several difficulties interfere with simple application of Ohm's law to determine membrane conductance from total current. Problems include current-dependent changes in concentration of permeant ions in the transverse tubules, the unreliability of absolute potential measurements using microelectrodes, and the uncertainty of the zero current level in the presence of gradually developing electrode leaks. The technique described in the Methods depends only on changes in current (A V) simultaneous with a fixed voltage step. Uncertainties due to changes in ionic driving forces are eliminated since the method does not require determination of the channel reversal potential. Electrodes were chosen for small tip potentials to minimize errors in potential measurements.
The method of data analysis was chosen to minimize errors due to leakage current at the electrode impalement sites. The scaling factor (= ijirar^ (x^ — x-^y) to convert
&V/V-L to conductance per unit surface area was determined by using small pulses at the beginning of each experiment. Since only this scaling factor is affected by leaks at x2 and x3, changing leakage at these sites will not affect measured conductances. Leakage at xlt which does result in & V errors, was corrected for in the procedure used to calculate reprimed conductance by subtracting leakage conductance (with no repriming) from the total conductance following the hyperpolarization protocol, to obtain reprimed conductance (GUe). This correction assumes that leakage at x1 is unchanged during the repriming protocol.
Effects of temperature on repriming
The present data do not reveal the full time course of repriming kinetics (Fig. 3). Reduced survival time of fibre subjected to strenuous repriming protocols made complete determinations impossible. Lacking steady-state measurements of reprimed conductance, data cannot be normalized and quantification of early sigmoidicity can only be regarded as tentative. However, some useful inferences can still be drawn from observations of recovery from inactivation made at short and intermediate times (< 25 s).
The existence of a sigmoid response (having an initially increasing slope, followed by a decreasing slope) is incompatible with the single-state model of inactivation (see also Argibay & Hutter, 1973). If all the inactivation processes had identical temperature dependences, temperature changes would have the same effect as scaling the axes, with no change in the shape of the time-course curves. However, inspection of the data taken at different temperatures suggested that scaling would not result in superposition. A simple two-state model for recovery from inactivation was solved in order to quantitatively describe the sigmoid character of early recovery. 72 is the
chronic inactivated state, / is the intermediate inactivated state, and R is the reprimed condition:
«a fit
the following relationships among the rate constants are assumed: at — 20 mMi Oj > Oj,, fix >/?2 and a^fi^, and at — 110 mV, /?2 > A, ^ ^ au an<^ "^ is of the same order1
of magnitude as /?2. A cell in depolarizing solution will have a fully populated state /2.
Voltage-clamp hyperpolarization to —no mV will elicit recovery after the initial delay required to repopulate state /. With a step in hyperpolarization, the solution for the recovery time-course is
The curves shown in Figs. 4 and 5 were obtained by adjusting the parameters (?,Oj, and /?2 to minimize the sum of the squared deviations of the data from the calculated
curves.
The sigmoid character of equation 3 is monotonically related to the ratio of the smaller to the larger rate constant, with the largest delay for /^/aj = 1. This is the case in Fig. 5 (10 °C), where the data would be better fit by a model allowing even more sigmoidicity. In Fig. 4 (20 °C) a good fit was obtained for fija^ = 0-49. The fit to another time-course at 20° resulted in PJa^ = 0-059. These observations quanti-tatively support the suggestion that sigmoid time courses are more pronounced at lower temperatures.
Fits to repriming time courses at several temperatures (Fig. 6) were calculated by including temperature coefficients for $, a2, and /?2 as adjustable parameters.
Para-meter values resulting from these fits are of limited use since there were only about twenty data points and six adjustable parameters. Nevertheless, in Fig. 6, the ratio /Jg/ojj ranged from 0-054 a t I4'5° t 0 °'I 05 a t 9"2°> corroborating the trend seen in experiments on separate fibres studied at different temperatures.
The results of this curve-fitting exercise show that for the limited data available, the sigmoid descriptions did exhibit increasing delays as the temperature was lowered. Delays were determined by comparing the ratios of two rate constants, a method that is independent of axis-scaling. It is therefore concluded that the repriming mechanism consists of at least two rate processes with different temperature dependences.
Relation to previous results
The present finding of a sigmoid repriming time course is consistent with the results of Adrian et al. (1970), Heistracher and Hunt (1969), and Argibay & Hutter (1973). Adrian and Rakowski (1978) observed an exponential repriming time course under similar conditions; however, their experiments were more concerned with steady-state recovery and the early time-course was not investigated in detail. Although the latter authors described repriming as a single-state exponential process, they also observed fibres that did not achieve a steady level of recovery after several minutes. Their interpretation in terms of a separate very slowly repriming conductance is supported by the present results (Fig. 3).
Potassium conductance reprinting 227
Bflls reported by Adrian et al. (1970) and Heistracher and Hunt (1969) are also
predicted.
I would like to thank Dr R. F. Rakowski for suggestions and advice, Dr W. F. Pickard and the Biomedical Engineering Program for flexibility and support, and Dr C. B. Ballou for continued encouragement. This work constituted partial ful-fillment of the requirements of the Doctor of Science degree in Electrical Engineering at Washington University, and was supported by P.H.S. grant number 5-T01-GM01827 to the Biomedical Engineering Program.
REFERENCES
ADRIAN, R. H. (1956). The effect of internal and external potassium concentration on the membrane potential of frog muscle. J. Pkytiol., Lond. 133, 631-658.
ADRIAN, R. H. (1964). The rubidium and potassium permeability of frog muscle membrane. J. Pkytiol.,
Lond. 175, 134-159.
ADRIAN, R. H. & FREYGANC, W. H. (1962). The potassium and chloride conductance of frog muscle membrane. J. Physiol., Lond. 163, 61-103.
ADRIAN, R. H., CHANDLER, W. K. & HODGKIN, A. L. (1970). Voltage clamp experiments in striated muscle fibers. J. Physiol., Lond. 208, 607-644.
ADRIAN, R. H. & RAKOWSKI, R. F. (1978). Reactivation of membrane charge movement and delayed potassium conductance in skeletal muscle fibers. J. Physiol., Lond. 278, 533-557.
ALMERS, W. (1971). The potassium permeability of frog muscle membrane. Doctoral Dissertation, University of Rochester, Rochester, New York.
ALMERS, W. (1976). Differential effects of tetracaine on delayed potassium channels and displacement currents in frog skeletal muscle. J. Physiol. Lond. 26a, 613—637.
ARCIBAY, J. A. & HUTTER, O. F. (1973). Voltage-clamp experiments on the inactivation of the delayed potassium current in skeletal muscle fibers. J. Physiol., Lond. 232, 41P-43P.
ARMSTRONG, C. M. (1969). Inactivation of the potassium conductance and related phenomena caused by quaternary ammonium ion injection in squid axons. J. gen. Physiol. 54, 553-575.
ARMSTRONG, C. M. (1970). Comparison of gK inactivation caused by quarternary ammonium ions with £N, inactivation. Biophys.J. io, 185a.
ARMSTRONG, C. M. (1971)- Interaction of tetraethylammonium ion derivatives with the potassium channels of giant axons. J. gen. Physiol. 58, 413-437.
BEZANILLA, F. & ARMSTRONG, C. M., (1977). Inactivation of the sodium channel. I. sodium current experiments. J. gen. Physiol. 70, 540-566.
BREMMERMAN, H. (1970). A method of unconstrained global optimization. Math. Biosdences 9, 1—15. COLE, K. S. (1968). Membranes, Ions and Impulses. Los Angeles: University of California Press. GOLDMAN, L. (1975). Quantitative description of the sodium conductance of Myxicola in terms of a
generalized second-order variable. Biophys.J. 15, 119-136.
GOLDMAN, L. & SCHAUF, C. L. (1972). Inactivation of the sodium current in Myxicola giant axons. Evidence for coupling to the activation process. J. Gen. Physiol. 59, 650-675.
GOLDMAN, L. & SCHAUF, C. I- (1973). Quantitative description of sodium and potassium currents and computed action potentials in Myxicola giant axons. J. gen. Physiol. 6i, 361-384.
HEISTRACHER, P. & HUNT, C. C. (1969). Contractile repriming in snake twitch muscle fibers. J. Physiol.,
Lond. 201, 613-626.
HILLE, B. (1976). Gating in sodium channels of nerve. Ann. Rev. Physiol. 38, 130—152.
HODGKIN, A. L. & HOROWICZ, P. (1959). The influence of potassium and chloride ions on the membrane potential of single muscle fibres. J. Physiol. Lond. 148, 127—160.
HODGKIN, A. L. & HUXLEY, A. F. (1952). A quantitative description of membrane current and its appli-cation to conduction and excitation in nerve. J. Physiol., Lond. 117, 500-544.
HODGKIN, A. L. & NAKAJIMA, S. (1972). The effect of diameter on the electrical constants of frog skeletal muscle fibres. J. Physiol., Lond. 221, 105-120.
HOYT, R. C. (1968). Sodium inactivation in nerve fibers. Biophys.J. 8, 1074-1097.
LASS, Y. & FISCHBACH, G. (1976). A discontinuous relationship between the acetylcholine-activated concuctunce and temperature. Nature, Lond. 263, 150—151.
MOORE, J. W. & Cox, E. B. (1976). A kinetic model for the sodium conductance system in squid axon.
SCHAUF, C. L. (1974). Sodium currents in Myxicola axons: nonexponential recovery from the inacti\« state. Biophys. jf. 14, 151-154.
SCHAUF, C. L. (1976). Comparison of two-pulse sodium inactivation with reactivation in Myxicola giant axons. Biophys. J. 16, 345-348.
SCHAUF, C. L. & DAVIS, F. A. (1975). Further studies of activation-inactivation coupling in Myxicola axons: insensitivity to changes in calcium concentration. Biophys. J. 15, 1111-1116.
SCHNEIDER, M. F. & CHANDLER, W. K. (1976). Effects of membrane potential on the capacitance of skeletal muscle fibers. J. gen. Physiol. 67, 125-163.
STANFIELD, P. R. (1970). The effect of the tetraethylammonium ion on the delayed currents of frog skeletal muscle. J. Physiol., Lond. 309, 209-229.