Lack of Sex Effect on Brain Activity during a
Visuomotor Response Task: Functional
MR Imaging Study
Nina Mikhelashvili-Browner, David M. Yousem, Colin Wu, Michael A. Kraut, Christina L. Vaughan, Kader Karli Oguz, and Vince D. Calhoun
BACKGROUND AND PURPOSE:As more individuals are enrolled in clinical functional MR imaging (fMRI) studies, an understanding of how sex may influence fMRI-measured brain activation is critical.
METHODS:We used fixed- and random-effects models to study the influence of sex on fMRI patterns of brain activation during a simple visuomotor reaction time task in the group of 26 age-matched men and women. We evaluated the right visual, left visual, left primary motor, left supplementary motor, and left anterior cingulate areas.
RESULTS: Volumes of activations did not significantly differ between the groups in any defined regions. Analysis of variance failed to show any significant correlations between sex and volumes of brain activation in any location studied. Mean percentage signal-intensity changes for all locations were similar between men and women. A two-wayttest of brain activation in men and women, performed as a part of random-effects modeling, showed no significant difference at any site.
CONCLUSION: Our results suggest that sex seems to have little influence on fMRI brain activation when we compared performance on the simple reaction-time task. The need to control for sex effects is not critical in the analysis of this task with fMRI.
Functional MR imaging (fMRI) has proved to be a useful tool for the noninvasive investigation of sen-sory, motor, and cognitive processing in the human brain. As more individuals are enrolled in clinical fMRI studies, understanding how sex may influence the brain activation pattern as measured with fMRI is critical. Although findings are not consistent, in women, regional cerebral glucose metabolism and regional and global cerebral blood flow are higher than those of men at rest and during stimulation, as shown in many positron emission tomographic studies (1–4).
We studied a visuomotor response-time task in a
group of age-matched men and women to determine the influence of sex on fMRI pattern of brain activa-tion. The visuomotor response task is an example of a simple reaction-time task (SRT). It is generally ac-cepted that total reaction time (RT) can be parti-tioned into two components: perceptual latency, de-fined as the time between the stimulus onset to the moment of stimulus detection, and motor time (MT), defined as the time needed for the activation of the specified muscle groups (5). During SRT tasks, subjects are asked to perform a given movement, eg, press or release a button, in a response to a presented stimulus. The stimulus is called the imperative stimulus. It is generally accepted that an SRT task involves little if any cognitive processing. In a choice RT task, the response is selected from two or more alternatives; each imperative stimulus is associated with a different response. Discriminative-disjunctive RT tasks (also known as go–no-go tasks) are used to assess volitional inhibition of the prepared actions. These are the tasks with the most prominent central component or deci-sion-making process.
The results of the behavioral studies, designed to identify sex-related differences in human motor per-formance while focusing on RT, are not consistent. Some studies demonstrated that in a setting of SRT with an age-matched population, sex has no
signifi-Received July 15, 2002; accepted after revision September 18. From the 1Johns Hopkins Hospital, the Russell H. Morgan
Department of Radiology and Radiological Sciences, Division of Neuroradiology (N.M.-B., D.Y.M., M.K., K.K.O.) and the Division of Psychiatric Neuro-Imaging (C.L.V., V.D.C.), Baltimore, MD; the Office of Biostatistics Research, DECA, National Heart, Lung and Blood Institute (C.W.), Bethesda, MD; and the Department of Radiology, Hacettepe University, School of Medicine, Turkey (K.K.O.).
Address reprint requests to David M. Yousem, the Johns Hop-kins Hospital, The Russell H. Morgan Department of Radiology and Radiological Sciences, Division of Neuroradiology, 600 N. Wolfe Street/Phipps B-112, Baltimore, MD 21205.
©American Society of Neuroradiology
cant influence on RT, whereas others suggest that sex-related differences in RT exist (6–12).
Even if men and women perform identically on behavioral tasks, whether this translates to similar volumes and locations of cortical regions activated during analogous fMRI experiments remains to be seen. In one study using olfactory-stimulated fMRI, women and men scored identically in smell identifi-cation, but the volume of “olfactory eloquent” regions were activated in women was more than eight times that activated in men (13, 14). Thus, in an olfactory-stimulated fMRI study, the activation pattern reflects differences between the sexes, at least when the vol-ume of activated tissue is used as a metric.
By the same token, the link between performance and fMRI activation is a subject of conflicting reports, and in many cases, sex plays a dominant role (15, 16). Results of an fMRI study, performed with the same protocol described in this report, supports the obser-vation that the RT within the imaging unit is not directly correlated with the RT outside the unit (17). The authors stated that, when one aims to determine the correlation between subjects’ performance in RT tasks and the volume or amplitude of the brain acti-vation in visuomotor areas, the RT values obtained during the fMRI experiment should be used, not the behavioral SRT data.
We sought evidence of sex-based differences in patterns of brain activation measured during fMRI by using a visuomotor SRT task. By eliminating the cog-nitive component to this task (eg, we did not use a discriminative-disjunctive RT task or a choice RT task), we hypothesized that any differences in fMRI activation would be due to a sex effect alone and not cognitive processing variations known to be present between men and women (18).
Methods
Subjects and Visuomotor RT Task
All subjects were recruited from normal volunteer registries from the Parkinson‘s Disease Research Center (Baltimore, MD), from a neuroradiology patient database, or by using advertisements in the print media. Twenty-six healthy subjects underwent event-related visuomotor fMRI during which their RTs were measured. All subjects provided written informed consent approved by our hospital’s institutional review board. All participants were right-handed, and no volunteers were taking medications. Neuropsychological tests were performed before each individual underwent fMRI, and all the subjects had intelligence quotients within the normal range; none had evidence of depression. All patients also underwent a screening T2-weighted imaging (TR/TE, 4000/102) to assess for masses as well as the presence and degree of white matter lesions. Only subjects with unremarkable anatomic MR imaging results were included in the analysis.
The participants of this study were matched by age to eval-uate the effects of sex on brain activation during the visuomo-tor fMRI experiment. Each group comprised 13 subjects. The mean age of the male group was 51.15 years ⫾ 21.34 (SD) (range, 26–80 years), and the mean age of the female group was 50.41⫾21.55 (range, 25–85 years).
Activation Task
The single event paradigm described here was written in the E-prime (Psychology Software Tools, Inc., Pittsburgh, PA) pro-gramming environment.
During the imaging session, a white fixation cross was con-stantly presented in the center of a black background. The single event paradigm design consisted of a round, multicol-ored visual cue appearing on the screen for 0.5 seconds at either 20-second or 30-second intervals randomly throughout the 6-minute acquisition. The subjects were asked to tap a finger-press button box with the second finger of their right hand as soon as they saw the visual cue. RTs during event-related paradigms were measured from the button box and registered at the computer connected to the imaging unit.
fMRI and Data Processing
fMRI was performed by using a 1.5-T unit (Gyroscan ACS-NT, Powertrak 6000; Philips Medical Systems, Best, the Neth-erlands) equipped with 2.3-G/cm gradients and echo-planar imaging. A standard head coil with foam padding to limit head motion was used. The fMRI protocol involved a gradient-echo blood oxygenation level–dependent technique with a TR/TE of 1000/39, a 90° flip angle, a 24-cm FOV, and 360 time points in a 6-minute acquisition. Sections were acquired with a 5-mm thickness and an intersection gap of 1 mm by using a matrix of 128 ⫻ 128. A TE of 39 ms offers insufficient time to fully sample the 128⫻128 k-space data matrix. Partial acquisition of the k-space data is 60%. Twelve sections angled parallel to the intercomissural line and including both the primary visual and sensorimotor cortices were obtained.
Functional data processing was performed on Ultra work-stations (Sun Microsystems, Palo Alto, CA) by using the sta-tistical parametric mapping program SPM99 (Wellcome De-partment of Cognitive Neurology, London, UK) implemented in Matlab (Mathworks, Sherbon, MA). For each subject, we performed the following: realignment for motion correction, normalization/deformation to a standard stereotaxic coordi-nate (Montreal Neurologic Institute locations converted to Talairach and Tournoux), smoothing at 5-mm3voxels, and data analysis by using a noncorrected threshold at aP⬍.001. These were accomplished by using SPM99 (Table 1). On the basis of the smoothing algorithm in SPM99, 5⫻5⫻5-mm isotropic voxels were evaluated for significant activation. Because the section thickness was 5 mm, and the matrix size was 128⫻128 in a 24-cm FOV, this smoothing had a negligible detrimental effect on overall resolution. Group maps were generated by using the smoothed normalized data sets with a corrected height threshold atP⬍.05 (Table 2). Random-effects model-ing was performed with an uncorrected threshold at P ⬍ .001(Table 3).
sen-sorimotor, or supplemental motor areas, as defined by the Brodmann maps and Talairach Daemon gyri nomenclature.
Statistical Analysis
Mean RT values of both groups obtained during imaging were compared by means of two-samplettest. The volumes of activation (kvalue) of both groups were compared by using a Welch modified two-sample ttest for each location studied. The main effect of sex on RT and the volume of the fMRI activation for each of the regions studied were assessed by performing an analysis of variance (ANOVA).
Results
Because subjects were matched by age, no signifi-cant difference in age was observed between the male group and the female group (pairedttest,Pⱖ.9).
The subjects’ performance during the fMRI
para-digm is presented in Table 1. There were no signifi-cant differences in RTs between men (mean RT, 415.1 ms⫾90.48) and women (mean RT⫽423.3⫾ 76.67) groups (paired t test, P ⱖ .77). We did not detect any significant correlation between sex and the subjects’ RT when we performed linear regression analysis (Pⱖ .75).
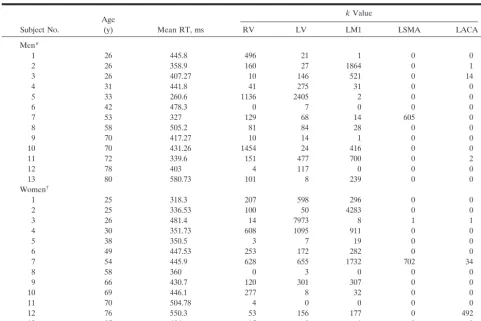
[image:3.603.54.535.69.390.2]The age, RT, and number of voxels activated for each region on individual maps during the event-related paradigm (SPM99,P⬍.001) are presented in Table 1. All subjects in both groups except for two men and three women had suprathreshold activation in both visual and LM1 areas on individual maps with uncorrectedP ⬍.001 (Table 1, Figs 1–4). One man and one woman did not have any activation in LM1 and RV areas; they also did not have any activation in the LSMA and LACA. The LV activation in these
TABLE 1: Age, RT, and number of voxels for each site activated on individual maps during the event-related paradigm
Subject No.
Age
(y) Mean RT, ms
kValue
RV LV LM1 LSMA LACA
Men*
1 26 445.8 496 21 1 0 0
2 26 358.9 160 27 1864 0 1
3 26 407.27 10 146 521 0 14
4 31 441.8 41 275 31 0 0
5 33 260.6 1136 2405 2 0 0
6 42 478.3 0 7 0 0 0
7 53 327 129 68 14 605 0
8 58 505.2 81 84 28 0 0
9 70 417.27 10 14 1 0 0
10 70 431.26 1454 24 416 0 0
11 72 339.6 151 477 700 0 2
12 78 403 4 117 0 0 0
13 80 580.73 101 8 239 0 0
Women†
1 25 318.3 207 598 296 0 0
2 25 336.53 100 50 4283 0 0
3 26 481.4 14 7973 8 1 1
4 30 351.73 608 1095 911 0 0
5 38 350.5 3 7 19 0 0
6 49 447.53 253 172 282 0 0
7 54 445.9 628 655 1732 702 34
8 58 360 0 3 0 0 0
9 66 430.7 120 301 307 0 0
10 69 446.1 277 8 32 0 0
11 70 504.78 4 0 0 0 0
12 76 550.3 53 156 177 0 492
13 85 486 15 0 1 0 0
Note.—SPM99 was used. UncorrectedP⬍.001. LACA indicates the left anterior cingulate area; LM1, left primary somatomotor area; LSMA, left supplemental motor area; LV, left visual area; and RV, right visual area.
* Age, 51.15 years⫾21.34. RT, 415.1 ms⫾90.48.
[image:3.603.55.536.457.517.2]†Age, 50.4 years⫾21.55 RT, 423.3 ms⫾76.67.
TABLE 2: Fixed-effects analysis: number of voxels in each location on the group map during event-related paradigm
Group
LV RV LM1 LSMA LACA
k Z k Z k Z k Z k Z
Men, T⫽4.71 3602 7.0 1738 7.0 3050 6.9 246 6.9 212 6.23 Women, T⫽4.73 2452 7.9 132 7.9 1342 7.82 1 4.75 1262 6.53
two subjects was also the lowest in their respective sex groups. Additionally, we did not detect any activation in the LM1 area for one male subject and in the LV area for one female subject. The last exceptional subject was a woman with one of the lowestkvalues for the RV area and no activation in LV and LM1 areas. Only one man and two women had significant activation in the LSMA. Activation in LACA was found in three women and three men. There was no statistical correlation between age, sex, RT, and the lack of suprathreshold activation at the specified areas.
Because there was a wide variation in cluster sizes of activation between subjects, we used natural loga-rithmic scales of the values for statistical analysis. For this reason, values of 0 in Table 1 were taken as the value 1. Volumes of activations in RV, LV, and LM1 areas did not significantly differ between men and
women (Welch modified two-samplet test,P ⱖ .43, Pⱖ.37, andPⱖ.38, respectively) (21). The volumes of the LSMA and LACA were not compared because of the small number of subjects that had activation in these areas. ANOVA failed to show any significant correlations between sex and the volume of brain activation at each location examined.
Fixed-effects group maps showed suprathreshold activation in all locations, with the level of signifi-cance established as greater than P ⬍ .05 corrected for multiple comparisons (Table 2). Random-effects modeling was performed, and suprathreshold activa-tion was shown in visual areas, motor areas, and the LSMA when the uncorrected threshold was set atP⬍ .001 (Table 3). Group maps with fixed- and random-effects models showed larger volumes of activation in both visual and primary motor areas in men. However, because it is not unusual for some voxels with slightly subthreshold activation to show su-prathreshold activation on group maps, we per-formed a two-way t test as a part of the random-effects analysis. This test showed no significant difference in brain activation at any specified re-gion, but differences were observed in right inferior
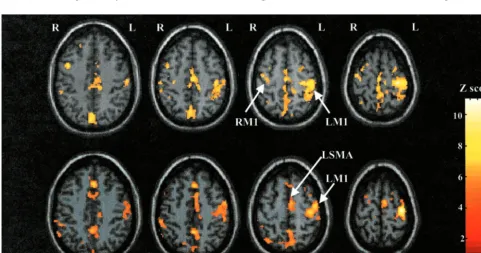
[image:4.603.54.284.168.228.2]FIG 1. Motor activation during the visuomotor response task. Activation was superimposed onto normalized T1-weighted MR images by using SPM99. All regions displayed showed significant activation (P⬍ .001 uncorrected for multiple comparisons).Top row, Individual SPM99 maps of a representative male subject show contralateral and ipsilateral M1 activation.Bottom row, Individual SPM99 maps of a representative female subject show similar degrees of left M1 and SMA activation.
TABLE 3: Random-effects analysis: number of voxels in each location on the group map during event-related paradigm
Group
LV RV LM1 LSMA LACA
k Z k Z k Z k Z k Z
Men, T⫽3.93 583 4.47 367 4.11 144 3.58 0 0 0 0 Women, T⫽3.93 294 3.61 51 3.96 132 3.68 37 4.64 1 3.09
Note.—SPM99 was used. UncorrectedP⬍.001.
TABLE 4: RTs in sex groups during the fMRI paradigm
Group
RT, ms
[image:4.603.54.535.443.696.2]parietal lobule (BA 40), the right insula, and the left thalamus (Fig 5).
The mean percentage signal-intensity changes in the male group were similar to those in the female group: left occipital lobe, 0.43% and 0.44%; right occipital lobe, 0.47% and 0.49%; and left sensorimo-tor cortex, 0.43% and 0.42% in men and women, respectively.
Discussion
To detect possible sex differences in the SRT task paradigm during our fMRI experiment, we studied a visuomotor RT task in groups of age-matched men and women. An age-related diminution in the acti-vated volumes and amplitudes of signal-intensity changes in the motor cortex has been shown previ-ously (22–24). D‘Esposito et al (22) have shown that, in an RT paradigm, the number of suprathreshold voxels in older subjects was four times less than that of younger subjects. We therefore matched our par-ticipants by age to minimize this potential effect on our fMRI activation maps. Our linear regression analysis also showed no effect of age on activation volumes in each sex group.
In our fMRI experiment, we did not detect any significant difference in the RTs between the groups during the event-related paradigm. The results of behavioral studies of RT are somewhat variable (Ta-ble 5). Botwinick et al (6), using a SRT task, showed that elderly women were faster than the elderly men and that young women were slower than young men. In this study the mean age of elderly women was 8 years younger than that of the men, and there was a general impression of the researchers that these women comprised an especially alert and vigorous sample, more so than the elderly men. To eliminate the influence of age, Botwinick et al (7) designed a study, where men and women were matched by age to test age-sex interaction in RT. In this study, there were no significant sex differences with regard to RT and its components. Fozard et al (9) analyzed the data from Baltimore Longitudinal Study of Aging and compared subjects’ performance on SRT and DTR tasks over 8 years. Men were faster than women on RT across all age groups, even on repeat testing. However, subjects’ age was categorized by decade, which pre-cluded precise age matching.
FIG 2. Visual activation during visuomotor response task. Ac-tivation was superimposed onto normalized T1-weighted MR images by using SPM99. Significant medial occipital cortex ac-tivation (P⬍.001 uncorrected for multiple comparisons) is dem-onstrated in a representative.Top, Image in male subject. Bot-tom, Image in female subject.
FIG 3. Surface-rendered activation in a representative female subject. Activation was superimposed on a T1-weighted by using the Montreal Neurologic Institute template provided by SPM99. All regions displayed showed significant activation (P⬍.001 uncorrected for multiple comparisons).
Although studies have involved finger-tapping movements since the introduction of fMRI, few have been conducted to examine the correlation between the volume of brain activation and RT. We know of no literature comparing sex-specific performance and brain activation on an SRT task in the environment of the fMRI unit. Recently, another functional MR im-aging study, performed with the same protocol de-scribed in this study, supported the observation that increased RT correlates with a diminution in volume of activation in the left sensorimotor area (25). We
hypothesized that having subjects matched by age and RT would control for the influence of these factors on human motor activation.
We have shown that the visuomotor task consis-tently activated right and left visual areas, left primary motor area and, in some subjects, the LSMA and LACA. Our interest in ACA areas was based on the recent studies (26, 27) that have shown a negative correlation between subject’s RT and brain activation in ACA area, eg, fast RTs were correlated with larger (wider) brain activity. Unfortunately, only three men and three women had activation of the left ACA, which precluded subsequent evaluation of this area on statistical tests.
When we compared volumes of brain activation in RV, LV, and LM1 on fixed effects individual maps (Table 1), we failed to find any significant differences between paired subjects. Analysis of the group data revealed that men showed consistently larger volumes of activation in both visual and primary motor areas both on the fixed and random effects group maps. Since it is not unusual for some voxels with slightly subthreshold activation to show suprathreshold acti-vation on groups’ maps, we performed a two-way t test to compare the activation pattern of the groups. A two-wayttest of men’s versus women’s brain acti-vation volumes, performed as a part of random ef-fects analysis, showed no significant difference in brain activation at any specified site (RV, LV, LM1, LSMA, LACA). However, a difference was seen in right inferior parietal lobule (BA 40), right insula, and left thalamus (Fig 5) with larger volume of activation among men than among women. We believe that these findings support the notion that there is no significant sex difference in activation of the visual and left motor cortices by using our SRT single event paradigm.
There are many factors that may influence subjects’ RT in the comparatively familiar setting of testing
[image:6.603.53.281.54.286.2]FIG 5. Random effects SPM99 of male versus female brain activation during visuomotor response task. Two-wayttest (T⫽ 3 .47,P⬍.001 uncorrected for multiple comparisons) shows no difference in brain activation at any defined specified site: RV, LV, LM1, LSMA, and LACA. However, men had a larger volume of activation in right inferior parietal lobule, right insula, and left thalamus.
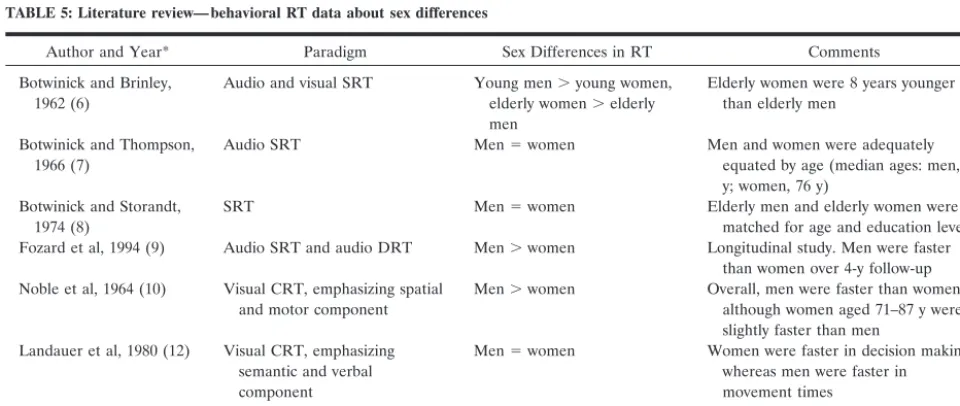
TABLE 5: Literature review— behavioral RT data about sex differences
Author and Year* Paradigm Sex Differences in RT Comments Botwinick and Brinley,
1962 (6)
Audio and visual SRT Young men⬎young women, elderly women⬎elderly men
Elderly women were 8 years younger than elderly men
Botwinick and Thompson, 1966 (7)
Audio SRT Men⫽women Men and women were adequately equated by age (median ages: men, 78 y; women, 76 y)
Botwinick and Storandt, 1974 (8)
SRT Men⫽women Elderly men and elderly women were matched for age and education level Fozard et al, 1994 (9) Audio SRT and audio DRT Men⬎women Longitudinal study. Men were faster
than women over 4-y follow-up Noble et al, 1964 (10) Visual CRT, emphasizing spatial
and motor component
Men⬎women Overall, men were faster than women, although women aged 71–87 y were slightly faster than men
Landauer et al, 1980 (12) Visual CRT, emphasizing semantic and verbal component
Men⫽women Women were faster in decision making, whereas men were faster in movement times
Lahtela et al, 1985 (11) Visual CRT, emphasizing spatial and motor component
Men⬎women In the sample of 2550, men were faster across all ages
[image:6.603.53.533.522.725.2]room. These include the subject’s age, sex, atten-tional-arousal state, practice and anticipation of the stimuli, caffeine use, and cardiovascular status, and the type, intensity, and background of the stimulus and the complexity of the task. The noisy, unfamiliar, anxiety-provoking, and cramped nature of the imag-ing environment creates additional distractions as well as confounding variables with fMRI paradigms. In the present study, we used a visuomotor SRT due to its simplicity, bearing in mind that SRT tasks in-volve little if any cognitive processing and that the loud MR system sounds should have less impact on a SRT focused on motor and visual activation (28). On the basis of the previous studies, using visuomotor paradigms, we assumed that the major factors that might influence the brain activation maps would be sex, age, performance (or subject’s RT), practice and anticipation of the stimuli and attentional and arousal state of the subject.
Conclusion
On the basis of these findings, we believe that a subject’s sex has little influence on the volume of acti-vation in the visual cortices and in the left sensorimotor area during SRT visuomotor fMRI paradigms.
References
1. Andreason PJ, Zametkin AJ, Guo AC, Baldwin P, Cohen RM.
Gender-related differences in regional cerebral glucose metabolism in normal volunteers.Psychiatry Res1994;51:175–183
2. Gur RC, Gur RE, Obrist WD, et al.Sex and handedness differ-ences in cerebral blood flow during rest and cognitive activity.
Science1982;217:659–661
3. Gur RC, Mozley LH, Mozley PD, et al. Sex differences in regional cerebral glucose metabolism during a resting state.Science1995; 267:528–531
4. Rodriguez G, Warkentin S, Risberg J, Rosadini G.Sex differences in regional cerebral blood flow.J Cereb Blood Flow Metab1988;8: 783–789
5. Jaskowski P. Simple reaction time and perception of temporal order: dissociation and hypothesis.Percept Motort Skills1996;82: 707–730
6. Botwinick J, Brinley JF.Aspects of RT set during brief intervals in relation to age and sex.J Gerontology1962;17:295–301
7. Botwinick J, Thompson LW.Components of reaction time in rela-tion to age and sex.J Genet Psychol1966;108:175–183
8. Botwinick J, Storandt M.Cardiovascular status, depressive affect, and other factors in reaction time.J Gerontol1974;29(5):543–548
9. Fozard JL, Vercryssen M, Reynolds SL, et al.Age differences and changes in reaction time: The Baltimore Longitudinal Study of Aging.J Gerontol1994;49:179–189
10. Noble CE, Baker BL, Jones TA.Age and sex parameters in psy-chomotor learning.Percept Motor Skills1964;19:935–945 11. Lahtela K, Niemi P, Kuusela V.Adult visual choice-reaction time,
age, sex and preparedness: a test of Welford’s problem in a large population sample.Scand J Psychol1985;26:357–362
12. Landauer AA, Armstrong S, Digwood J.Sex differences in choice reaction time.Br J Psychol1980;71:551–555
13. Yousem DM, Maldjian JA, Siddiqi F, et al. Gender effects on odor-stimulated functional magnetic resonance imaging.Brain Res
1999;818:480–487
14. Doty RL, Applebaum S, Zusho H, et al.Sex differences in odor identification ability: a cross-cultural analysis.Neuropsychologia
1985;23:667–672
15. Hedera P, Wu D, Collins S, et al.Sex and electroencephalographic synchronization after photic stimulation predict signal change in the visual cortex on functional MR images.AJNR Am J Neuroradiol
1998;19:853–857
16. Levin JM, Ross MH, Mendelson JH, et al. Sex differences in blood-oxygenation-level-dependent functional MRI with primary visual stimulation.Am J Psychiatry1998;155:434–436
17. Mikhelashvili-Browner N, Yousem DM, Mandir AS, et al. Corre-lation of reaction time inside and outside of the functional MRI scanner.Acad Radiol2002;9:513–519
18. Macoby E. and Jacklin C.The Psychology of Sex Differences. Stan-ford: Stanford University Press; 1974
19. Lancaster JL, Summerling JL, Rainey L, et al. The Talairach daemon, a database server for Talairach atlas labels.Neuroimage
1998;5:S633
20. Talaraich J, Tournoux P.Co-planar Stereotaxic Atlas of the Human Brain.New York: Thieme Medical Publishers; 1988
21. Venables WN, Ripley BD. Modern Applied Statistics with S-PLUS. 3rd ed. New York: Spinger-Verlang; 1999
22. D’Esposito M, Zarahn E, Aguirre GK, Rypma B.The effect of normal aging on the coupling of neural activity to the bold hemo-dynamic response.Neuroimage1999;10:6–14
23. Hesselmann V, Zaro Weber O, Wedekind C, et al.Age related signal decrease in functional magnetic resonance imaging during motor stimulation in humans.Neurosci Lett2001;308:141–144 24. Taoka T, Iwasaki S, Uchida H, et al.Age correlation of the time lag
in signal change on EPI-fMRI.J Comput Assist Tomogr1998;22: 514–517
25. Karli Oguz K, Mikhelashvili N, Yousem D, et al.Correlation of reaction time with brain activation during fMRI experiment. Ra-diology2003;226:188–194
26. Naito E, Kinomura S, Geyer S, et al.Fast reaction to different sensory modalities activates common fields in the motor areas, but the anterior cingulated cortex is involved in the speed of reaction.
J Neurophysiol2000;83:1701–1709
27. Horwitz B, Deiber MP, Ibanez V, et al.Correlation between reac-tion time and cerebral blood flow during motor preparareac-tion. Neu-roimage2000;12:434–441
28. Elliott MR, Bowtell RW, Morris PG.The effect of scanner sound in visual, motor, and auditory functional MRI. Magn Reson Med