T1 Hyperintensity in the Pulvinar: Key Imaging
Feature for Diagnosis of Fabry Disease
Jun-ichi Takanashi, A. James Barkovich, William P. Dillon, Elliott H. Sherr, Kimberly A. Hart, and Seymour Packman
BACKGROUND AND PURPOSE:Fabry disease (FD) is an inborn error of glycosphingolipid metabolism. To date, no specific neuroimaging features have been elucidated to help in making the diagnosis of this disorder. The purpose of this study was to determine whether the finding of T1 shortening in the lateral pulvinar is a useful finding in the imaging diagnosis of FD and to deduce the relationship of this finding to the pathophysiology of the disease.
METHODS:We studied T1- and T2-weighted images obtained in ten patients (nine male and one female) with FD with an age range of 19 –59 years. The images were examined for anatomic aberrations and areas of abnormal signal intensity (SI) in both gray matter and white matter. The SI of deep gray matter was evaluated qualitatively and semiquantitatively, relative to the SI of CSF or the genu of the corpus callosum. Gradient echo MR images and axial noncontrast CT images were available for one patient.
RESULTS:Seven of 10 patients showed small areas of T2 prolongation in the white matter of the cerebral hemispheres. Despite the known propensity for vascular disease in these patients, only one had cortical infarction. Bilateral T1 shortening in the lateral pulvinar was recognized in at least seven patients, all over the age of 30 years, who also had small areas of T2 prolongation in the white matter. CT and gradient echo images in one patient revealed no evidence of calcification or metallic deposits in the pulvinar.
CONCLUSION:Bilateral T1 shortening in the lateral pulvinar is a common finding in FD and may be useful in suggesting this diagnosis.
Fabry disease (FD) is an X-linked disorder of glyco-sphingolipid metabolism (1). Deficient activity of the lysosomal hydrolase,␣-galactosidase A, leads to pro-gressive accumulation of glycosphingolipids, predom-inantly ceramide trihexoside, in the vascular endothe-lium, peritheendothe-lium, and smooth muscle cells, as well as in parenchymal cells in the kidney, heart, dorsal root ganglia, autonomic nervous system, and brain (2–6). Progressive endothelial glycosphingolipid accumula-tion results in compromise of lumen size and subse-quent vascular events such as myocardial ischemia and stroke. These events typically occur in the late fourth through early sixth decades of life (1).
The effects of the cerebral vasculopathy of FD are well visualized on MR images. T2-weighted images show an increasing number of deep white matter and
deep gray matter high signal intensity (SI) lesions that may coalesce over time (7, 8). Autopsies have re-vealed that these deep white matter lesions are lacu-nar infarctions or are associated with lacu-narrowing of small arterioles (1–3, 9). With age, larger vessels are affected, and infarctions involving the cortical gray matter also appear (7). The tendency for larger cor-tical lesions to occur in the vertebrobasilar territory could be explained by lumen compromise superim-posed on the ectasia found in these vessels (7, 10). Using Kaplan-Meier estimates, Crutchfield et al (7) found that in a group of FD patients the mean age when a lesion of variable location was disclosed by MR imaging was 43 years (38 years for 25% preva-lence, 43 year for 50% prevapreva-lence, and 48 years for 75% prevalence), which is slightly earlier than the development of T2 hyperintensities in normal popu-lations. However, small T2 hyperintensities of the periventricular white matter and deep gray matter are common, nonspecific findings and, as such, are not useful in establishing, or even suggesting, a diagnosis of FD. Furthermore, only 37.5% of the patients with lesions visualized on MR images were symptomatic. We herein report our study of brain MR imaging in a cohort of patients with FD. We suggest that specific
Received August 22, 2002; accepted after revision December 16. From the Neuroradiology Section, Department of Radiology (J.T., A.J.B., W.P.D.), Department of Neurology (E.H.S), and Division of Medical Genetics, Department of Pediatrics (K.A.H, S.P), University of California, San Francisco, CA
Address correspondence to Jun-ichi Takanashi, M.D., Depart-ment of Pediatrics, Graduate School of Medicine, Chiba Univer-sity, 1–8-1 Inohana, Chuo-ku, Chiba-shi, Chiba 260-8677, Japan.
©American Society of Neuroradiology
MR imaging findings may allow an early diagnosis of FD and perhaps allow early intervention to help to prevent or delay the later complications of the disease.
Methods
Inclusion Criteria
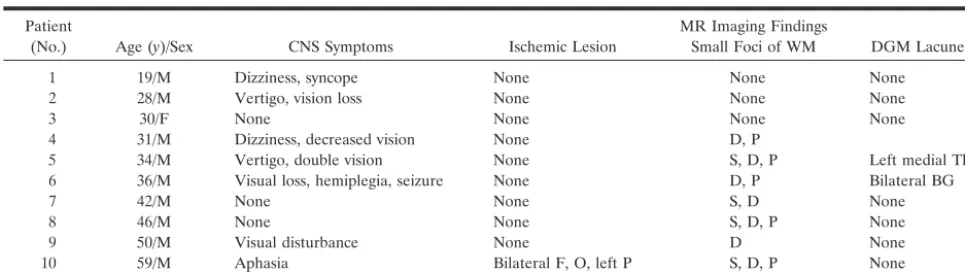
We studied 10 patients (nine male, one female) with FD, 19–59 years of age (Table 1). The diagnosis of FD was con-firmed by assay of leukocyte␣-galactosidase A enzyme activity and, in some instances, mutation identification. Central ner-vous system symptoms of these patients are described in Table 1. Most of the symptoms were transient, suggesting transient ischemic attack, except for double vision in patient 5 and aphasia in patient 10. No participant had hepatic dysfunction. The study protocol was approved by our institutional review board, and all subjects gave written informed consent for their participation.
Imaging Techniques
All MR imaging studies were performed with a 1.5-T mag-net. Axial spin-echo T1-weighted images (500/12/2 [TR/TE/ NEX]) and conventional spin-echo T2-weighted images (2500/ 80/1) were obtained. Conventional spin-echo sequences have the advantage of better contrast-to-noise ratio, which is impor-tant in evaluating subtle cortical and white matter abnormali-ties. In a single patient (patient 10), gradient-echo images (500/25; ⫽ 30), diffusion-weighted echo planar imaging (7000/100; b⫽800), and brain CT (contiguous axial 3.75-mm images without contrast medium administration) were also performed.
Image Interpretation
All images were reviewed, individually and jointly, by two reviewers (J.T., A.J.B.) with experience in neuroimaging. When disagreements occurred, they were resolved by consensus. In particular, the images were reviewed for the presence of T2 high-SI abnormalities in the cerebral (periventricular, deep, subcortical) and cerebellar white matter or deep gray matter; evidence of ischemic infarction (cortical atrophy or T1 short-ening with T2 prolongation in the underlying white matter); and SI abnormalities in the deep gray matter (globus pallidus, putamen, thalamus, substantia nigra, red nucleus, and cerebel-lar dentate nucleus). T1 and T2 shortening were considered qualitatively abnormal when a structure was more hyperintense or hypointense on T1- or T2-weighted images than the SI expected for age, as compared with normal standards (11). We also semiquantitatively analyzed ratios of SI of the deep gray
matter structures relative to those of cerebrospinal fluid in the lateral ventricle or genu of the corpus callosum (CC). To perform this assessment, circular regions of interest were placed over each deep nuclear structure, as well as over the frontal horn of the lateral ventricle and the callosal genu. The SI from each measurement was recorded, and then SI ratios were calculated for each deep nuclear structure by using both the frontal horn and the callosal genu as the denominator. For age-matched controls, we reviewed MR studies of 40 adult patients, 20–60 years of age (10 patients, 20–30 years of age; 10, 30–40 years of age; 10, 40–50 years of age; and 10, 50–60 years of age). These control patients were imaged because of headaches, seizures, or neck problems; all had normal MR imaging findings, normal neurologic examination results, and a history of normal development. SI ratios were considered ab-normal if they differed by more than 2 SD from the SI ratios of age-matched controls.
Results
The clinical data and MR findings in each FD patient are presented in Tables 1 and 2. Seven of 10 patients showed small foci of T2 prolongation in the white matter. In patient 9, the abnormalities were so subtle that they were judged to be normal for age. In patient 10, who had had a clinical stroke, MR imaging also revealed extensive chronic infarctions (without reduced diffusion) in the left parietal and both frontal and occipital lobes. No acute infarctions were identi-fied.
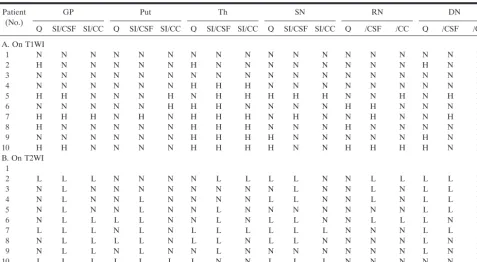
Nearly identical oval-shaped regions of prominent T1 shortening were qualitatively recognized in the lateral aspect of the posterior thalamus (the lateral pulvinar) bilaterally in eight patients with FD (Figs 1A and 2A). Abnormal T1 shortening was recognized in the pulvinar in seven patients by means of SI ratio analysis (relative to both CSF and CC). T2 shortening was identified in the pulvinar in three patients by qualitative analysis, in six patients by SI ratio analysis relative to CSF, and in two patients by SI ratio anal-ysis relative to CC (Table 2). CT and gradient echo images, which were available in patient 10, showed no SI abnormalities in the pulvinar (Fig 1C-E).
Qualitative analysis revealed peripheral T1 short-ening in the globus pallidus in five patients; in three of them, central T2 shortening of the globi palladi was also identified. Abnormal T1 and T2 shortening in the globus pallidus were detected in three (T1 shorten-TABLE 1: Clinical and MR imaging findings in Fabry disease
Patient
(No.) Age (y)/Sex CNS Symptoms Ischemic Lesion
MR Imaging Findings
Small Foci of WM DGM Lacunes
1 19/M Dizziness, syncope None None None
2 28/M Vertigo, vision loss None None None
3 30/F None None None None
4 31/M Dizziness, decreased vision None D, P
5 34/M Vertigo, double vision None S, D, P Left medial Th
6 36/M Visual loss, hemiplegia, seizure None D, P Bilateral BG
7 42/M None None S, D None
8 46/M None None S, D, P None
9 50/M Visual disturbance None D None
10 59/M Aphasia Bilateral F, O, left P S, D, P None
[image:2.603.54.537.69.205.2]ing) and nine patients (T2 shortening) by use of SI ratio analysis relative to CSF and in one (T1 short-ening) and six patients (T2 shortshort-ening) by use of SI ratio analysis relative to CC (Figs 1A and B, 2A and B). In the putamen, abnormal T1 and T2 shortening were detected in zero (T1 shortening) and three pa-tients (T2 shortening) by use of qualitative analysis, in two (T1 shortening) and seven patients (T2 shorten-ing) by use of SI ratio analysis relative to CSF, and in zero (T1 shortening) and one patient (T2 shortening) by use of SI ratio analysis relative to the CC (Figs 1A and B, 2A and B). Analyses of the other deep gray nuclei by using both qualitative and semiquantitative methods are described in Table 2. In patient 10, CT showed hyperattenuation in the bilateral globus pal-lidus and medial occipital cortex (Fig 1C), and gradi-ent echo images showed hypointensity in the globi palladi, which suggests the presence of senescent cal-cification. No SI abnormality was identified in the putamen, substantia nigra, or dentate nucleus on CT scans, whereas hypointensity was present in those regions on the gradient echo MR images (Fig 1D).
Discussion
This study suggests that abnormal SI in the deep gray nuclei is common in patients with FD and that the presence of T1 shortening in the lateral pulvinar is a common and sensitive finding in patients with this disease. Our review of the literature pertaining to FD revealed no previous mention of thalamic involve-ment. T1 shortening in the pulvinar was recognized in all seven patients over the age of 30 years. This
find-ing was substantiated by use of three qualitative and semiquantitative methods to evaluate T1 and T2 ab-normalities in the deep cerebral and cerebellar nuclei. Other neurologic disorders have been described to manifest T1 shortening in the thalamus, including profound asphyxia (12), postanoxic Parkinsonism (13), acute necrotizing encephalopathy (14), Tay-Sachs disease (15), and Krabbe disease (16). In the usual clinical circumstances, however, these other dis-orders are easily distinguished from FD by clinical consideration and MR imaging findings in brain re-gions other than the thalamus. Symmetric T2 prolon-gation in the pulvinar is characteristic of both spo-radic and variant Creutzfeldt-Jacob disease, in which setting it is known as the “pulvinar sign;” however, the T1-weighted imaging findings are usually normal (17, 18).
[image:3.603.57.534.70.331.2]Histochemical studies from brain tissue of patients with FD have revealed an accumulation of glyco-sphingolipids, predominantly ceramide trihexoside, within selected neurons in the spinal cord and gan-glia, brain stem, amygdala, hypothalamus, and layers 5 and 6 of cerebral cortex (2). These regions, how-ever, showed no SI abnormality on MR images. On the other hand, histochemistry reportedly shows no abnormalities in the striatum, globus pallidus, or thal-amus (2), regions that show SI changes on the MR studies of our patients. Thus, it seems unlikely that accumulation of ceramide trihexoside, per se, ac-counts for the T1 and T2 changes that we observed. One possible cause of T1 and T2 shortening on MR images is calcification. The presence of certain cal-cium salts in the brain causes alterations in water TABLE 2: Signal intensity of deep gray matter
Patient (No.)
GP Put Th SN RN DN
Q SI/CSF SI/CC Q SI/CSF SI/CC Q SI/CSF SI/CC Q SI/CSF SI/CC Q /CSF /CC Q /CSF /CC
A. On T1WI
1 N N N N N N N N N N N N N N N N N N
2 H N N N N N H N N N N N N N N H N N
3 N N N N N N N N N N N N N N N N N N
4 N N N N N N H H H N N N N N N N N N
5 H H N N N H N H H H H H N N H N H H
6 N N N N N H H H N N N N H H N N N N
7 H H H N H N H H H N H N N H N N H N
8 H N N N N N H H H N N N H N N N N N
9 N N N N N N H H H H N N N N N H N N
10 H H N N N N H H H H N N H H H H N N
B. On T2WI 1
2 L L L N N N N L L L L N N L L L L N
3 N L N N N N N N N N L N N L N L L N
4 N L N N L N N N N L L N N L N L L N
5 N L N N L N N L N N N N N N N L L N
6 N L L L L N N L N L L N N L L L N N
7 L L L N L N L L L L L L N N N L L L
8 N L L L L N L L N L L N N N N L N N
9 N L L N L N N L N N N N N N N L N N
10 L L L L L L L N N L L L N N N N N N
proton relaxation times that are believed to be related to adsorption of water by the crystalline structure of the calcium salts (surface effect; 19). Calcification is commonly seen in the globus pallidus as part of the aging process (20, 21). Calcification of deep nuclei other than the pallidum has been described in meta-bolic and endocrine disorders (21). At least three (patients 4, 6, 9) of our seven patients with T1 short-ening in the pulvinar had no abnormal SI suggesting calcification in the globus pallidus, which indicates that the pulvinar SI was not senescent calcification. In addition, the CT and gradient echo MR images of patient 10, in whom T1 shortening was observed in both globus pallidus and pulvinar, showed evidence of calcification only in the former (Fig 1C). Moreover,
the pattern of T1 shortening in the pallidum was different from that in the pulvinar, the former being patchy around a central hypointensity, whereas the latter was homogeneous in all patients. Because pa-tient 10 was 59 years old at the time of the study, the pallidal calcification could be senescent, but the SI homogeneity and absence of CT evidence of calcium in the pulvinar suggest that, unless MR is more sen-sitive than CT to low concentrations of calcium salts, the T1 shortening in the pulvinar has a cause other than calcium and a different pathogenesis.
What are other potential causes of the T1 shorten-ing in the pulvinar of our FD patients? T1 shortenshorten-ing can result from interaction of water molecules with large surrounding molecules (as in proteinaceous
flu-FIG 1. Patient 10.
A, Axial T1-weighted spin-echo image at the level of basal ganglia shows hyper-intense lesions in the bilateral peripheral globus pallidus, lateral pulvinar ( arrow-head), and medial occipital cortex.
B,Axial T2-weighted image spin-echo showing hypointensity in the bilateral glo-bus pallidus (small arrowhead) and puta-men (arrowhead).
C,Noncontrast axial CT scan reveals cal-cification in the bilateral globus pallidus and medial occipital cortex; however, no abnor-mal attenuation exists in the pulvinar.
DandE,Coronal gradient echo images show hypointensity in the putamen and substantia nigra (D, arrowhead) but normal SI in pulvinar (E).
FIG 2. Patient 8.
A, T1-weighted spin-echo image at the level of basal ganglia shows hyperintensity in right globus pallidus and bilateral lateral pulvinar (arrowhead).
id), causing slowing of water motion, or from direct interactions of water protons with unpaired outer-shell electrons of ions, allowing an electron-proton spin-spin interaction (as with gadolinium enhance-ment). In clinical MR, it is most commonly attributed to interaction of water protons with products of hem-orrhage or trace metals, such as manganese or cop-per, or free radicals such as melanin (22, 23). Lipid protons have short T1 relaxation times and are seen as hyperintense on MR images, although they have a different chemical shift than water molecules. Thus, lipids can usually be identified by an associated chem-ical shift artifact. Alternatively, a fat-suppression pulse can be used to eliminate SI and definitively identify an imaging finding as a lipid. Hyperintense findings may also result from locally high cellularity as well as hamartomas and infarcted cortex (so-called laminar necrosis) for unknown reasons (12, 24). In our patients with FD, petechial hemorrhage or hem-orrhagic infarction seems unlikely because of the nor-mal CT and gradient echo images in patient 10, whose T1-weighted images were identical to those of the other patients in the series. We were unable to defin-itively eliminate lipid as a cause, because fat-suppres-sion pulses were not used in any of the patients; however, in view of the absence of chemical shift artifact and the absence of any fat on the CT scan of patient 10, it seems that lipid is an unlikely cause of the SI abnormality. Thus, hypercellularity, ionic inter-actions, or interactions with free radicals are possible causes that need to be considered. Proton MR spec-troscopy in patients with FD shows a widespread reduction ofN-acetylaspartate, but no specific finding in the thalami (25). In addition, there has been no known neuropathologic abnormality described in the pulvinar that might cause the T1 shortening described above (2–6). Further neuropathologic evaluation, as well as neuroradiologic assessment, including fat-sup-pressed sequences and, perhaps, molecular biologic assessment will be necessary to clarify the pathophys-iology of the T1 shortening.
Abnormal T2 shortening in the putamen and other deep gray matter structures was observed in some patients by both qualitative and semiquantitative methods, although the incidence of the abnormality was not as consistent among the three methods as was the T1 shortening in the pulvinar. Prominent T2 shortening of the putamen has been reported in pa-tients with various degenerative disorders of the cen-tral nervous system as the result of iron accumulation, possibly due to increased axonal iron transport (26). The CT (normal) and gradient echo imaging (marked hypointensity) findings in the putamen, substantia nigra, and dentate nuclei in patient 10 were compat-ible with iron deposition. T1 shortening, however, was also recognized in the substantia nigra, red nuclei, and dentate nuclei in some patients with FD. Because the T1 shortening effect of iron is much weaker than the T2 effect (26), the T1 shortening in these regions cannot be explained solely by iron deposition. We hypothesize that additional factors, possibly the same
mechanisms as those at work in the pulvinar, may play a role in the T1 shortening of these regions.
We elected to use both semiquantitative and qual-itative (visual inspection) methods in this study be-cause subtle changes in SI may be difficult to perceive in individual cases. In addition, because the SI of the deep nuclei change in relation to that of the white matter during development and aging (11), we com-pared our patients with age-matched controls. We believe that, by using semiquantitative methods and requiring SI ratios more than 2 SD from the mean, we have probably decreased the sensitivity of detecting abnormalities of the deep nuclei. Indeed, we thought that patient 2 had abnormal T1 shortening of the pulvinar, but the SI differed from the norm by less than 2 SD by using semiquantitative methods. Had we classified findings in this patient as abnormal, our results would have indicated that 80% of our patients had abnormal pulvinar SI. In addition, it is possible that our semiquantitative method could give spurious results. The SI ratio relative to CSF may be influ-enced by the CSF motion or partial volume effect, neither of which is necessarily consistent among pa-tients. The SI ratio relative to the CC as the denom-inator may vary with age or may not be completely normal in FD patients, even though no abnormal SI lesion could be recognized on routine MR images. As a result of the potential problems with both quanti-tative methods and the qualiquanti-tative method, the data were analyzed by using all three (one qualitative and two semiquantitative) methods. The consistency of the findings among the three methods as compared with a group of age-matched controls strongly sug-gests that the observations are valid.
The pulvinar is generally thought to have little important function in humans. Recent articles have suggested a role in spatial coding of vision (27). It may be of interest to test spatial coding in patients with FD and pulvinar T1 shortening on MR images to determine whether these areas of SI abnormality im-pair function of the affected regions.
had no symptomatic stroke (7), we stress that it is essential to suspect FD when bilateral T1 shortening in the pulvinar is recognized at MR imaging.
Conclusion
We evaluated MR imaging studies of 10 patients with FD to describe neuroradiologic findings of this disorder, to determine whether any neuroradiologic findings help the physician to suggest this diagnosis, and to deduce the relationship of the findings to the pathophysiology of the brain involvement in FD. Seven of 10 patients showed small areas of T2 pro-longation in the white matter of the cerebral hemi-spheres. Despite the known propensity for vascular disease in these patients, only one had cortical infarc-tion. Bilateral T1 shortening in the lateral pulvinar was recognized in at least seven patients, all over the age of 30 years, who also had small areas of T2 prolongation in the white matter. CT and gradient echo images obtained in one patient revealed no evidence of calcification or metallic deposits in the pulvinar. Bilateral T1 shortening in the lateral pulvi-nar is a common finding in FD and may be useful in suggesting this diagnosis.
Acknowledgments
We wish to thank the patients and their families for their contribution to this study. We also thank Dr. Masaharu Ha-yashi (Department of Clinical Neuropathology, Tokyo Metro-politan Institute for Neuroscience, Tokyo, Japan) for helpful advice. This work was supported in part by funding from the Niemann-Pick Foundation, the California Genetic Disease Branch, the Genzyme Corporation, and by National Institutes of Health (NIH) grant M01RR01271 to the University of Cal-ifornia, San Francisco, Pediatric Clinical Research Center. E.H.S. is supported by a Neurological Sciences Academic De-velopment Award from the NIH.
References
1. Desnick RJ, Ioannou YA, Eng CM.␣-galactosidase A deficiency: Fabry disease.In: Scriver CR, Beaudet AL, Sly WS, Valle D, eds.
The metabolic and molecular bases of inherited disease, 8th ed. New York: McGraw-Hill; 2001:3733–3774
2. deVeber GA, Schwarting GA, Kolodny EH, Kowall NW.Fabry disease: immunocytochemical characterization of neuronal in-volvement.Ann Neurol1992;31:409–415
3. Kaye EM, Kolodny EH, Logigian EL, Ullman MD.Nervous system involvement in Fabry’s disease: clinicopathological and biochemi-cal correlation.Ann Neurol1988;23:505–509
4. Drunnet ML, Spilsbury PR.The central nervous system in Fabry’s disease.Arch Neurol1973;28:231–234
5. Tabira T, Goto I, Kuroiwa Y, Kikuchi M.Neuropathological and biochemical studies in Fabry’s disease.Acta Neuropathol1974;30: 345–354
6. Rahman AN, Lindenberg R.The neuropathology of hereditary dystropic lipidosis.Arch Neurol1963;9:373–385
7. Crutchfield KE, Patronas NJ, Dambrosia JM, et al.Quantitative analysis of cerebral vasculopathy in patients with Fabry disease.
Neurology1998;50:1746–1749
8. Morgan SH, Rudge P, Smith SJM, et al.The neuropathological complications of Anderson-Fabry disease (␣-galactosidase A defi-ciency): investigation of symptomatic and presymptomatic pa-tients.Q J Med1990;75:491–504
9. Scully RE, Mark EJ, McNeely BU.Case records of the Massachu-setts General Hospital.N Engl J Med1984;310:106–114 10. Mitsias P, Levine SR.Cerebrovascular complications of Fabry’s
disease.Ann Neurol1996;40:8–17
11. Aoki S, Okada Y, Nishimura K, et al.Normal deposition of brain iron in childhood and adolescence: MR imaging at 1.5 T.Radiology
1989;172:381–385
12. Barkovich AJ.MR and CT evaluation of profound neonatal and infantile asphyxia.AJNR Am J Neuroradiol1992;13:959–972 13. Li JY, Lai PH, Chen CY, Wang JS, Lo YK.Postanoxic
Parkinson-ism: clinical, radiologic, and pathologic correlation. Neurology
2000;55:591–593
14. Yagishita A, Nakano I, Ushioda T, et al.Acute encephalopathy with bilateral thalamotegmental involvement in infants and children: imaging and pathology findings.AJNR Am J Neuroradiol1995;16: 439–447
15. Mugikura S, Takahashi S, Higano S, et al.MR findings in Tay-Sachs disease.J Comput Assist Tomogr1996;20:551–555 16. Kendall BE.Disorders of lysosomes, peroxisomes, and
mitochon-dria.AJNR Am J Neuroradiol1992;13:621–653
17. Zeidler M, Sellar RJ, Collie DA, et al. The pulvinar sign on magnetic resonance imaging in variant Creutzfeldt-Jacob disease.
Lancet2000;335:1412–1418
18. Collie DA, Sellar RJ, Zeidler M, et al.MRI of Creutzfeldt-Jakob disease: imaging features and recommended MRI protocol.Clin Radiol2001;56:726–739
19. Henkelman RM, Watts JF, Kucharczyk W.High signal intensity in MR images of calcified brain tissue.Radiology1991;179:199–206 20. Ho VB, Fitz CR, Chuang SH, Geyer CA.Bilateral basal ganglia
lesions: pediatric differential considerations.Radiographics1993; 13:269–292
21. Shanley DJ.Meneralizing microangiopathy: CT and MRI. Neuro-radiology1995;37:331–333
22. Gomori JM, Grossman RI.Mechanisms responsible for MR ap-pearance and evolution of intracranial hemorrhage.Radiographics
1988;8:427–440
23. Atlas SW, Grossman RI, Gomori JM, et al.MR imaging of the intracranial metastatic melanoma.J Comput Assist Tomogr1987; 11:577–582
24. Boyko OB, Burger PC, Shelburne JD, Ingram P.Non-heme mech-anisms for T1 shortening: pathologic, CT, and MR elucidation.
AJNR Am J Neuroradiol1992;13:1439–1445
25. Tedeschi G, Bonavita S, Banerjee TK, et al.Diffuse central neu-ronal involvement in Fabry disease: a proton MRS imaging study.
Neurology1999;52:1663–1667
26. Vymazal J, Righini A, Brooks RA, et al.T1 and T2 in the brain of healthy subjects, patients with Parkinson disease, and patients with multiple system atrophy: relation to iron content.Radiology
1999;211:489–495
27. Ward R, Danziger S, Owen V, Rafal R.Deficits in special coding and feature binding following damage to spatiotopic maps in the human pulvinar.Nat Neurosci2002;5:99–100
28. Brady RO, Murray GJ, Moore DF, Schiffmann R.Enzyme replace-ment therapy in Fabry disease.J Inherit Metab Dis2001;24:18–24 29. Eng CM, Guffon N, Wilcox WR, et al. Safety and efficacy of recombinant human ␣-galactosidase A replacement therapy in Fabry’s disease.N Engl J Med2001;345:9–16
30. Schiffmann R, Kopp JB, Austin HA, et al.Enzyme replacement therapy in Fabry disease: a randomized control trial.JAMA2001; 285:2743–2749
31. Moore DF, Scott LTC, Gladwin MT, et al. Regional cerebral hyperperfusion and nitric oxide pathway dysregulation in Fabry disease: reversal by enzyme replacement therapy.Circulation2001; 104:1506–1512