R
nted in Great BritainCONVERGENCE OF OLFACTORY INPUTS FROM BOTH
ANTENNAE IN THE BRAIN OF THE HONEYBEE
BY HIKARU SUZUKI*
Department of Biology, Faculty of Science, Kyushu University, Fukuoka 812, Japan
(Received 26 April 1974)
SUMMARY
Electrical activities of the olfactory neurones in the brain of the honeybee were investigated. Odorous stimuli were given to each antenna separately or to both simultaneously. The inputs from the antennae affected both the impulse frequency and the latency of the olfactory interneurones in the proto-cerebrum. The predominant response was to the stimulation of the ipsilateral antenna. Input from the contralateral antenna produced mainly excitatory effects, although a few inputs gave inhibitory effects.
No particular relationships between the loci of the units in the brain and the types of responses produced were found. Most of the units were located in the protocerebral lobe and in the central commissure. The units in the deuto-cerebrum responded only to the stimulation of the ipsilateral antenna, and the magnitude of response and the latency were not different with respect to unilateral or bilateral stimulation of the antennae. Differences in latency between unilateral and bilateral stimulation were observed in some of the units in the protocerebrum.
Neural models which explain these phenomena are postulated.
INTRODUCTION
The central mechanisms of the olfactory senses in insects have long been inferred from behavioural experiments. Martin (1964) showed that a bee with one antenna could still orient to the odour source, but could not do it as well as a normal bee. This suggests that the olfactory inputs from both antennae converge in the brain. But the electrical activities of the olfactory interneurones in the brain have not previously been much explored. The aim of the present investigation was to study the nature and function of the olfactory interneurones in the brain of the honeybee by applying odorous stimuli either to each antenna separately or to both simul-taneously.
MATERIALS AND METHODS
The worker of the honeybee (Apis ntellifera L.) was used as an experimental animal. The colony of the bee was maintained in an open field under natural conditions. Foraging workers were collected at the entrance of the hive.
1 2 HIKARU SUZUKI
To amp.
GPL
ST
An
Fig. i. Schematic representation of the recording methods. An, antenna; AF, odourless air flow; GPL, glass plate; GPP, glass pipette containing physiological salt solution; IND, indifferent electrode; RE, recording electrode; ST, glass pipette containing stimulant.
For the experiment the animal was chilled in an ice box (about 5 °C). After the animal entered chill-coma, the head was immobilized by putting the neck into a fine slit of lucite plate with beeswax. The antennae were immobilized with beeswax. The compound eyes were covered with black lacquer. A small piece of cuticle was removed from the front of the head. The tracheal membranes and the glandular cells over the brain were removed. The mandibular muscles were cut off to minimize movements. A glass capillary with a tip less than 1 fim in diameter filled with 10% potassium ferricyanide solution was used as a recording electrode. The frontal surface of the brain was pressed gently with a glass pipette with a tip diameter of about 0-5 cm and an internal diameter of about o-i cm (GPP in Fig. i), and the recording electrode was inserted into the brain through the pipette. The pipette was filled with physiological salt solution. An indifferent electrode of silver wire was placed parallel to the pipette on the brain (IND in Fig. 1). Ionic components of the physiological salt solution were made up with 11 mM-NaCl, 31 mM-KCl, 21 mM-MgCl2 and 18 mM-CaCl2, and the
osmotic concentration was adjusted to 285-7 mM with sucrose.
Methyl-ethyl-ketone was used as the odorous stimulant. Stimuli of usually 500 msec duration were applied with at least 3 min interval between them to prevent fatigue or habituation (Suzuki & Tateda, 1974).
Plponses to the odorous substance were the same as those to mechanical stimulation, they were assumed to be the responses to mechanical stimulation and were excluded from this experiment.
After the responses were recorded, an electrical current of about io~7 A was passed for 1-1-5 min through the electrode (the recording electrode was led to the anode and the indifferent electrode to the cathode of a 1-5 V battery), and then the brain was soaked with 2 % ferrous chloride solution. This marked the recording site with blue. The head was fixed with 10% formalin solution, dehydrated with alcohols, and embedded in paraffin. Frontal sections of up to 10 /im thick were cut and stained with eosin, and the blue mark showing the electrode position was observed by light micro-scopy. Experimental records were taken from only one unit of each bee.
RESULTS
Unitary responses to the odorous stimulation of the antennae were recorded in the brain of the honeybee. The right antenna was called ipsilateral (IL) and the left antenna contralateral (CL). Recordings of the unitary responses were carried out in the right brain of the bee. Some of the units were obtained from the left brain and were mapped on the symmetrical position of the right brain. The characteristics of the unitary activities (background discharge frequency, response pattern, latencies, etc.) were almost the same as those described by Suzuki & Tateda (1974).
The activities of the units were tested by stimulating antennae separately or simultaneously. The tests showed that most of the units in the protocerebrum received information from both antennae, while the units in the deutocerebrum responded only to the stimulation of the ipsilateral antenna.
(A) Classification of the units
The 125 units studied were classified fundamentally into nine groups based on the responses to the stimulation of each antenna separately. They were (IL ( + ) , —),
(+), CL (—)), (IL ( - ) , CL (+)), and (—, —) groups. For example, the units in the (IL( + ), CL( —)) group showed an excitatory response to the stimulation of the ipsilateral antenna and an inhibitory response to the stimulation of the contralateral antenna. The units which did not respond to separate stimulation of the antennae were included in the (—, —) group.
The magnitude of the response (which was defined as the mean number of impulses appearing in every 100 msec) to the stimulation of each antenna separately increased or decreased when the antennae were stimulated simultaneously. Therefore, the units in these groups were further divided into many types according to the differences in magnitude of response to the simultaneous stimulation of both antennae. For example, there were three types of the unit observed in the (IL ( + ) , —) group, i.e. the units whose magnitude of response to bilateral stimulation was equal to (ILE type), larger (IES type) or smaller (ICI type) than that resulting from stimulation of the ipsilateral antenna alone.
HIKARU SUZUKI
Groups
(IL ( + ),—)
Total
47 (38)
}
[image:4.451.61.379.56.342.2]} 3° (23)
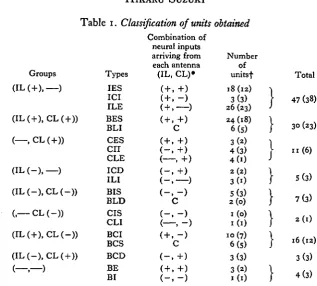
Table 1. Classification of units obtained
Combination of neural inputs arriving from each antenna Types (IL, CL)»
IES ( + , +) ICI ( + , - ) ILE ( + , ) BES ( + , +) BLI C CES ( + , +)
cn (-, +)
CLE ( , + ) ICD ( - , + ) ILI ( - , ) BIS ( - , - ) BLD C CIS ( - , - ) CLI ( , - ) BCI ( + , - ) BCS C BCD ( - , + ) ( — , — ) BE ( + , + )
BI ( - , - )
• IL, ipsilateral; CL, contralateral; + , excitatory; —, inhibitory inputs; C, complex inputs, •f Parentheses, located units.
(IL (-),—) (IL(-).CL(-)) Number of unitsf 18(12) 3(3)
26 (23)
24(18) 6(5) 3(2) 4(3) 4d) 2(2)
3 ( 0
5(3) 2(0) 1(0) 1(1) 10(7) 6(S) 3(3) 3(2)
1 ( 1 )
n (6)
5(3) 7(3) 2(1) 16 (12) 3(3) 4(3)
inhibitory inputs from the ipsi- and contralateral antennae respectively, and that the ILE type units would receive inputs from the ipsilateral antenna alone.
Classification of the units found in the present experiments is summarized in Table 1. Examples of some of these units are shown in Fig. 2. Excitatory units were more common than inhibitory units. In the units receiving input from only one antenna, the ILE type was dominant. In the units receiving inputs from both antennae, the dominant type was BES. The complexity of the neural networks might indicate the possible existence of other types of units, such as those which receive excitatory and inhibitory inputs from the ipsi- and the contralateral antennae respectively in the (—, CL ( —)) group. However they were not found in this investigation.
Most of the units were assumed to receive an excitatory or an inhibitory input from each antenna in response to the respective stimulations. Table 1 (Column 3) shows the nature of the inputs that it was inferred were received by the units from each antenna. Some units (BCS, BLI and BLD) did not show types of activity predictable from the response to separate stimulation. These units (described as complex - C - in Table 1) were thought to receive inputs which interacted with each other on the way from the primary neurones to the neurone concerned.
As shown in Table 1, most of the units received an excitatory input from the contra-lateral antenna; only 21 units received an inhibitory input from the contracontra-lateral antenna.
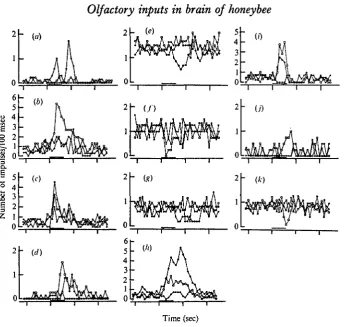
Time (sec)
Fig. 2. Graphic representation of olfactory responses recorded in the brain. In each graph, open circle, closed circle, and open square represent the responses to the stimulation of ipsi-(IL), contra- (CL), and bilateral antennae (BL), respectively. Stimuli were given at the black bar which is shown at the bottom of each graph. Vertical axis; mean number of impulses per 100 msec. Horizontal axis; time in seconds. Response types and number of measurements (n) are as follows; (a), ICI type, n-IL 7, CL 6, BL 9; (6), BES type, n-IL 3; CL 4, BL 3; (c), BL1 type, n-IL 4, CL 4, BL 4; {d) CES type, n-IL 7, CL 4, BL 4; (e), ICD type, n-IL 7, CL 6, BL 6; (/), BIS type, n-IL 4, CL 3, BL 4; (g), BLD type, n-IL 5, CL 5, BL 6; (h) BCI type, n-IL 6, CL 6, BL 7; («), BCS type, n-IL 4, CL 3, BL 3; (j), BE type, n-IL 3, CL 4, BL 4; (k), BI type, n-IL 9, CL 7, BL 9.
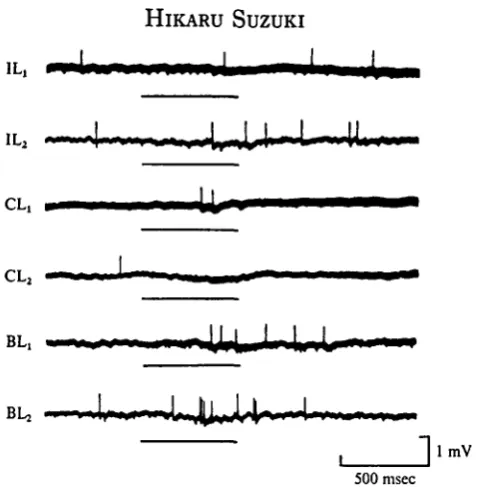
In most cases, input arriving from the contralateral antenna fatigued or habituated faster than that from the ipsilateral antenna. The unit shown in Fig. 3 (BES type) gave an excitatory response to the separate stimulation of each antenna (IL^ CLj). A larger number of impulses were evoked by simultaneous stimulation of both antennae (BLX) than by separate stimulation. A stimulus given about 10 sec after the
first stimulus facilitated the response to the ipsi- and bilateral stimulations (IL2, BL2),
but occluded the response to the contralateral stimulation (CL2). This indicates
that this unit receives excitatory inputs from both antennae, and that the input from the contralateral antenna fatigues or habituates rapidly, whereas the input from the ipsilateral antenna shows facilitation.
16 H I K A R U S U Z U K I
I i __ I
IL,
1L2
CL,
CL2
BL, - I I I
I
l - . L
BL,
I lmV
[image:6.451.114.355.46.290.2]500 msec
Fig. 3. Synaptic properties of the neurones from the antennae arriving at a particular unit (BES type). The unit showed excitatory responses to the stimulation of ipsi- (IL,) and contralateral (CL,) antennae. Simultaneous stimulation of both antennae (BL,) showed summation. Stimuli given about 10 sec after the first stimulus caused increments in response magnitude in the ipsi-lateral (IL2) and bilateral (BLa) antennae but decrements in the contralateral (CLa) antenna.
stimulated simultaneously (BL). This response recovered gradually when bilateral stimuli were repeated at short intervals (about 10 sec). Repetitive stimulation of the ipsilateral antenna caused disappearance of the on-response but not the off-response. These results indicate that this unit receives interacting inputs from both antennae rather than one excitatory and one inhibitory input. Neural models for explanation of the activities of these units will be discussed below.
(B) Location of the units in the brain
Localization of the units in the brain was successful in 72 % (92 units) of the units studied (Table 1). The distribution of the successfully located units is shown in Figs. 5-10. Each shows a frontal and lateral view of the brain, so that the horizontal and vertical position of each unit can be described.
(C) Changes in latency
In some of the excitatory units, the latency of the response when the antennae were stimulated separately changed when both antennae were stimulated simul-taneously. Measurements of the latency of the inhibitory responses were unsuccessful because of the very low frequency of background discharges. Of 46 units studied, 20 showed shorter and 16 showed longer latencies in response to bilateral stimulation than in response to separate stimulation of the antennae (Table 2 a, b). There were 10 units which did not show differences in latency between unilateral and bilateral stimulation. The degree of change in latency differed from unit to unit (Table 2 a).
IL
BL
BL3
IL,
l m V
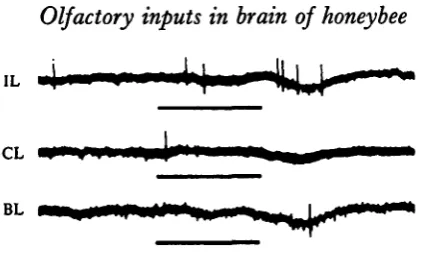
[image:7.451.115.326.44.172.2]500 msec
Fig. 4. Olfactory responses recorded in the brain. The same unit as shown in Fig. 2 (a). This unit showed on—off-response to the stimulation of the ipsilateral antenna (IL), but did not respond to that of the contralateral antenna (CL). This on-off-response was occluded when both antennae were stimulated simultaneously (BL), but reappeared gradually when bilateral stimulations were repeated at about 10 sec interval (BLx, BL2, BL8). On repetitive stimulation
of the ipsilateral antenna, the on-response disappeared but the off-response did not (ILl t IL2).
stimulated simultaneously, and of these, two became shorter (Fig. 11 a) and three became longer (Fig. 11 c). The units of ICI, BLI, CII and BCD types were expected to show longer latencies to bilateral stimulation than to unilateral stimulation, since these units received inhibitory input from the contralateral antenna. Some showed the predicted results, but others did not. For example, the unit shown in Fig. 11(6), which was BCI type, showed a shorter latency to bilateral stimulation than to ipsi-lateral stimulation. The units of IES, BES, CES and BCS types were, on the other hand, expected to show a shorter latency to bilateral stimulation than to unilateral stimulation. But the predicted results were not obtained in all of the units. For example, the unit shown in Fig. 11 (d), which was BES type, showed off- and on-responses to the ipsi- and contralateral stimuli, respectively. Bilateral stimuli evoked an on-off response, but the latencies of both responses were prolonged.
i 8 HIKARU SUZUKI
100//m
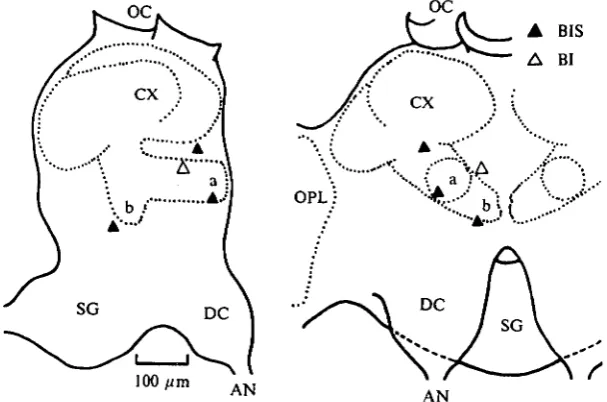
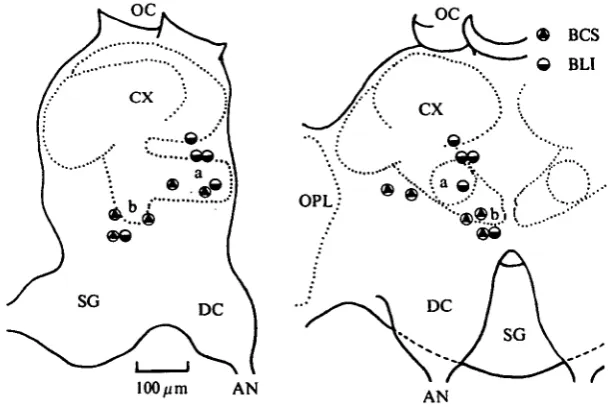
Fig. 5. Recording sites of the units receiving excitatory inputs from both antennae. Frontal (right) and lateral (left) views of the brain are shown side by side. Upper and lower part of the pictures are dorsal and ventral sides of the brain, respectively. Names in each part of the brain are as follows; AN, antennal nerve; a, a-lobe; b, /S-lobe; CX, calyx of the mushroom body; DC, deutocerebrum; OC, ocelli; OPL, optic lobe; SG, suboesophageal ganglion.
OPL
100 n
Fig. 6. Recording sites of the units receiving excitatory and inhibitory inputs from the ipsi-and the contralateral antennae respectively. See legend of Fig. 5.
oc.
100 urn
[image:9.451.72.376.44.267.2]AN
Fig. 7. Recording sites of the units receiving inhibitory and excitatory inputs from the ipsi-and the contralateral antennae respectively. See legend of Fig. 5.
AN AN
Fig. 8. Recording sites of the units receiving inhibitory inputs from both antennae. See legend of Fig. 5.
units located between 100 and 200 micra in depth were distributed mainly in the lateral part of the protocerebrum. The units located in the central commissure showed longer latencies to bilateral stimulation than to unilateral stimulation.
DISCUSSION
[image:9.451.73.377.308.509.2]20 HIKARU SUZUKI
OPL.
y
:-"
r
"&^
a
? \ A ),
100 urn AN
[image:10.451.63.374.62.279.2]AN
Fig. 9. Recording sites of the units receiving inputs from one antenna alone. See legend of Fig. 5.
OC
100 /im AN
V/IV;
Fig. 10. Recording sites of the units included in the complex unit. See legend of Fig. 5.
[image:10.451.68.373.317.520.2]BL BL BL BL BL BL BL BL BL BL BL BL BL BL BL BL BL > BL > BL > BL
Table 2. (a) Changes in latency between unilateral (IL) and
bilateral (BL) stimulation
(Conventions as in Table i) Latency (mean ± s.D.) (n)
Probability P < 005 IL P < 005 IL
P < o-os IL
P < 005 IL
P < o-os IL
P < 0-05 IL
P < 005 IL P < 005 IL P < 005 IL P < 005 IL P < 005 IL P < 005 IL
P < o-os IL
P < 005 IL
P < o-os IL P < o-os IL P < o-os IL P < 0-05 IL
P < 005 IL P < 0-05 IL 01 > P > IL = BL
0-05
P > 010 IL = BL P > 010 IL = BL P > 010 IL = BL P > 010 IL = BL P > 010 IL = BL P > 010 IL = BL 0 1 > P > IL = BL
0-05
P > 010 IL = BL P > 010 IL = BL P < 0-05 IL < P < 0-05 IL < P < 0-05 IL <
P < o-os IL < P < 0-05 IL <
P < 0-05 IL < P < 0-05 IL < P < 0-05 IL < P < 005 IL < P < 0-05 IL < P < 005 IL < P < 0-05 IL < P < 0-05 IL < P < 0-05 IL < P < 0-05 IL < P < 0-05 IL < * Latency of the response evoked by contralateral stimulation.
Mo. 1 2 3 4 5 6 7 8 9 1 0 1 1 1 2 13 14 15 16 17 18 19 2 0 2 1 2 2 2 3 2 4 25 26 2 7 28 2 9 3° 31 3 2 33 3 4 35 36 37 38 39 4 0 41 4 2 43 44 45 46 Response type CES BCD BES BCI ILE BES ICI IES BCS BES BES BES BES BES BES BCS BCI BLI ILE BES
res
ILE ICI IES ILE BES IES BES IES BLI BES BES BCS ICI BES ILE BLI BES BCI BES BES BLI BCS ILE ILE IES IL157-3 ±8-4 (3)* 245 "6 ±26-7 (7) 4808 ±24-9 (6) i3i-9±9'9(8) 444-8±33-9 (7) 2 i i - 9 ± n - 3 (6) 208-3 ±14-0(5) 2973 ±66-6 (6) I 8 I - O ± 14-0 (s) 3Si-9±i6-i Is)
1167 ±4-7 (6) 288-5 ±10-5 (4)
86-3 ±4-9 (7)
126-2 ±6-9 (4) 240-2 ±15-2 (3)
72-3 + 4-0(4) 129-9 ±67(5) 90-1+5-9(4)
'75-9±4-9 (5)
i7o-2±i9-9(7) 233-6 + 40-6(8)
i4i-4±3-2(6) 252-9 ±23-4 (5)
i66-9±8-8(s)
i9i-8±28-7(5)
83-7±4-8(s)
73-2 ±2-1 (4)
72-3 ± 8 7 (4)
I2I-7±22"7(6) 120-9 ±22-9 (4) I6O-O±IO-O (7) 154-7 ±25-9 (4)#
2i9-o±i3-8(4) 304-6 ±25-9 (7) •64-9 ±3-6 (6) 221-2 ± 6 7 (4) 273-8 ±20-0(7)
848 ±13-1 (10) 1009±6-3 (3)
i6o-3±4-7(8)
15°-7 ±9-4(4)
76-3±I-I (3)
io7-9±6-s(8)
H57±ii-o(s) 926±4-3 (6)
8s-4±7'3(8)
1
BL
132-5 ±5-9 (3) 160-3 ±22-3 (7) 420-2 ± 4 9 7 (5) 54-1 ±14-4 (7) 334-9 ±29-0 (8)
i38-9±7-3(7)
158-2 ±17-6 (6) 2O47±i7-6(7) ios-4±i2-i (5) 222-4 ±14-5 (5)
91-4 ± 6-6 (5) 2657±3-6 (5)
6i-s±4-o(4)
15°-4 ±4-6 (4) 157-5 ±9-4 (5) 5i-7±2-o(3) 87-6 ±6-2 (6) 62-9 ±4-5 (6) i5i-o±7-5 (6)
73-6±i3-6(s)
i83-7±2i-2(6)
i43-o±i-6(6) 232-3±i8-8(4)
165-7 ±7-2 (4) 170-0 ± 18-0 (6)
79-3 ±7-8 (3)
72-9 ±3-9 (4) 62-6 ±9-1 (4) io6-8±i4-3(6) 1107 ±14-9 (5) 1968 ±14-1 (5) 259-4 ± 11-7(6) 256-4 ± 14-5 (3) 762-6 ±21-4(5) 185-5 ±13-4 (6)
246-6 ±7-5 (5)
401 -9 ±28-7 (6) i 63- i ± i 5 - 8 ( n )
iS9-4±5-i (3) 203-9 ±17-0 (8) 426-2 ±12-4 (3)
97-5 ± 5 7 (6)
2 2 HIKARU SUZUKI
Table 2. (b) Changes in latency when both antennae were stimulated simultaneously
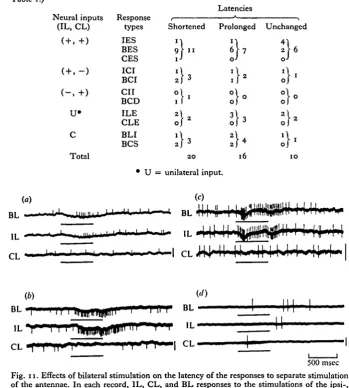
(The latency of the responses to unilateral stimulation were shortened, prolonged, or un-changed by the simultaneous stimulation of both antennae. For abbreviations see legend of Table 1.)
Latencies Neural inputs
(IL, CL)
U*
Total
Response types IES BES CES ICI BCI CII BCD ILE CLE BLI BCS
Shortened Prolonged Unchanged
1-" O-"
!}
!}•
:}
16
• U = unilateral input.
(*)
B L I M M HlllBIIIIWHIlH ' ' 1 R '' BL
[image:12.451.45.395.119.508.2]500 msec Fig. 11. Effects of bilateral stimulation on the latency of the responses to separate stimulation of the antennae. In each record, IL, CL, and BL responses to the stimulations of the ipsi-, contra-, and bilateral antennae respectively, (a) ILE type. Latency (mean±S.D.); BL = 334-9 ±29-0msec (n = 8), IL = 444-8±33-9msec (« = 7), (6) BCI type. Latency; BL = 54-1 + 14-4 msec (n — 7), IL = 131-9 ±9-9 msec (n = 8). (c) ILE type. Latency; BL = 151-3 ± 8-4 msec (n = 7), IL = 92-6 + 4-3 msec (n = 6). (d) BES type. Latency; BL, on-response = 259'4± 11-7 msec (n = 6), off-response = 873-7±20-6 msec (n = 6), IL = 598-5 + 4-7 msec
(n = 9), CL = 154-7 ±25-9 msec (" = 4)- Vertical bars at the right hand of each record indicate 1 mV calibration.
rocj
Fig. 12. Location of the units which showed differences in latency between unilateral and bilateral stimulations. Frontal (right) and lateral (left) views of the brain are shown. Upper, middle, and lower pictures show, respectively, sections from o to 100 micra, from 100 to 200 micra, and more than 200 micra in depth from the frontal surface of the brain. In each lateral view, the regions within the range of the sections are shown by straight lines, and the other regions are shown by dotted lines. Open circles represent the location of the units whose latency to bilateral stimulation was shorter than that to unilateral stimulation. Closed circles represent the location of the units whose latency to bilateral stimulation was longer than that to unilateral stimulation. Names in each part of the brain are as follows; a, a-lobe; b, /?-lobe; CX, calyx of the mushroom body; AN, antennal nerve; DC, deutocerebrum; OC, ocelli; OL, optic lobe; OS, oesophagus; PCL, protocerebral lobe; SG, suboesophageal ganglion.
: :s^ - . . I L
[ > — Excitatory Inhibitory
[image:13.451.123.310.513.614.2]HIKARU SUZUKI
V
• - . - - - - C L|t> Excitatory Inhibitory
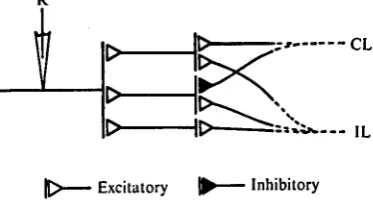
Fig. 14. Neural model which explains the activities of the unit shown in Fig. 4. The recording neurone (R) receives three inputs. Inhibitory input from the contralateral antenna (CL). Input from the ipsilateral antenna (IL) is excitatory. The neurone S receives inhibitory inputs from both antennae and gives a burst of impulses after its inhibition is released. The neurone a evokes an on-response in the recording neurone.
combination of inputs from each antenna. In the case where an inhibitory input arrives from the contralateral antenna, the response of the unit may be of the ICI type. These units appeared to receive a simple combination of neural inputs coming from both antennae. The reactions of the complex unit could not, however, be ex-plained by these simple neural combinations. Interactions of the neurones with each other, and also the differences in the tracts from the primary neurone to the neurone concerned, may contribute to the appearance of these responses. Fig. 13 shows one of the neural models which may be used to explain the response of the unit shown in Fig. zc (BLI type). There are three interneurones giving excitatory effects to the recording neurone; one receives excitatory inputs from both antennae, one receives an excitatory and an inhibitory input from the ipsi- and the contralateral antennae respectively, and one receives an excitatory input from the ipsilateral antenna alone. By the model, the magnitude of the response to the bilateral stimulation is larger than that to the contralateral stimulation, but the response is smaller than that to the ipsilateral stimulation.
Differences in synaptic properties of the neurones from each antenna may influence the functioning of the unit. The unit shown in Fig. 3 receives excitatory inputs from both antennae. Repetitive stimuli of separate antennae caused facilitation in the input from the ipsilateral antenna and habituation or fatigue in the input frbm the contra-lateral antenna. The unit shown in Fig. 4 seemed to receive an excitatory and an inhibitory input from the ipsi- and contralateral antennae respectively. The latency of the on-response to the ipsilateral stimulus was longer than that of the off-response (IL in Fig. 4). This indicates that this unit receives two inputs coming from the ipsilateral antenna, and that a larger number of interneurones are included in the tract evoking on-response than in that evoking off-response. This is also suggested by the disappearance of the on-response when repetitive stimuli were given to the ipsilateral antenna (IL2 in Fig. 4). Inhibitory input from the contralateral antenna
The loci of the units which were affected by inputs from both antennae were de-fined in the protocerebrum. Most of them were found in the protocerebral lobe. The unilateral unit was found in the deuto- and protocerebra (Fig. 8), but the units located in the deutocerebrum responded only to stimulation of the ipsilateral antenna. This has already been shown by Suzuki & Tateda (1974). The neurones connecting both deutocerebra have been reported histologically in some insects (Kenyon, 1896; Jonescu, 1909; Bretschneider, 1913; Power, 1946; Satija, 1958; Goll, 1967; Boeckh, Sandri & Akert, 1970). They run in the central commissure. The units located in the central commissure showed most of the response types. The units included in the unilateral unit were also found in this structure. This shows that some of the neurones in the central commissure receive inputs from both antennae, and that others receive inputs from only one antenna. Since the central commissure consists of fibres, not neuropiles (Boeckh et al. 1970), the role of this structure must be not integration but the conduction of both separate and converged information from the two antennae.
The units located within and around the a-lobe of the mushroom body showed all types of response pattern. These units may correspond to the accessory neurone (Schurmann, 1971), which enters in the stalk and synapses with the fibre of the mush-room body. Most of the units were aggregated around the a-lobe, but the distribution of the units in the regions other than the a-lobe was slightly different from type to type. No particular relationship between the response types and the locations of the units in the brain was found.
No relationship between the changes of latency and the response types was found (Table 26). The units which showed changes in latency were found mostly in the protocerebral lobe, and were rare in the central commissure (Fig. 12). These observa-tions indicate that convergence or divergence of the inputs from both antennae occurs several times on the way from the primary neurone to the neurones in the proto-cerebral lobe. The later the sites of convergence, the greater was the change in latency. The convergence of many neurones, whose inputs were conducted by different pathways from each antenna, and also the differences in the presynaptic properties of the neurone under investigation may have contributed to these phenomena.
Differences in latency between unilateral and bilateral stimuli were observed not only in the units which responded to the stimulation of both antennae, but also in the units which showed ILE type. This indicates that each of these units received inputs arriving from both antennae. But the magnitude of responses in the units showing ILE type did not differ between ipsilateral and bilateral stimulation.The phenomena observed in these cases could be explained if the inputs from the contralateral antenna gave inhibitory effects on the inputs from the ipsilateral antenna.
The author thanks Professor M. Kuwabara and Dr H. Tateda for their valuable advice during this work.
REFERENCES
ADAM, L. J. (1969). Neurophysiologie des Horens und Bioakustik einer Feldheuschrecke (Locusta
migratoria). Z. vergl. Physiol. 63, 227-89.
BOECKH, J., SANDRI, C. & AKERT, K. (1970). Sensorische EingSnge und synaptische Verbindungen in Zentralnervensystem von Insekten. Z. Zellforsch. mikrosk. Anat. 103, 429-46.
BRETSCHNEIDER, F. (1913). Der Centralk6rper und die pilzformigen Korper in Gehirn der Insekten.
26 HIKARU SUZUKI
GOLL, W. (1967). Strukturuntersuchungen am Gehirn von Formica. Z. Morph. Okol. Tiere 5'
143-210.
JONESCU, C. N. (1909). Vergleichende Untersuchungen iiber das Gehirn der Honigbiene. Jena. Z.
Naturto. 45, 111-80.
KENYON, F. C. (1896). The brain of the bee. J. comp. Neurol. 6, 133-210.
MARTIN, H. (1964). Zur Nahorientierung der Biene im Duftfeld, zugleich ein Nachweis fur die Osmo-tropotaxis bei Insekten. Z. vergl. Physiol. 48, 481-533
POWER, M. E. (7946). The antennal centers and their connections within the brain of Drosophila
melanogaster. J. comp. Neurol. 85, 485-509.
STATIJA, R. C. (1958). A histological and experimental study of nervous pathways in the brain and thoracic nerve cord of Locusta migratoria migratorioides (R. & S.). Res. Bull. Panjab Univ. Sci. 137,
13-32-SHORMANN, F. W. (1971). Synaptic contacts of association fibers in the brain of the bee. Brain Res. 26, 169-76.
SUGA, N. & KATSUKI, Y. (1961). Central mechanism of hearing in insect. J. exp. Biol. 38, 545-58. SUZUKI, H. & TATEDA, H. (1974). An electrophysiological study of olfactory interneurones in the brain