THE INTRINSIC PROPERTIES OF AN IN SITU PERFUSED
CROCODILE HEART
CRAIG E. FRANKLIN*
Department of Zoology, University of Queensland, Brisbane 4072, Australia
ANDMICHAEL AXELSSON
Department of Zoophysiology, University of Göteborg, Göteborg, Sweden
Accepted 1 October 1993
Summary
An in situ perfused crocodile (Crocodylus porosus) heart preparation was developed to investigate the effects of input and output pressure on cardiac dynamics and to determine the conditions that lead to a right-to-left cardiac shunt. The pericardium was kept intact, both the left and right atria were perfused and all three outflow tracts (right aortic, left aortic and pulmonary) were cannulated, enabling pressures and flows to be monitored. The perfused heart preparation had an intrinsic heart rate of 34 beats min21and generated
a physiological power output.
Both the left and right sides of the heart were sensitive to filling pressure. Increasing the filling pressure to both atria resulted in an increase in stroke volume and cardiac output (Frank–Starling effect). Increasing the filling pressure to the right atrium also had a positive chronotropic effect. Large right ventricular stroke volumes initiated a right-to-left shunt, despite the left aorta having a pressure 1.5 kPa higher than the pulmonary output pressure.
The left ventricle was able to maintain its output and stroke volume up to an output pressure of approximately 8 kPa. However, the right ventricle was significantly weaker. Right ventricular output and stroke volume showed a marked decrease when the output pressure was increased above 5 kPa.
A right-to-left shunt occurred when pulmonary output pressure was increased. Surprisingly, a shunt occurred into the left aorta before the pressure in the pulmonary artery became greater than that in the left aorta. Once the pressure in the pulmonary artery exceeded the left aortic pressure, pulmonary artery flow ceased and right ventricular output was solely via the left aorta. A right-to-left shunt could also be initiated by increasing the filling pressure to the left atrium.
Introduction
The architecture of the crocodilian heart and associated outflow tracts is complex. In contrast to the rest of the reptiles, the crocodilian heart has anatomically separated right and left ventricles but, compared with the birds and mammals, where only one systemic
*Present address: Gatty Marine Laboratory, University of St Andrews, St Andrews, Fife KY16 8LB, Scotland.
arch has been retained, the left in mammals and the right in birds, both systemic arches are present in the crocodilians. The right systemic arch arises from the left ventricle and the left systemic arch and the pulmonary arterial trunk arise as separate distinct vessels from the right ventricle. Moreover, the systemic arches are connected via the foramen of Panizza, a small aperture found in the inter-aortic septum at the base of the outflow tract, a feature which is uniquely crocodilian. Another connection between the two aortic arches can be found further downstream; it is usually called the ‘anastomosis’. This complex anatomical arrangement of vessels allows for a diverse array of flow patterns. In the undisturbed crocodile, blood flow in the left aorta (LAo) is derived entirely from the right aorta (RAo) via the foramen of Panizza. The circulation pattern is thus essentially the same as in mammals and there is a complete separation of systemic and pulmonary blood flow. However, if resistance in the pulmonary outflow tract is increased and/or systemic blood pressure is reduced, blood is ejected into the LAo from the right ventricle (right-to-left shunt) (Axelsson et al. 1989; Shelton and Jones, 1991).
To date, our understanding of the physiology/functioning of the crocodilian heart is based on in vivo measurements and on speculations drawn from anatomical studies (White, 1956, 1969; Webb, 1979; Grigg and Johansen, 1987; Axelsson et al. 1989, 1991; Grigg, 1989; Shelton and Jones, 1991). In this study, a completely different approach was taken: a perfused heart preparation was developed and used to examine the intrinsic mechanical properties of a crocodilian heart. Perfused heart preparations have been effectively used to study cardiac function in a range of vertebrates, and many different types of preparations have been developed to meet the specific aims of the investigation. However, if the flow and pressure dynamics of the heart (cardiac dynamics) are to be studied, the integrity of the perfused heart preparation is crucial; that is, all chambers of the heart should be perfused, all outflow tracts cannulated and monitored and the pericardium kept intact (see Perry and Farrell, 1989). Furthermore, the cardiac outputs generated by the preparation and filling and output pressures should be similar to those found in vivo. In reptilian studies, the perfused heart preparations that have been used have had only one side of the heart perfused and one outflow tract cannulated (Reeves, 1963a,b; Wasser et al. 1990b; Jackson et al. 1991). These preparations are useful for studying cardiac metabolism but are of little value in understanding cardiac dynamics.
The aim of this study was to examine the effects of filling and output pressures on cardiac dynamics in the crocodile heart. To accomplish this, crocodile hearts were perfused in situ, via the left and right atria, and output cannulae were positioned in the RAo, LAo and the left pulmonary artery (LPA). This preparation enabled us to investigate the sensitivity of the heart to filling pressure (Starling effect), the maintenance of cardiac output/stroke volume with increasing output pressure and the conditions that result in a right-to-left shunt.
Materials and methods
Experimental animals
were transported by light aircraft to the University of Queensland, where they were housed outdoors in a large 4 m diameter fibreglass tank. They were kept in fresh water heated to 30 ˚C and had access to platforms on which they could bask. The animals were fed once a week.
Perfusate composition
The physiological Ringer used to perfuse the crocodile hearts was based on plasma ionic concentrations and blood pH values measured in C. porosus (see Grigg, 1981; Seymour et al. 1985). The Ringer had the following composition (g l21): 6.4 NaCl, 0.3 KCl, 0.41 CaCl2.2H2O, 0.34 MgSO4.7H2O, 0.43 NaH2PO4.2H2O, 2 NaHCO3 and 1 glucose. The Ringer was bubbled with 3 % CO2and 97 % O2 and had a final pH of 7.4–7.5 at 23 ˚C. Adrenaline (adrenaline bitartrate, Sigma Chemicals) was added to the Ringer to a final concentration of 5 nmol l21.
Just prior to perfusing the heart, superfine Sephadex (0.2 g l21) was added to the Ringer. The Ringer was stirred and gassed continuously, preventing the Sephadex from settling out and resulting in a homogeneous suspension. The Sephadex particles permitted the perfusate to be monitored by a Doppler flow system. In initial experiments, we found no difference in the performance of the heart, with or without the Sephadex. The Sephadex beads were 10–40mm in diameter, which compares favourably with the size of the blood cells in C. porosus (approximately 40mm in diameter, see Grigg and Cairncross, 1980).
Surgical protocol
The crocodile was then decapitated and the tail cut off, and the body region with the
in situ perfused heart transferred and submerged in a preparation bath filled with
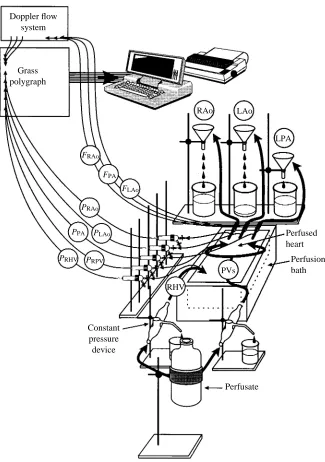
physiological saline at 23 ˚C. The input cannulae (right and left pulmonary veins and hepatic vein) were connected to constant-pressure devices (see Farrell et al. 1982) that could be raised or lowered to effect a change in the filling pressures to either the left or right atrium. The filling pressures to the left and right atria could be adjusted independently. The three output cannulae (right and left aortas and pulmonary artery) were then connected to separate pressure heads that were adjustable and which set the diastolic output pressure for each outflow tract (see Fig. 2). There was no noticeable leakage of perfusate into the saline bath from the heart preparation.
The coronary system in the crocodile heart starts at the base of the right aortic outflow tract, so, as a consequence of perfusing the heart, the coronary system was also perfused.
Instrumentation
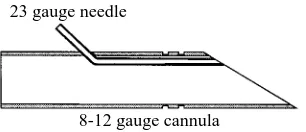
The stainless-steel cannulae used in the preparation had 23 gauge (0.6 mm) needle tubing running along the inside wall and opening at the tip of the cannula (Fig. 1). Pressures were recorded via the 23 gauge (0.6 mm) needle using saline-filled polyethylene tubing connected to Statham pressure transducers (P23XL). Thus, the pressures recorded were a direct measure of the pressure within the vessel or chamber and did not require correction for cannula resistance. Pressures were referenced to the level of the saline in the preparation bath in which the heart preparation was fully immersed. Five pressures were recorded: right and left atrial pressures, right and left aortic pressures and pulmonary artery pressure (see Fig. 2). Flows in the left and right aortas and pulmonary artery were recorded using a Doppler flow system (University of Iowa, Bioengineering, model 545C-4). Extracorporeal flow probes (Titronics Medical Instruments) were inserted into the output tubing approximately 10 cm from the stainless-steel cannulae. The pressure transducers and flow probes were calibrated daily, and the zero for the pressures was checked several times during each experiment. Fig. 2 shows the experimental set-up we used to perfuse and monitor the in situ crocodile heart preparation.
Pressure and flow signals were amplified and displayed on a chart recorder (Grass Polygraph model 7). The flow signals were electrically dampened in the Doppler flow system and the various pressure signals were recorded undampened on the chart recorder; further averaging was performed on-line in the computer. Heart rate was derived from the right aortic pressure signals via a Grass 7P44 tachograph unit. In addition to the Grass
23 gauge needle
[image:4.595.226.379.620.686.2]8-12 gauge cannula
polygraph recordings, a data-acquisition software package (AD/DATA; P. Thorén, Hässle AB, Sweden) was used and all data were fed into a Toshiba computer (model T5200). The sampling frequency was set to 10 samples s21and on-line mean values were calculated over 5 s periods. The digital display provided by the computer allowed us to set
Doppler flow system
Grass polygraph
Constant pressure device
Perfusate
Perfusion bath Perfused heart RAo
RHV
LAo
LPA
FRAo
PRAo
PRHV
FPA
PPA
PVs
PRPV
FLAo
[image:5.595.131.456.203.665.2]PLAo
input and output pressures accurately and to set flows to predetermined values dictated by our experimental protocol. Data were stored on disk for later analysis.
Terminology
Cardiac output is traditionally defined in mammalian hearts as the volume of blood pumped by the left ventricle into the systemic circulation. However, the anatomy of the crocodilian heart, with the left aorta arising from the right ventricle and connected to the right aorta via the foramen of Panizza, makes defining cardiac output more difficult as right ventricular blood can be shunted into the systemic circulation via the foramen. For the purpose of this paper, the flow in the right aortic cannula will constitute left ventricular output (the carotid and subclavian arteries were ligated; hence, flow that would have been in these vessels is directed into the right aortic cannula), and the combined flow in the left aortic and pulmonary cannulae will constitute right ventricular output. We have made the assumption that foramen flow into the LAo from the RAo was nil, which was the case under control conditions. Total cardiac output is defined as the sum of the flow in the LAo, RAo and PA; this represents the total volume of perfusate being pumped by the heart.
Experimental protocol
Control conditions
The left and right ventricles were each set to deliver a flow of approximately 20 ml min21kg21body mass (i.e. a total cardiac output for the heart of 40 ml min21kg21body mass) against a mean output pressure of 3.5 kPa for the RAo and the LAo and 2.0 kPa for the pulmonary artery (PA). The ventricular outputs were set by raising or lowering the filling (input) pressures to the left and right atria, which subsequently increased or decreased the stroke volumes in the respective ventricle.
Heart rate was determined by the intrinsic rate of the sino-atrial pacemaker and by the adrenergic stimulus provided by the 5 nmol l21adrenaline present in the perfusate. The preparation was allowed to settle under these conditions until stable values for the recorded variables were reached (usually about 5 min) before the following responses were tested.
Response to filling pressures: Starling curves
With the output pressures kept constant at control levels, the filling pressures applied to both atria were dropped to zero or slightly subambient pressures. As soon as flow in all output vessels had stopped, the filling pressures were increased by approximately 0.05 kPa and the new ventricular outputs were allowed to stabilise. The filling pressures were then increased in further steps of 0.08–0.1 kPa to a maximum of 0.8 kPa (8–10 steps). After each pressure increment, a stable reading on the computer of ventricular output was required before the filling pressure was increased further. The end point was reached when an increase in filling pressure no longer augmented ventricular output. This point was deemed the maximum ventricular output.
was performed. The filling pressure was increased first in the right atrium while that in the left atrium was kept constant, and then the filling pressure was increased in the left atrium while the right atrium’s filling pressure was kept constant.
Response to output pressure
After testing the response of the heart to filling pressure, the heart was returned to work under the control settings for 2–3 min or until stable values for the various variables had been obtained before its response to output pressure was tested. Changing the pressures against which the heart pumped was performed to meet two major aims: (1) to investigate the ability of the left and right ventricles to maintain flow with increasing output pressure and (2) to investigate the conditions that lead to the right-to-left shunt (i.e. the shunting of perfusate from the PA to the LAo).
The left ventricle was challenged first by increasing the pressure in both the RAo and LAo in steps of 0.5–1.0 kPa. At each pressure increment, the flow was allowed to stabilise to its new rate before the pressure was increased further. The left side of the heart was tested to a maximum of 10.5 kPa. During this challenge, the right ventricle was exposed to the control output pressure of 2 kPa (this corresponds to the pressure in the PA, as all the output from the right ventricle was via the PA; there was no shunting to the LAo).
To test the right side of the heart, the PA pressure was increased in increments of 0.5–1 kPa until the flow had been completely shunted into the LAo. At this point, the LAo and RAo pressures were increased in similar steps to a maximum of 8.5 kPa. During this phase, the pulmonary pressure was kept above the RAo/LAo pressure to prevent the perfusate from being redirected back into the pulmonary cannula.
Flow through the foramen of Panizza was investigated in one animal by first clamping the PA, thus shunting the perfusate into the LAo, and then clamping the LAo.
Histology of the ventricle
Upon the completion of the protocols, the heart was removed from the body of the crocodile, excess water was blotted off and the various chambers of the heart were weighed. Some hearts were fixed in 3 % formaldehyde in 0.9 % NaCl. Three of these hearts had their ventricular compact and spongy myocardial layers separated from each other and weighed to determine their percentages. The rest of the fixed hearts were dehydrated through an alcohol series and embedded in paraffin wax. 8mm sections were cut and stained with Mallory’s triple stain. The coronary circulation to the myocardium was studied, in particular noting the differences in supply to the left and right sides of the heart.
Data analysis and calculations
body mass. Flows from the left and right sides of the heart were combined to give total cardiac output. Cardiac power output was also calculated for each side of the heart and for the whole heart. Cardiac power outputs were calculated using the following equations:
Left ventricular power output (mW) = [(PRAo2PLungV) 3FRAo] 30.0167 , (A)
Right ventricular power output (mW) = [(PPA2PVCava) 3FPA] 30.0167 + [(PLAo2PLungV) 3FLAo] 30.0167 , (B)
Total cardiac power output (mW) = A + B ,
where FRAois flow in the RAo (ml min21), FLAois flow in the LAo (ml min21), FPAis flow in the PA (ml min21), PRAois pressure in the RAo (kPa), PLAois pressure in the LAo (kPa), PPAis pressure in the PA (kPa), PVCavais pressure in the vena cava (kPa), PLungVis pressure in the lung veins (kPa) and 0.0167 is the conversion factor to calculate power in milliwatts.
Cardiac power output for the whole heart was normalised per gram heart mass. However, as the mass for each side of the heart could not be measured accurately, the power outputs for the left and right ventricles were normalised per kilogram body mass.
For each preparation, fH, VS, flow and power output for each ventricle were plotted against filling pressure (preload graphs) and output pressure (afterload graphs). Curves were fitted to the data using a third-order polynomial. The correlation coefficient was always greater than 0.97, which meant a highly significant curve fit was obtained (P<0.01, N=6–10 data points). The graphs from the individual preparations could not be directly combined as input and output pressures were never completely the same between preparations. To overcome this problem, we used the polynomial equations to generate data at set pressure intervals. For the preload curves, data points were calculated in 0.05 kPa steps and for the afterload curves in 0.5 kPa steps. We were then able to combine the data from the different preparations to produce composite graphs.
Data are presented as means ±S.E.M. and statistical comparisons were made using the Wilcoxon matched-pairs signed-rank test. Differences where P<0.05 were regarded as statistically significant.
Results
Cardiac morphology
Intrinsic properties of the heart preparation
Table 2 summarises the physiological performance data obtained from the heart preparation. Heart rate varied between preparations (28.5–42.5 beats min21). The heart preparation had an intrinsic heart rate of 33.8±2.0 beats min21 when working at 20 ml min21kg21body mass and at an adrenaline concentration of 5 nmol l21 in the perfusate. The heart rate remained stable throughout the duration of the experiments, with only small variations due to changes in the right atrium filling pressure.
Response to filling pressure
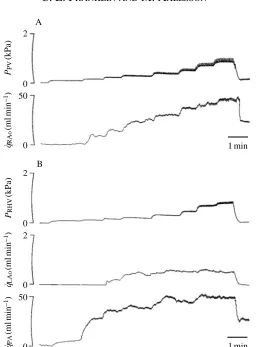
Increasing the filling pressure to the left atria, via the pulmonary veins, resulted in a significant increase in RAo flow, which was due chiefly to an increase in VS(Figs 3A, 4B,C). Left ventricular VSincreased sixfold as input pressure was increased from 0.1 to 0.5 kPa. This range of input pressures represented the most sensitive range for altering
[image:9.595.111.481.151.288.2]VS(Fig. 4B). Increases in filling pressure above 0.7 kPa had no significant effect on VS and RAo flow. The maximum values of left ventricular output and VS were 39.5±2.3 ml min21kg21body mass and 1.18±0.09 ml kg21body mass, respectively. As left ventricular output increased against a constant output pressure in the RAo (3.5 kPa),
Table 1. Heart morphometric data for Crocodylus porosus
Body mass (kg) 1.09±0.07 (7)
Heart mass (g) 3.05±0.21 (7)
Relative heart mass (%) 0.279±0.012 (7)
Relative ventricle mass (%) 0.232±0.009 (7)
Relative atrial mass (%) 0.048±0.004 (7)
Compact myocardium (%) 42.3±5.9 (3)
Spongy myocardium (%) 57.7±5.9 (3)
Data are presented as means ±S.E.M. (N).
The relative masses are expressed as a percentage of body mass. The outflow tract was removed from the heart before weighing.
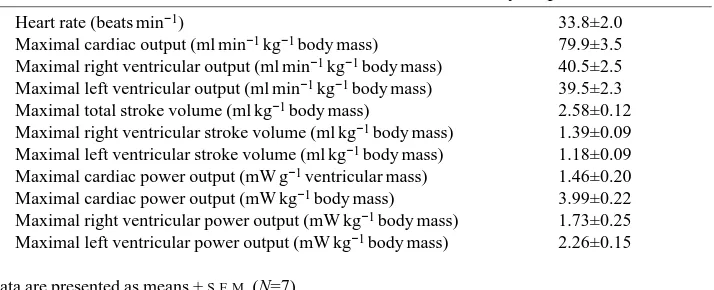
Table 2. Cardiovascular measurements from Crocodylus porosus
Heart rate (beats min−1) 33.8±2.0
Maximal cardiac output (ml min−1kg−1body mass) 79.9±3.5
Maximal right ventricular output (ml min−1kg−1body mass) 40.5±2.5
Maximal left ventricular output (ml min−1kg−1body mass) 39.5±2.3
Maximal total stroke volume (ml kg−1body mass) 2.58±0.12
Maximal right ventricular stroke volume (ml kg−1body mass) 1.39±0.09
Maximal left ventricular stroke volume (ml kg−1body mass) 1.18±0.09
Maximal cardiac power output (mW g−1ventricular mass) 1.46±0.20
Maximal cardiac power output (mW kg−1body mass) 3.99±0.22
Maximal right ventricular power output (mW kg−1body mass) 1.73±0.25
Maximal left ventricular power output (mW kg−1body mass) 2.26±0.15
[image:9.595.124.481.565.710.2]the power output of the left ventricle increased to a maximum of 1.56±0.19 mW kg21body mass (Fig. 4D).
Increasing the filling pressure to the right atria, via the hepatic vein, significantly increased right ventricular output and VS(Figs 3B, 4B,C). The right side of the heart was significantly more sensitive to filling pressure than the left side of the heart. For example, at an equivalent filling pressure of 0.2 kPa, the right ventricular output and VSwere almost double those of the left ventricle (Fig. 4B). The increase in right ventricular output was a result of both PA and LAo flow. Cardiac outputs below about 20 ml min21kg21body mass were solely due to PA flow. It was at higher cardiac outputs that flow occurred in the LAo (Figs 3B, 4C); this despite the LAo output pressure being 1.5 kPa greater than the PA pressure.
The maximum total cardiac output for the heart preparation was 79.9±3.5 ml min21kg21 and left and right ventricles contributed equally to this output
2
50 0
0 1 min
PPV
(kPa)
q˙RAo
(ml
min
−
1)
A
B
q˙PA
(ml
min
−
1)
2
2
50
q˙LAo
(ml
min
−
1)
0
0
0
PRHV
(kPa)
[image:10.595.175.431.131.478.2]1 min
Fig. 3. Recordings of the effect of (A) increasing the filling pressure in the pulmonary veins
(PPV) on the flow in the right aorta (q˙RAo) and (B) increasing the filling pressure in the right
(Table 2). The maximum right ventricular output was 40.5±2.5 ml min21 kg21body mass, which was not significantly different from the maximum left ventricular output (39.5±2.3 ml min21kg21, Table 2). Likewise, the maximum right and left ventricular VSvalues were not significantly different from each other. The power outputs for the two sides of the heart were different, however, as a result of the left ventricle working against a higher output pressure (Fig. 4D). The pressure in the PA was only 2 kPa compared with 3.5 kPa in the RAo.
*
*
40
35
30
25
0.3 1.5
1.2
0.9
0.6
0.0
50
40
30
20
10
0
2.5
2.0
1.5
1.0
0.5
0.0
fH
(beats
min
−
1)
V
S
(ml
kg
−
1)
Flow (ml
min
−
1kg
−
1)
Power output (mW
kg
−
1)
B
C
D A
0.0 0.2 0.4 0.6 0.8
[image:11.595.201.387.140.530.2]Input pressure (kPa)
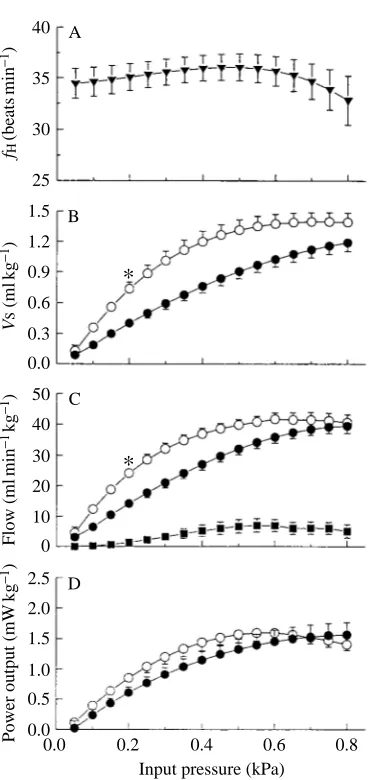
Fig. 4. The effects of increasing filling pressure in the pulmonary veins (i.e. left atrium) and right hepatic vein (right atrium) on cardiac performance. Output pressures were 3.5kPa for the left and
right aorta and 2.0 kPa for the pulmonary artery. (A) Heart rate (fH); (B) stroke volume (VS) of the
left and right ventricles; (C) flow of perfusate from the right and left ventricles and from the left
aorta; (D) power output from the left and right ventricles (sright ventricle; dleft ventricle; jleft
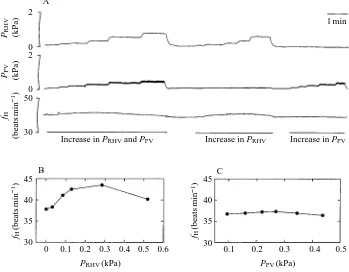
Increasing filling pressure from 0 to 0.5 kPa caused an increase in stroke volume and also an increase in heart rate in six of the seven preparations (Fig. 5A–C). The average increase in heart rate was 4.5 % (from 34.5 to 36.1 beats min21). If the filling pressure was simultaneously increased to both sides of the heart, then an elevation in heart rate occurred (Fig. 5A). An increase in filling pressure to the right atrium resulted in an increase in heart rate (Fig. 5B); however, there was no increase in heart rate when filling pressure was increased in the left atrium (Fig. 5C).
Response to output pressure
Increasing RAo pressure only slightly reduced left ventricular output and VSover the output pressure range tested. It was only when the RAo pressure was increased above 8 kPa that a more marked decrease in left ventricular output and VSoccurred (Fig. 6B,C). Heart rate was not affected by RAo pressure (Fig. 6A). As RAo pressure increased, left ventricular power output also increased to a maximum of 2.26±0.15 mW kg21body mass at an output pressure of 9.5 kPa and remained at about this level as the RAo pressure was
45
40
35
30
45
40
35
30 2
0 2
0 50
30
B C
A
0 0.1 0.2 0.3 0.4 0.5 0.6 0.1 0.2 0.3 0.4 0.5
Increase in PRHVand PPV Increase in PRHV Increase in PPV
fH
(beats
min
−
1)
fH
(beats
min
−
1)
fH
(beats
min
−
1) PRHV (kPa)
PPV(kPa)
PPV (kPa)
PRHV(kPa)
[image:12.595.124.473.363.635.2]1 min
Fig. 5. The effect of filling pressure in the pulmonary veins (i.e. left atrium) and right hepatic
vein (i.e. right atrium) on heart rate. (A) Recordings of right hepatic vein pressure (PRHV),
pulmonary vein pressure (PPV) and heart rate (fH). Heart rate increased when both pressures
elevated to 10.5 kPa (Fig. 6D). The right ventricle was subjected to an output pressure challenge by first raising the PA pressure and then the LAo pressure. Heart rate was not affected by an increase in output pressure to the right ventricle. Right ventricular stroke volume and flow did not change significantly until the output pressure was increased above 5 kPa, after which they both significantly decreased (Fig. 6B,C). With regard to maintaining ventricular output and VS against an output pressure challenge, the right
*
*
40 35 30 25 0.6 1.0 0.8 0.4 0.2 0.0 30 30 20 10 0 20 25 10 15 0 5 2.5 2.0 1.5 1.0 0.5 0.0 fH (beats min − 1) V S (ml k g − 1) Flow (ml min − 1kg − 1)Power output (mW
kg − 1) B C D A
Output pressure (kPa) 2
2 4 6 8 10
[image:13.595.205.388.246.621.2]4 6 8 10
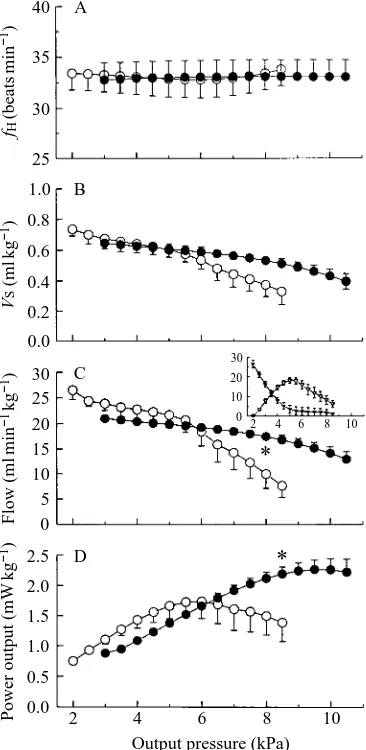
Fig. 6. The effect of increasing the output pressure to the left ventricle (increase in right aortic pressure) and to the right ventricle (increase in pulmonary artery pressure followed by an
increase in left aortic pressure) on cardiac performance. (A) Heart rate (fH). (B) Stroke volume
(VS) for the left ventricle (d) and right ventricle (s). (C) Flow of perfusate from the left
ventricle (d) and right ventricle (s). Inset: the flow in the pulmonary artery (.) and left aorta
(,) (ordinate and abscissa labels as in C). (D) Power output in the left ventricle (d) and right
ventricle (s). * indicates a significant difference between the left and right ventricles (P<0.05,
ventricle was significantly weaker than the left ventricle (Fig. 6B,C; Table 2). The output pressure which could be maintained without a significant decrease in cardiac output for the left ventricle was 8 kPa, whereas it was only 5 kPa for the right ventricle. Right ventricular power output increased to a maximum of 1.73±0.25 mW kg21body mass, which is significantly lower than that of the left ventricle (Table 2).
The right ventricular output and VSdynamics were determined by flows in the PA and LAo (see Fig. 6C inset). Increasing PA pressure to 3.0 kPa caused a significant shunting of perfusate into the LAo. Shunting occurred even though the LAo pressure (3.5 kPa) was greater than the PA pressure. Once the pressure in PA exceeded LAo pressure, PA flow
PPA
(kPa)
PRAo
(kPa)
q˙RAo
(ml
min
−
1)
q˙LAo
(ml
min
−
1)
q˙PA
(ml
min
−
1)
50
0
50
0
50
0
10
0
10
0 1 min
LAo clamped
PA clamped
LAo released qForamen 4.8 22.2 (ml min−1)
[image:14.595.181.420.280.643.2]RForamen 2.6 88.7 (Pa min ml−1)
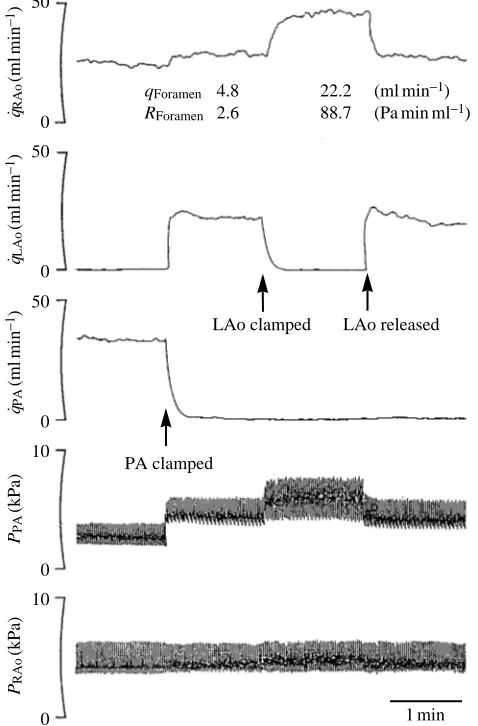
Fig. 7. Effect of occlusion of the pulmonary artery followed by occlusion of the left aorta on
flow in the right aorta (q˙RAo), left aorta (q˙LAo) and pulmonary artery (q˙PA) and on the pressure
in the right aorta (PRAo) and pulmonary artery (PPA). The increase in flow in the right aorta
after the pulmonary artery and left aorta had been clamped is due to flow through the foramen
of Panizza. Foramen flow (q˙Foramen) and the resistance of the foramen (RForamen) are presented
ceased and right ventricular output was attributed solely to LAo flow. Shunting of perfusate from the PA to the LAo did not significantly decrease the right ventricular output. That is, the initial flow in the PA was not significantly different from the flow in the LAo once PA flow had ceased.
Fig. 7 shows recordings of the effect of clamping the PA and LAo on the flow dynamics in the RAo, LAo and PA. Clamping the PA shunted the blood into the LAo. A small foramen flow of 4.8 ml min21 from the LAo to the RAo resulted from the PA occlusion. Clamping both the PA and LAo resulted in the output from the right ventricle being shunted through the foramen of Panizza and into the RAo. A foramen flow of 22.2 ml min21was recorded; this is approximately the same as the flow recorded in the LAo. The foramen had a resistance of 88.7 Pa min ml21at this flow rate compared with a resistance of 2.6 Pa min ml21at 4.8 ml min21.
Discussion
The heart mass relative to body mass of C. porosus was 3.05 g kg21body mass This is similar to the relative heart masses recorded for snakes (3.1 g kg21; Poupa and Lindstrom, 1983) and the lizard Amphibolurus vitticeps (2.85 g kg21; Else and Hulbert, 1983), but considerably greater than the heart mass of the tortoise Emydura signata (1.6 g kg21; C. E. Franklin, unpublished observations). Among the fishes, the relative ventricle mass is greater in the more active species, such as yellowfin and skipjack tuna, than in sluggish fish, such as the sea raven (Farrell, 1991). A similar relationship with respect to athleticism may also occur among the reptiles. Poupa and Lindstrom (1983) found that a large variation in relative heart mass occurred among the snakes, with the tree snake
Dispholidus typus having a very high heart mass (4.5 g kg21). They proposed that this may be related to the active and fighting prey they consume, which would reflect their athleticism.
In situ perfused heart preparation
the pericardium has been shown to have a detrimental effect on cardiac performance in a range of vertebrates (Janicki and Weber, 1980; Farrell et al. 1988; Franklin and Davie 1991, 1993). The main disadvantage with previous isolated reptile heart preparations is that there was only one input and one output; therefore, cardiac outputs are very unlikely to reach physiological levels. A key feature of the in situ crocodile heart preparation is that it produced cardiac outputs (determined from the three outflow tracts) that were similar to those recorded in vivo (Shelton and Jones, 1991) and these flows were generated at physiological output pressures. Perry and Farrell (1989) stress that perfused heart preparations must work at physiological pressures and cardiac outputs if the results are to be meaningful, especially if the flow and pressure dynamics of the heart are being investigated.
The coronary circulation, which arises from the base of the RAo outflow tract, was perfused as a result of heart perfusion. Transverse sections of heart tissue revealed a coronary circulation that was devoid of red blood cells. The extent of perfusion and the flow rate in the coronary vessels were, however, not established. The high PO∑ of the Ringer would have assisted in oxygenating the compact myocardium directly via the lumen of the heart, thus helping to offset the possibility that the compact myocardium was not effectively oxygenated by the coronary system.
The perfused heart preparation had a stable and intrinsic heart rate of 34 beats min21. Wright et al. (1992) recorded in vivo a mean heart rate of 23.5 beats min21from resting
C. porosus at 25 ˚C. The lack of an inhibitory vagal tone in the perfused heart preparation,
as a result of the vagus being cut, could account for the higher heart rate.
The effect of filling pressure
The perfused crocodile heart relied on positive filling pressures to generate physiological cardiac outputs (vis-a-tergo filling). If the filling pressures to the left and right atria were reduced to below ambient, flow in all vessels ceased. Vis-a-fronte filling (suctional filling) of the atria does not appear to function in the crocodile heart, unlike the hearts of some fishes, such as dogfish, trout and tuna (see Farrell, 1991). The heart preparation was exposed to filling pressures ranging from approximately 0 to 0.8 kPa.
The perfused crocodile heart responded to an increase in filling pressure by increasing stroke volume, as predicted by the Frank–Starling mechanism. This positive relationship between filling pressure and stroke volume has also been found in the hearts of fishes, turtles and mammals (Reeves, 1963a,b; Farrell, 1991; Strobeck and Sonnenblick, 1986). Only low filling pressures were needed to stimulate the heart to produce a physiological cardiac output. Furthermore, small changes in filling pressure resulted in large changes in stroke volume; i.e. the heart was very sensitive to filling pressure. The right side of the heart was more sensitive to filling pressure than the left.
In vivo measurements of venous pressures in crocodiles have not been made, although
preparations are apparently physiological and the marked Starling response operated within this physiological range. However, the role venous pressure plays in determining stroke volume in vivo remains to be established, although the intrinsic mechanism exists in the crocodile heart to augment stroke volume several-fold via the Starling response.
Increasing filling pressure not only elevated stroke volume but also initiated a right-to-left shunt. A significant flow was recorded in the LAo, despite this outflow tract having an output pressure 1.5 kPa greater than the PA outflow tract. The functional basis of the Starling response is that the force of contraction increases with the length of the muscle fibre (although beyond a certain sarcomere length, force of contraction decreases, see Lakatta, 1986). Presumably, as stroke volume increased with greater filling pressure, the force of contraction also increased until the right intra-ventricular pressure exceeded the pressure in the LAo and a shunt resulted. Shelton and Jones (1991) proposed that shunting could result from increasing the right ventricular fibre length by increased filling pressure. Our results support this hypothesis.
Filling pressure also had a chronotropic effect. Increasing filling pressure to the right atrium increased heart rate, whereas an increase in left atrial pressure failed to increase heart rate. It appears that increases in right atrial filling pressure are stimulating the sinoatrial pacemaker to cycle (discharge) at a higher frequency. Heart rate also increases with filling pressure in mammals, but not in trout heart preparations in situ (see Perry and Farrell, 1988).
Effect of output pressures
The left ventricle was relatively insensitive to output pressure (in the RAo) and was intrinsically capable of maintaining left ventricular stroke volume up to an output pressure of approximately 8 kPa. The right ventricle was significantly weaker, only maintaining stroke volume up to an output pressure (in PA and LAo) of 5 kPa. This marked difference between the systemic and pulmonary circulations is characteristic of mammalian hearts also. Ventricular wall thickness is considerably greater in the left than in the right ventricle and would account for the difference in maintaining stroke volume.
Right-to-left shunts
Right-to-left shunts have been recorded in vivo in crocodiles during diving and after intravenous injections of acetylcholine (Grigg and Johansen, 1987; Axelsson et al. 1989). After acetylcholine injections, Axelsson et al. (1989) found that pulmonary resistance increased and blood was shunted into the LAo. White (1969) noticed that during forced dives there was an increase in the resistance of the pulmonary circuit. The shunting of blood into the LAo is generally associated with an increase in pulmonary resistance or, as proposed by Shelton and Jones (1991), a decrease in systemic blood pressure. In both cases, it is assumed that the blood travels along the path of least resistance (lower pressure).
intra-ventricular pressures greater than systemic (LAo) pressure. With a shunt operating, the systemic circulation would receive a larger contribution of blood which, in turn, would increase the central venous pressure. Thus, it would be possible to have a shunt without a change in systemic or pulmonary pressure, the shunt being mediated by changes in systemic venous pressure initiating a Frank–Starling response.
Flow through the foramen of Panizza
Under our control conditions in the in situ perfused heart, no flow occurred in the LAo. This is contrary to resting conditions in vivo in the crocodilians, where LAo flow accounts for approximately 1–3 % of total cardiac output and is due to flow through the foramen of Panizza; i.e. from the right aorta to the left aorta (Axelsson et al. 1989; Shelton and Jones, 1991). LAo pressure was the same as RAo pressure; thus, the additional resistance the foramen of Panizza incurs would inhibit flow in the LAo. However, flow through the foramen of Panizza from the RAo to the LAo did occur when LAo pressure was marginally lower than RAo pressure.
Grigg (1989) proposed that a reverse foramen flow (flow from the LAo to RAo) might be possible if the pulmonary perfusion ceased altogether. In this scenario, if the pulmonary perfusion was stopped, no blood would return to the left ventricle and the systemic circulation would be driven by the right ventricle, cardiac output occurring in the LAo and RAo. As shown in Fig. 7, this hypothetical pathway suggested by Grigg can occur, although its relevance or whether it actually occurs in vivo is yet to be determined. In summary, the cardiac dynamics of the crocodile heart is perhaps the most complex of all vertebrates. Distribution of the cardiac output between the three outflow tracts shows that extreme flexibility and a range of completely different flow patterns and regulatory mechanisms exist. The in situ perfused crocodile heart preparation gives an insight into the cardiovascular possibilities which could occur in vivo and which remain to be substantiated or disproved in the future.
This work was performed in Gordon Grigg’s Physiological Ecology Laboratory at the University of Queensland. We offer our sincere thanks to Gordon for providing us with the facilities and encouragement to do this work. Crocodiles were obtained from the Edward River Crocodile Farm, Pty Ltd, and thanks go to Victor Onions and Don Morris. C.E.F. was a University of Queensland Postdoctoral Fellow at the time of this study. M.A. received a travel grant from Wennergren Centre Foundation for Scientific Research.
References
AXELSSON, M., FRITSCHE, R., HOLMGREN, S., GROVE, D. J. ANDNILSSON, S. (1991). Gut blood flow in the estuarine crocodile, Crocodylus porosus. Acta physiol. scand. 142, 509–516.
AXELSSON, M., HOLM, S. AND NILSSON, S. (1989). Flow dynamics of the crocodilian heart. Am. J.
Physiol. 256, R875–R879.
BURGGREN, W. W. (1987). Form and function in reptilian circulations. Am. Zool. 27, 2–19.
ELSE, P. L. ANDHULBERT, A. J. (1983). A comparative study of the metabolic capacity of hearts from
FARRELL, A. P. (1991). From hagfish to tuna: a perspective on cardiac function in fish. Physiol. Zool. 64, 1137–1164.
FARRELL, A. P., JOHANSEN, J. A. ANDGRAHAM, M. S. (1988). The role of the pericardium in cardiac performance of the trout (Salmo gairdneri). Physiol. Zool. 61, 213–221.
FARRELL, A. P., MACLEOD, K. R. ANDCHANCEY, B. (1986). Intrinsic mechanical properties of the perfused rainbow trout heart and the effects of catecholamines and extracelluar calcium under control and acidotic conditions. J. exp. Biol. 125, 319–345.
FARRELL, A. P., MACLEOD, K. R. ANDDRIEDZIC, W. R. (1982). The effects of preload, after load and epinephrine on cardiac performance in the sea raven, Hemitripterus americanus. Can. J. Zool. 60, 3165–3171.
FRANKLIN, C. E. ANDDAVIE, P. S. (1991). The pericardium facilitates pressure work in the eel heart. J. Fish Biol. 39, 559–564.
FRANKLIN, C. E. ANDDAVIE, P. S. (1993). The role of the pericardium in the dogfish, Squalus acanthias. J. Fish Biol. (in press).
GRIGG, G. C. (1981). Plasma homeostasis and cloacal urine composition in Crocodylus porosus caught
along a salinity gradient. J. comp. Physiol. 144, 261–270.
GRIGG, G. C. (1989). The heart and patterns of cardiac outflow in Crocodilia. Proc. Aust. physiol.
pharmac. Soc. 20, 43–57.
GRIGG, G. C. ANDCAIRNCROSS, M. (1980). Respiratory properties of the blood of Crocodylus porosus.
Respir. Physiol. 41, 367–380.
GRIGG, G. C. ANDJOHANSEN, K. (1987). Cardiovascular dynamics in Crocodylus porosus breathing air
and during voluntary aerobic dives. J. comp. Physiol. B 157, 381–392.
HOULIHAN, D. F., AGNISOLA, C., HAMILTON, N. M. ANDGENOINO, I. T. (1987). Oxygen consumption of the isolated heart of Octopus: effects of power output and hypoxia. J. exp. Biol. 131, 137–157. JACKSON, D. C., ARENDT, E. A., INMAM, K. C., LAWLER, R. G., PANOL, G. ANDWASSER, J. S. (1991). 31
P-NMR study of normoxic and anoxic perfused turtle heart during graded CO2and lactic acidosis. Am.
J. Physiol. 260, R1130–R1136.
JANICKI, J. S. ANDWEBER, K. T. (1980). The pericardium and ventricular interaction, distensibility and function. Am. J. Physiol. 238, H494–H503.
JOHANSEN, K. ANDBURGGREN, W. W. (1984). Venosus return and cardiac filling in varanid lizards. J. exp. Biol. 113, 389–399.
LAKATTA, E. G. (1986). Length modulation of muscle performance: Frank–Starling law of the heart. In The Heart and Cardiovascular System (ed. H. A. Fozzard, E. Haber, R. B. Jennings, A. M. Katz and H. E. Morgan), pp. 819–842. New York: Raven Press.
PERRY, S. F. ANDFARRELL, A. P. (1989). Perfusion preparations in comparative respiratory physiology.
In Techniques in Comparative Respiratory Physiology: An Experimental Approach (ed. C. R. Bridges and P. J. Butler). Soc. exp. Biol. Seminar Ser. 37, 223–257.
POUPA, O. ANDLINDSTROM, L. (1983). Comparative and scaling aspects of heart and body weights with
reference to blood supply of cardiac fibres. Comp. Biochem. Physiol. 76A, 413–421.
REEVES, R. B. (1963a). Energy cost of work in aerobic and anaerobic turtle heart muscle. Am. J. Physiol. 205, 17–22.
REEVES, R. B. (1963b). Control of glycogen utilisation and glucose uptake in the anaerobic turtle heart. Am. J. Physiol. 205, 23–29.
SEYMOUR, R. S., BENNETT, A. F. ANDBRADFORD, D. F. (1985). Blood gas tensions and acid–base regulation in the salt-water crocodile, Crocodylus porosus, at rest and after exhaustive exercise. J. exp. Biol. 118, 143–159.
SHELTON, G. ANDJONES, D. R. (1991). The physiology of the alligator heart: the cardiac cycle. J. exp. Biol. 158, 539–564.
STROBECK, J. E. ANDSONNENBLICK, E. H. (1986). Myocardial contractile properties and ventricular performance. In The Heart and Cardiovascular System (ed. H. A. Fozzard, E. Haber, R. B. Jennings, A. M. Katz and H. E. Morgan), pp. 31–49. New York: Raven Press.
WASSER, J. S., FREUND, E. V., GONZALEZ, L. A. ANDJACKSON, D. C. (1990a). Force and acid–base state of turtle cardiac tissue exposed to combined anoxia and acidosis. Am. J. Physiol. 259, R15–R20. WASSER, J. S., INMAN, K. C., ARENDT, E. A., LAWLER, R. G. ANDJACKSON, D. C. (1990b). 31P-NMR
measurements of pH and high energy phosphates in isolated turtle hearts during anoxia and acidosis. Am. J. Physiol. 259, R521–R530.
an hypothesis on the completion of the interventricular septum of crocodilian and birds. J. Morph. 161, 221–240.
WHITE, F. N. (1956). Circulation in the reptilian heart (Caiman sclerops). Anat. Rec. 125, 417–431.
WHITE, F. N. (1969). Redistribution of cardiac output in the diving alligator. Copeia 3, 567–570.