Birds and mammals adjust to prolonged fasting by mobilizing their fat stores (triacylglycerols, TAG) and sparing body proteins (Cahill, 1976; Goodman et al., 1980; Cherel et al., 1988a). The duration of this metabolic status, the so-called phase II of fasting (Goodman et al., 1980; Le Maho et al., 1981; Cherel et al., 1988a), depends on initial fat availability (Cherel and Groscolas, 1999). When a critical but still incomplete exhaustion of fat stores is attained, body proteins are no longer spared and animals enter into phase III of fasting (Goodman et al., 1980; Le Maho et al., 1981; Robin et al., 1988). Phase III is characterized by a progressive acceleration of protein catabolism and a decrease in the relative contribution of lipids to energy production (Goodman et al., 1980; Le Maho et al., 1981; Robin et al., 1988). It is reversible, provided that body proteins or lipids are not critically or fully depleted, respectively (Handrich et al., 1993; Robin et al., 1998).
A large part of our knowledge on how animals adjust to prolonged fasting, especially on the relationships between energy reserves, metabolic status and behaviour, arises from studies on birds that spontaneously fast at certain stages of their annual cycle. Among them are penguins (Spheniciforms), sea
birds living in the antarctic and subantarctic regions. Penguins feed exclusively at sea and must fast on land for periods of up to four months during breeding, especially during incubation (Groscolas, 1990). Both mates alternate at incubating (except in the emperor penguin, Aptenodytes forsteri) and normally it is relief by the partner that terminates the bird’s fasting bouts and allows departure to sea for refeeding (Groscolas, 1990). At this stage, most penguins are still in the phase II metabolic and endocrine status, with only a small proportion of the birds at the onset of phase III (Groscolas and Robin, 2001). However, the relieving partner can be delayed, forcing the incubating bird to prolong its fast until eventually it abandons its egg and goes to sea for feeding. This abandonment has also been observed in other sea birds such as petrels (Chaurand and Weimerskirch, 1994; Ancel et al., 1998). Recently, Groscolas et al. (2000) showed that in the king penguin Aptenodytes
patagonicus egg abandonment is preceded by a progressive
decrease in egg attendance and occurs when the birds had been fasting into phase III for about one week. In fasting non-incubating emperor penguins, and as observed in fasting rodents (Koubi et al., 1991), entrance into phase III is JEB4239
In spontaneously fasting birds such as penguins, below a body mass threshold corresponding to the phase II–phase III transition, a metabolic and hormonal shift occurs and feeding behaviour is stimulated (‘refeeding signal’). The major aim of this study was to determine whether a decrease in non-esterified fatty acid (NEFA) release from adipose tissue could be a component of this signal. Lipolytic fluxes and primary triacylglycerol:fatty acid (TAG:FA) cycling were determined in vivo in breeding, fasting king penguins (Aptenodytes patagonicus) using continuous infusions of 2-[3H]glycerol and 1-[14C]palmitate under field conditions. In phase II (after approximately 8 days of fasting, large fat stores, body protein spared, N=8), the rate of appearance (Ra) of glycerol and of NEFA were 5.7±0.8 and 10.5± 0.4µmol kg–1min–1, respectively, and the percentage of primary TAG:FA cycling was 41±7 %. In phase III (after
approximately 25 days of fasting, fat stores reduced by fourfold, increased body protein catabolism, N=9), Raglycerol kg–1body mass remained unchanged, whereas Raglycerol kg–1fat mass and RaNEFA kg–1body mass were increased by 2.8-fold and 1.5-fold, respectively. Increased Raglycerol kg–1fat mass was possibly the result of a 3.5-fold increase in circulating glucagon, the increased RaNEFA kg–1body mass being attributable to decreased primary TAG:FA cycling. Thus, triggering of the refeeding signal that redirects the behavior of fasting, incubating penguins from incubation towards the search for food after entrance into phase III cannot be ascribed to a reduction in lipolytic fluxes and NEFA availability.
Key words: lipolysis, triacylglycerol:fatty acid cycling, fat stores, refeeding signal, bird, king penguin, Aptenodytes patagonicus. Summary
Introduction
Glycerol and NEFA kinetics in long-term fasting king penguins: phase II versus
phase III
S. F. Bernard, C. Fayolle, J.-P. Robin and R. Groscolas*
Centre d’Ecologie et Physiologie Energétiques, Centre National de la Recherche Scientifique, 67087 Strasbourg, France
*Author for correspondence (e-mail: rene.groscolas@c-strasbourg.fr)
associated with an increase in locomotor activity (Robin et al., 1998). These observations have led to the hypothesis that a metabolic shift from preferential use of body lipids to body proteins as energy sources would trigger an endogenous refeeding signal (Robin et al., 1998; Groscolas et al., 2000). A reduction of the contribution of fatty acid oxidation to energy production could be a basic component of this signal. This suggestion is supported by the finding that in rats fed high fat diets, and thus relying heavily on fat as the main energy fuel (as do fasting penguins), a blockade of fatty acid oxidation stimulates food intake (Langhans and Scharrer, 1987). Since in penguins the metabolic shift occurs when fat stores are critically but not totally depleted, a decrease in the rate of fatty acid oxidation could result from a reduction in the rate of production of these substrates from adipose tissue (lipolysis).
Elucidating the mechanism of the refeeding signal that translates alteration in energy metabolism into feeding behaviour is of interest in understanding the long-term control of energy intake and body mass. The major aim of the present study was therefore to determine whether a decrease in lipid substrate release from adipose tissue is associated with entrance into phase III in penguins. Most of our knowledge on fat mobilization and its regulation in the fasting state derives from studies in short-term fasting humans and laboratory animals, i.e. essentially during the fed state to phase II transition (Belo et al., 1976; Wolfe et al., 1987; Klein et al., 1989; Kalderon et al., 2000). Not only has lipolysis during long-term fasting rarely been examined (Armstrong et al., 1961; Steele et al., 1968; Bortz et al., 1972), but no data is available for phase III fasted animals. Since the fasting physiology of the king penguin is representative of that of other birds (Cherel et al., 1988a) and to some extent of mammals (Cherel and Groscolas, 1999), the present study may also provide useful information on whether and how the lipolytic rate and NEFA availability are affected by this fasting situation.
The rate of appearance (Ra) of non-esterified fatty acid (NEFA) and glycerol (an index of lipolysis) were measured using tracer methodology during phases II and III of fasting. Phase III birds were at the same stage of fat store depletion as incubating birds at the time of spontaneous egg abandonment. The large size and tameness of the king penguin allowed measurement of lipolytic fluxes in birds under field conditions for the first time.
Materials and methods Animals
This study was carried out at the breeding colony of the Baie du Marin, Possession Island, Crozet Archipelago (46°25′S; 51°52′E) during the austral summers 1998–1999 and 1999–2000. It was approved by the Ethical Committee of the ‘Institut Français pour la Recherche et la Technologie Polaires’ and followed the ‘Agreed Measures for the Conservation of Antarctic and Subantactic Fauna’. Birds at this locality are used to seeing people almost every day. Male king penguins
Aptenodytes patagonicus J. F. Miller were identified from their
song during courtship. Seventeen of them were caught while pairing, i.e. after fasting ashore for 1–3 days. They were weighed and their beak and flippers measured (body mass BM, 13.27±0.22 kg; beak length, 133±1 mm; flipper length, 322±3 mm). The two size measurements are not significantly different from data for average male king penguins (132.5±0.8 mm and 326±5 mm, N=50; R. Groscolas, unpublished data). Birds were then kept in an outdoor fenced area (3 m×3 m) next to the colony under natural climatic conditions.
Phase II of fasting
Eight animals were habituated to these conditions for 6 days before the experiment. This time period is known to be sufficient to suppress the confinement stress and for daily BM loss, body temperature and plasma fuel level to reach a steady state in penguins (Groscolas and Rodriguez, 1981). Thus, the fasting duration at Rameasurement was about 8 days (6 days of captivity plus 1–3 days of fasting ashore at capture), which is more than the 2–3 day duration of the transition from the fed state to phase II reported for this species (Cherel et al., 1988a). BM at Rameasurement (12 kg, Table 1) was similar to that of free-living male king penguins at the onset of the first incubation shift, i.e. after about 8–10 days of fasting (Robin et al., 2001). It was also about 2–2.5 kg higher than the 9.6–10 kg BM measured at entrance into phase III in breeding, fasting male king penguins (Cherel et al., 1988b, 1994).
Phase III of fasting
[image:2.612.315.563.554.679.2]Nine animals were kept fasting and weighed every 3 days, then every day until they reached a BM close to 9 kg. This mass corresponds to that measured by Groscolas et al. (2000) in king penguins abandoning their egg to refeed at sea, and is about 0.5–1 kg lower than the BM at entrance into phase III. On average, 24±1 days of fasting in the pen were necessary for the
Table 1. Metabolic and hormonal characteristics of king
penguins during phases II and III of fasting
Phase II Phase III
(N=8) (N=9)
Body mass (kg) 11.99±0.25 8.94±0.04**
Fat mass (kg) 2.36±0.13 0.62±0.02**
Uric acid (mmol l–1) 0.21±0.02 0.52±0.12**
Glucose (mmol l–1) 11.47±0.30 10.51±0.27*
β-OH (mmol l–1) 2.02±0.31 1.55±0.16
TAG (mmol l–1) 0.77±0.11 0.56±0.07
Glucagon (pg ml–1) 79±11 280±32**
Insulin (i.u. ml–1) 9.6±1.0 10.7±0.7
Values are means ±S.E.M. i.u., international unit.
Asterisks indicate a significant difference between fasting phases (*P<0.05; ∗∗P<0.001).
animals to reach the 9 kg BM. Based on the previously reported rate of daily BM loss (Cherel et al.,1988b), it can be estimated that birds had been in the phase III fasting situation for 5–7 days when Rameasurements were performed.
Catheterization and experimental setup
The day before the experiment, the nonanesthetized bird was cannulated with a polyethylene catheter (length, 50 mm; external diameter, 1.1 mm) inserted percutaneously into the marginal vein of each flipper and extended with a 2 m long prolongator filled with saline. Catheterization of an artery for blood sampling could not be securely performed in field conditions. We assumed that any particular metabolism of the flipper (essentially feathers, bones and tendons) is low and that flipper venous blood reflects whole body metabolism. Until the experiment, catheters were kept patent by continuous infusion of 0.9 % NaCl (12.5 ml day–1) using a small peristaltic pump. After catheterization, the birds were allowed to habituate to the experimental setup for 24 h. This setup was installed in the fenced area and consisted of a wooden pen (70 cm×70 cm) with one wall high enough for us not to be seen by the bird. Catheter prolongators were placed into a balance lever system to avoid damaging the prolongators or tearing out catheters. It also allowed the bird to move freely inside the pen (a few steps) and even to lie on its belly or sleep with the bill under the shoulder, as was regularly observed during tracer infusion. The free ends of catheter prolongators used for infusion and blood sampling were brought outside the pen. From a distance these two operations could then be performed without disturbing the animal. Once the animal was in the experimental setup, particular care was taken to avoid any intervention or noise. During isotope infusion, the air temperature ranged from 10 to 15 °C, i.e. was within the thermoneutral range for the species (Groscolas and Robin, 2001), and the penguins were protected against wind but not against rain. Birds were de-equipped the day after Ra measurement, marked on the chest with Nyanzol dye to allow resighting and released in the colony next to the beach. All the birds used in the study were resighted during the following weeks, caught and weighed. All had restored their BM, which indicates that they had been succesfully feeding at sea and that the experiments had no impact on their health.
Continuous isotope infusions Infusate preparation
The infusate was prepared daily according to Wolfe (1992) and Turcotte et al. (1992) using 2-[3H]glycerol (Amersham, 40.7 Gbq mmol–1) and 1-[14C]palmitate (Amersham, 2.04 Gbq mmol–1) as tracers. Palmitate is one of the most commonly used fatty acids for measuring NEFA kinetics in mammals (Bonadonna et al., 1990). Besides its ready commercial availability, palmitate is the second most abundant NEFA in mammals and its percentage contribution to NEFA shows low interindividual variability. This was also observed in king penguins in phase II and phase III (data not shown), suggesting that labeled palmitate is as appropriate an indicator
of NEFA kinetics in king penguins as in mammals. 1-[14C]palmitate was supplied commercially in toluene. A subsample in a sterile flask was evaporated to dryness and immediately resuspended in ethanol to obtain a solution of 37 kBqµl–1. NaOH (2 mmol l–1in ethanol) was added to excess and the mixture was evaporated to dryness. The water-soluble 1-[14C]palmitate sodium salt was dissolved in heated sterile saline. The solution was cooled to about 30 °C and 3.5 % delipidated bovine albumin solution was added so that the palmitate/albumin molar ratio was 0.5. 2-[3H]glycerol was then added and the infusate volume was adjusted with saline. Infusion of the isotope mixture was performed using a calibrated syringe pump at 7 ml h–1. 2-[3H]glycerol and 1-[14C]palmitate infusion rates were 224.9±5.1×10³ and 109.8±3.6×10³d.p.m. kg–1min–1 (N=17), respectively, or less than 0.1 nmol glycerol kg–1min–1 and less than 1.0 nmol palmitate kg–1min–1. This corresponded to trace amounts of <0.002 % of Ra glycerol and <0.03 % of Ra palmitate.
Infusion protocol and blood sampling
To decrease the time necessary to reach the isotopic steady state, we injected a priming dose. It was immediately followed by a 180-min continuous infusion. The first blood sample was not taken until at least 120 min after the beginning of the infusion, to ensure that the steady state was reached (see Results). During the last hour of infusion, 3–4 blood samples of 5 ml each were drawn. Immediately after sampling, the blood was centrifuged and the plasma separated. Plasma was stored at –20 °C until analysis.
Analytical procedures
A portion of plasma (1 ml) was mixed with 25 ml chloroform:methanol (2:1, v:v) according to Folch et al. (1957). After extraction and evaporation as described in Bernard et al. (1999), an aqueous and an organic extract were obtained and resuspended in ethanol:water (1:1, v:v) and hexane:isopropanol (3:2, v:v), respectively.
Glycerol
of glycerol was calculated as total tritium activity times percentage of activity in glycerol divided by glycerol concentration.
Fatty acids
Total NEFA concentration was measured on 10µl of plasma with an analytical test-kit (NEFA C, Wako Chemicals, Osaka, Japan). The palmitate concentration was obtained by multiplying NEFA concentration by the fractional contribution of palmitate to total NEFA, determined by gas–liquid chromatography. Briefly, plasma lipids were extracted according to Dole and Meinertz (1960) and separated by thin layer chromatography (silica gel plate 60, Merck, Darmstadt, Germany) using hexane:diethyl ether:acetic acid (70:30:1, v:v:v) as the developing solvent. The NEFA fraction was isolated and converted to methyl esters using 14 % boron trifluoride in methanol. Fatty acid methyl esters were separated and quantified by gas–liquid chromatography using a Chrompack CP 9001 gas chromatograph equipped with an AT-WAX capillary column [0.25 mm (i.d.) × 30 m, 0.25µm thickness, Alltech, Templeuve, France] and a flame ionization detector. Helium was used as the carrier gas and the oven temperature was maintained at 200 °C. Fatty acid peaks were identified by comparing their retention times with authentic standards (Nu-Chek Prep, Elysian, MN, USA) and quantified with an integrator (model SP 4290, Spectra-Physics, Les Ulis, France).
Because phospholipids are not completely extracted by the method of Dole and Meinertz (1960), the total 14C activity and its distribution in plasma lipids (TAG, diacylglycerols, NEFA and phospholipids) was determined on the organic extract obtained from extraction, according to Folch et al. (1957). Lipids were separated by thin layer chromatography, as described above. Each fraction was scraped into separate scintillation vials, resuspended in ethanol:water (1:1, v:v) and counted in Ecoscint A scintillation fluid. Because no 14C is incorporated into fatty acids other than palmitate, palmitate activity was calculated by multiplying total 14C activity found in the organic extract by the percentage activity found in the NEFA fraction. Palmitate activity divided by palmitate concentration yielded palmitate specific activity.
Other plasma metabolites and hormones
Plasma glucose and β-hydroxybutyrate levels were determined on deproteinized plasma by enzymatic methods (Test-Combination, Boehringer-Mannheim GmbH, Germany). Uric acid and TAG levels were estimated by enzymatic colorimetric methods using commercial kits (UA plus for uric acid and Peridochrom triglycerides GPO-PAP for TAG; Boehringer-Mannheim GmbH, Germany). Plasma glucagon and insulin levels were determined by radioimmunoassay. Glucagon was estimated using a commercial kit (Linco, St Charles, MS, USA); the intra- and inter-assay coefficients of variation were 6 % and 7 %, respectively. Insulin was estimated using the insulin-CT kit from CIS bio international (Gif-sur-Yvette, France). The intra- and inter-assay coefficients of
variation were 5 % and 6 %, respectively. Plasma obtained after reaching an isotopic steady state was used in all the measurements.
Calculations and statistics
Fat mass (FM) was calculated from BM (both in kg) as: FM=0.552×BM–4.260 (r2=0.74, N=81, P<0.0001). This equation was determined in a preliminary study for king penguins with BM 8.5–14.7 kg (M.-A. Thil and R. Groscolas, unpublished data).
Glycerol and palmitate Ravalues were calculated using the steady state equation of Steele (1959): Ra=tracer infusion rate (d.p.m. min–1)/specific activity (d.p.m. mmol–1), and are expressed per unit of body mass or fat mass. Ra NEFA was determined by dividing Ra palmitate by the fractional contribution of palmitate to total NEFA (on average 26 % and 14 % in phase II and III, respectively; see Results).
TAG:FA cycling occurs both primarily (i.e. where fatty acids are re-esterified in adipose tissue without entering the circulation) and secondarily (i.e. where fatty acids arrive at their site of re-esterification through the circulation) (Klein et al., 1989; Wolfe et al., 1990). In the present study, only the absolute and relative rates of primary cycling could be assessed. Upon hydrolysis, each TAG molecule yields three NEFA and one glycerol molecules so that 3×Ra glycerol represents total fatty acid release by lipolysis. Glycerol cannot be metabolized directly because of the absence of glycerokinase in adipocytes (Wolfe et al., 1990). Therefore, primary TAG:FA cycling was calculated according to Wolfe et al. (1990) as:
TAG:FA cycling (µmol kg–1min–1) =
(3×Raglycerol) – RaNEFA, TAG:FA cycling (%) =
100×(TAG:FA cycling) / (3×Raglycerol) . It has been shown that substantial and significant rates of primary cycling can be obtained only if the ratio RaNEFA:Ra glycerol is well below 3 (Wolfe, 1992).
Changes in glycerol and palmitate specific activities were assessed by two-way analysis of variance (ANOVA) or Kruskal–Wallis ANOVA on ranks (when populations were not normal or homoscedastic). Relationships between plasma concentration and Raglycerol and RaNEFA were assessed by linear regression analysis. In all other cases, statistical differences were estimated using the Student’s t-test or the Mann–Whitney Rank Sum test. Percentages were transformed to the arcsine of their square root before statistical analysis. Values are means ± S.E.M. The criterion of significance was
P<0.05.
Results
Metabolic and hormonal status
birds in phase III had a 25 % lower BM, nearly fourfold lower FM (7 % versus 20 % adiposity) and 2.4-fold and 3.5-fold higher plasma uric acid and glucagon levels, respectively (P<0.001). Plasma glucose concentration was also slightly lower in phase III (P<0.05). Plasma β-hydroxybutyrate, TAG and insulin levels were not significantly different between the two fasting phases.
Isotopic steady state
In both fasting phases, the isotopic steady state existed during the last 60 min of infusion, as indicated by the non-significant changes in specific activities of glycerol and palmitate (P>0.90; Fig. 1A,B). Glycerol specific activity was similar in phases II and III (P=0.84) and averaged 4.62±0.60×10⁴disints min–1mol–1. Palmitate specific activity was significantly higher in phase III (6.74±1.16×10⁴disints min–1mol–1) than in phase II (4.09±0.45×10⁴disints min–1mol–1) (P<0.05).
Concentration and rate of appearance of lipolytic metabolites
Concentration and Raglycerol, Rapalmitate and RaNEFA are shown in Table 2. Glycerol and NEFA concentrations were slightly but not significantly higher in phase III than in phase II, the palmitate level in phase III being about two-thirds that of phase II (P<0.01). The percentage contribution of palmitate to total NEFA did not change throughout the
infusion experiment. It was lower in phase III (14±2 %) than in phase II (26±3 %; P<0.001). When expressed relative to BM, Ra glycerol and Ra palmitate were similar in phases II and III (P>0.20) and averaged 5.85±0.51 and 2.43±0.22µmol kg–1min–1, respectively. Only R
a NEFA
was 1.5-fold higher in phase III than in phase II (P<0.05). However, when expressed per unit of FM, Ra glycerol, Rapalmitate and RaNEFA were 2.8-, 2.2- and 4.1-fold, respectively, higher in phase III than in phase II (P<0.001).
As shown in Fig. 2A, there was a significant direct relationship between plasma concentration of glycerol (x) and
Ra glycerol (y) in phases II and III. At any given plasma glycerol level, Raglycerol was higher in phase III than in phase II when expressed per unit FM (P<0.05). When Ra glycerol was expressed relative to BM, the regression equations were not different between the two fasting situations (P>0.05; not shown). Fig. 2B illustrates that NEFA levels in plasma and Ra NEFA expressed per unit FM were directly related in phase III. This relationship was not significant in phase II but, at any given plasma NEFA level, RaNEFA was lower than in phase III.
TAG:FA cycling
The rate of primary TAG:FA cycling expressed relative to BM and the percentage of re-esterification were about 3.5-fold lower in phase III than in phase II (P<0.01, Table 2). The rate of TAG:FA cycling expressed in relation to FM was not different in the two fasting situations (P=0.53).
A
B
0 4×1048×104
Time (min)
0 120 150 180
Pa
lmi
tat
e
sp
ec
if
ic
act
iv
ity
(d.p.
m
.
µ
m
o
l
–
1)
G
lyc
er
o
l
sp
ec
if
ic
act
iv
ity
(d.p.
m
.
µ
m
o
l
–
1)
0 4×10⁴
[image:5.612.56.293.69.350.2]8×10⁴
Fig. 1. Glycerol (A) and palmitate (B) specific activities during the final 60 min of 2-[3H]glycerol and 1-[14C]palmitate infusion. Closed
circles, solid line, phase II; open triangles, dotted line, phase III. Values are means ±S.E.M. for 8 (phase II) and 9 (phase III) birds.
Table 2. Mean plasma concentrations and rates of appearance
of glycerol, palmitate and total non-esterified fatty acids during phases II and III of fasting in king penguins
Phase II Phase III
(N=8) (N=9)
Glycerol (mmol l–1) 0.05±0.01 0.08±0.01
Palmitate (mmol l–1) 0.16±0.01 0.10±0.02**
NEFA (mmol l–1) 0.61±0.03 0.74±0.08
Raglycerol (µmol kg–1min–1) 5.72±0.79 5.89±0.72
Raglycerol (µmol kg FM–1min–1) 30.00±4.62 85.06±11.61***
Rapalmitate (µmol kg–1min–1) 2.71±0.32 2.18±0.30
Rapalmitate (µmol kg FM–1min–1) 13.97±1.68 31.08±3.79***
Ra NEFA (µmol kg–1min–1) 10.49±0.39 15.63±1.92*
Ra NEFA (µmol kg FM–1min–1) 53.99±6.80 223.78±26.82***
TAG:FA cycling (µmol kg–1min–1) 8.06±1.59 2.18±1.02**
TAG:FA cycling 43.15±8.98 31.46±15.25
(µmol kg FM–1min–1)
Percentage of re-esterification (%) 40.7±7.0 11.7±4.0**
Calculated rates of TAG:FA cycling and percentage of re-esterification are also presented.
Values are means ±S.E.M.
Asterisks indicate a significant difference between fasting phases (*P<0.05; **P<0.01; ***P<0.001).
Ra, rate of appearance; NEFA, non-esterified fatty acids; FM, fat
[image:5.612.317.567.111.284.2]Discussion
Methodological considerations
This study was based on the measurement of the rate of appearance of glycerol (Raglycerol) and of non-esterified fatty acids (Ra NEFA) during phase II and phase III of fasting in king penguins. In addition to data on fasting duration and BM (see Materials and methods), measurements of plasma concentration of metabolites support the view that the birds were actually in these fasting states. In phase II birds, plasma uric acid and β-hydroxybutyrate levels were low and high, respectively, and similar to those observed in penned incubating (Robin et al., 2001) and non-incubating king penguins (Cherel et al., 1988b) during phase II. These metabolite concentrations indicate a low protein catabolism and a high fatty acid oxidation, which is the signature of phase II of fasting in penguins and other birds (Cherel et al., 1988a;
Robin et al., 1988, 1998). In phase III individuals, plasma uric acid level was increased by a factor of 2.5, which is indicative of the high rate of protein degradation that characterizes phase III of fasting (Cherel et al., 1988b; Robin et al., 1998). This plasma uric acid level was slightly higher than in penned incubating birds at egg abandonment (approximately 0.36 mmol l–1) (Robin et al., 2001), suggesting that in our study the phase III penguins had reached a state of critical energy depletion similar to that of breeders abandoning their egg.
Here we report the first simultaneous in vivo measurements of glycerol and NEFA kinetics in birds. How valid are the lipolytic fluxes estimated by the tracer method we used in fasting penguins? In phase II penguins, Ra glycerol and Ra NEFA averaged 5.7 and 10.5µmol kg–1min–1, respectively. Given the molecular weight of glycerol (92 g mol–1) and NEFA (on average 280 g mol–1 in king penguins; R. Groscolas, unpublished data), these rates are equivalent to a daily release of 9.1 and 50.8 g of glycerol and NEFA, respectively. Assuming all glycerol and NEFA released into the circulation are oxidized (no secondary recycling), these numbers approximate daily loss. The daily loss of glycerol and NEFA can also be estimated from daily BM loss, considering that (i) in the king penguin, lipids (TAG) steadily contribute to 47 % of BM loss during phase II (Cherel et al., 1994) and (ii) the glycerol and fatty acid moieties, respectively, contribute 10 % and 90 % of TAG. To avoid repeated manipulations, daily BM loss was not measured in this study. However, based on the 140 g day–1BM loss observed in king penguins under similar conditions (BM=12 kg, birds caught at pairing and penned for 1 week; R. Groscolas, unpublished data), a daily loss of approximately 7 g of glycerol and 59 g of fatty acids could be estimated. The reasonable agreement between the two estimates supports the conclusion that realistic lipolytic fluxes are obtained by continuous infusion of 2-[3H]glycerol and 1-[14C]palmitate in phase II fasting king penguins. Estimates of the daily loss of glycerol and fatty acids from BM loss cannot be made during phase III because the lipid contribution to daily BM loss progressively decreases during this phase and is not known for animals of 9 kg BM.
Lipolysis during prolonged fasting: phase II versus phase III
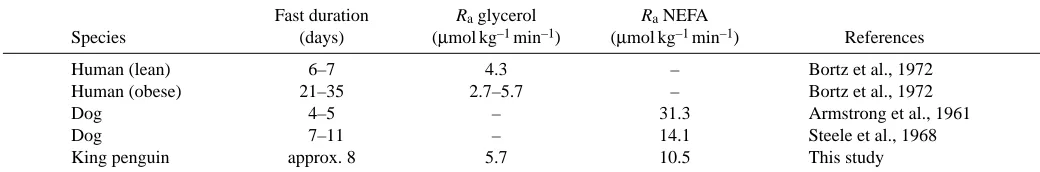
Lipolytic fluxes have rarely been measured during prolonged fasting in mammals, and never during natural fasting or during phase III. The turnover of two fatty acids has been measured in naturally fasting pups of elephant seal, but no data on the Ra glycerol and Ra NEFA were obtained (Castellini et al., 1987). Table 3 summarizes data obtained in the only two mammal species, humans and dogs, studied after fasting durations (1–4 weeks) comparable to that of the king penguin during phase II. Raglycerol in penguins is within the range reported for humans, whereas RaNEFA is at the lower end of the range reported in dogs. More abundant data is available for short-term fasting laboratory animals and humans. In chickens fasted for 2 days, Emmanuel et al. (1983) reported Ra glycerol (6.6µmol kg–1min–1) similar to that measured in phase II penguins. In resting non-obese humans
A
B
[Glycerol] (mmol l–1)0 0.04 0.08 0.12 0.16
Ra
g
lycerol (
µ
mol
k
g
FM
–1 m
in
–1
)
Ra
NE
F
A
(
µ
mol
k
g
FM
–1
m
in
–1
)
0 50 100 150 200
0 100 200 300 400
Phase II: y=(541.6x)+2.2; P=0.027 Phase III: y=(632.4x)+34.9; P=0.040
Phase II
Phase III
Phase III
Phase II Phase II: P=0.53
Phase III: y=(231.7x)+51.4; P=0.035
[NEFA] (mmol l–1)
[image:6.612.62.269.72.424.2]0 0.4 0.6 0.8 1.0
Fig. 2. Regressions of rates of appearance (Ra) of glycerol (A) and
fasting for 60–96 h, Ra glycerol ranges from 3.8 to 6.4µmol kg–1min–1 (Klein et al., 1986; Wolfe et al., 1987; Jensen et al., 2001), and was 5.9µmol kg–1min–1in dogs fasted for 18 h (Nurjhan et al., 1988). RaNEFA values of 16.5 and 10.0µmol kg–1min–1have been reported in normal and obese humans, respectively, fasted for 84 h, respectively (Wolfe et al., 1987). Thus, the lipolytic fluxes measured in the present study of king penguins during phase II (Ra glycerol= 5.7µmol kg–1min–1, R
a NEFA=10.5µmol kg–1min–1) are within the range reported for fasting animals of comparable body size. The value of 41 % obtained for the percentage of primary TAG:FA cycling in penguins during phase II is within the range of 20–49 % reported for short-term fasting humans (Wolfe et al., 1990; Campbell et al., 1994) and laboratory mammals (Commerford et al., 2000; Kalderon et al., 2000; McClelland et al., 2001). However, it must be mentioned that a percentage of recycling that was lower than 13 % or even insignificant has been reported by others (Coppack et al., 1994). It therefore seems that primary recycling is comparatively high in phase II fasting king penguins.
In this study, the whole body lipolytic rate (Raglycerol in relation to BM; Klein et al., 1986) remained unchanged during phase III in comparison to phase II, despite a fourfold lower FM. It has been shown previously that in penguins, entrance into phase III corresponds to a decrease in the contribution of lipid to energy production, compensated by an increase in the contribution of protein (Robin et al., 1988; Groscolas, 1990). On the other hand, the resting metabolic rate expressed per kg BM is not affected by entrance into phase III (Dewasmes et al., 1980; Cherel et al., 1988a). In our experimental setup, animals in phase III did not show a higher level of physical activity than animals in phase II. Thus it is likely that the metabolic rate per kg BM was similar in the two fasting situations, which suggests that in long-term fasting penguins, the whole body lipolytic rate is related to energy needs rather than to FM. A similar suggestion has been made for short-term fasting humans on the basis of the determination of the whole body lipolytic rate at different levels of adiposity (Klein et al., 1986). Lipolysis (Raglycerol per FM unit; Klein et al., 1986) and NEFA availability for oxidation (Ra NEFA per BM unit; Klein et al., 1986) were respectively 2.8-fold and approx. 50 % higher in phase III than in phase II, despite high depletion of fat stores in phase III. This observation indicates that, in long-term fasting penguins, NEFA availability is not directly proportional to the size of the TAG stores, i.e. that fat mass is not the only
regulator of fatty acid availability. A similar conclusion was drawn from the comparison of RaNEFA in obese and lean overnight-fasted humans (Lillioja et al., 1986). Here we show that the same applies to prolonged fasted animals with very small fat stores.
The increase in lipolysis observed in phase III could have been subject to lipolytic hormone control. In birds, glucagon has a strong lipolytic effect (Hazelwood, 1984) and its intravenous injection markedly increases the concentration of circulating plasma NEFA in the emperor penguin (Groscolas and Bézard, 1977). Here we found that the plasma level of glucagon was 3.5-fold higher in phase III than in phase II, in accordance with the previous observation that in fasting non-incubating king penguins, glucagon increases progressively during phase II and more sharply at entrance into phase III (Cherel et al., 1988b). This increase in glucagonemia might have stimulated lipolysis. Unlike in mammals, insulin has no antilipolytic effect in birds (Hazelwood, 1984), including the emperor penguin (Groscolas and Bézard, 1977). Moreover, in the present study the plasma concentration of this hormone was not different in birds fasting in phase II and in phase III. It is therefore unlikely that insulin intervened in the phase III increase of lipolysis.
The triacylglycerol:fatty acid substrate cycle and NEFA availability
[image:7.612.48.568.86.172.2]Compared to phase II, total fatty acid release via TAG hydrolysis (3×Ra glycerol) relative to total BM remained nearly unchanged in phase III, whereas the percentage of fatty acids that were primarily re-esterified decreased from 41 % to 12 %. Thus, the decrease in primary TAG:FA cycling (–5.9µmol kg–1min–1) accounts entirely for the increase in NEFA availability (+5.1µmol kg–1min–1). Regulation of the primary TAG:FA cycle is poorly understood (McClelland et al., 2001). Potential factors include hormones, substrate concentrations, adipose tissue blood flow and interactions among them (Wolfe et al., 1990; McClelland et al., 2001). It is unlikely that the reduced percentage of primary TAG:FA cycling in phase III was due to a direct inhibition of re-esterification within the adipocyte. Indeed, the absolute primary TAG:FA cycling in relation to FM was not significantly lower in phase III than in phase II. The availability of glucose, which is a precursor of glycerol 3-phosphate (Wolfe et al., 1990; McClelland et al., 2001), was probably not a limiting factor of primary re-esterification. Glucose concentration was only slightly lower in phase III Table 3. Rate of appearance (Ra) of glycerol and NEFA in humans, dogs and king penguins during phase II of fasting
Fast duration Raglycerol RaNEFA
Species (days) (µmol kg–1min–1) (µmol kg–1min–1) References
Human (lean) 6–7 4.3 – Bortz et al., 1972
Human (obese) 21–35 2.7–5.7 – Bortz et al., 1972
Dog 4–5 – 31.3 Armstrong et al., 1961
Dog 7–11 – 14.1 Steele et al., 1968
than in phase II, and in penguins the glucose turnover rate did not change between phases II and III (Groscolas and Rodriguez, 1981). Blood flow per unit mass of adipose tissue is known to increase as fat cell size decreases (Di Girolamo et al., 1971), and in the emperor penguin the average fat cell size at entrance into phase III is fivefold smaller than at the onset of the fast (Groscolas, 1990). Here, an increase in adipose tissue blood flow in the leaner birds is supported by the finding that the regression lines between glycerol and NEFA concentration and their respective Ra per kg FM are shifted upwards during phase III (Fig. 2). Indeed, since the Ra of metabolites has been shown to be strongly dependent on their convective transport through the circulation, i.e. concentration ×blood flow (Weber et al., 1987), a higher Ra at a given concentration indicates a higher blood flow. Thus, simultaneously with improving glucose supply to adipocytes, an increased adipose tissue blood flow in phase III could have caused the reduced percentage of primary TAG:FA cycling by providing adequate albumin binding sites to carry away fatty acids released by lipolysis (Leibel and Edens, 1990; Wolfe et al., 1990).
Our method allowed us to measure only the primary TAG:FA cycling, so we do not know the fraction of RaNEFA that is re-esterified secondarily after NEFA transit through the circulation. Such an estimation would have required determining fatty acid oxidation (from the measurement of energy expenditure, RQ and N2 excretion), which was not feasible under our field conditions. NEFA availability, i.e. NEFA available either for oxidation or secondary cycling after their release into the circulation, was increased in phase III. Because energy expenditure does not increase during phase III whereas the contribution of fatty acids to energy production decreases (see above), it is very likely that the rate of fatty oxidation was lower in phase III than in phase II. Consequently, it is conceivable that a larger part of the circulating NEFA was re-esterified back to TAG through secondary TAG:FA cycling in phase III than in phase II. A higher secondary cycling could counterbalance the decrease in primary cycling and prevent the remaining fatty acid stores from being oxidized, perhaps because they are needed for a more vital role than energy production.
Lipolysis and the refeeding signal
The major aim of this study was to examine whether a reduction in NEFA availability through a decrease in the lipolytic rate is the first step of a metabolic and endocrinal cascade that leads to the stimulation of feeding behaviour in prolonged fasting penguins. Our results do not support this possibility. Indeed, entrance into phase III, which is known to trigger the refeeding signal, was not associated with a reduction but with an increase in Ra NEFA, the whole body lipolytic rate remaining unchanged. Thus, if entrance into phase III is due to the attainment of a critical fat mass, the lipolytic rate does not appear to be the link between reduced total body fat availability and increased protein catabolism. The observation that NEFA availability may positively affect
sparing of body protein (Hasselblatt et al., 1971) clearly does not apply in penguins during fasting phase III. It cannot be ruled out that other information arising from adipose tissue, including leptin secretion (Ahima et al., 1996), might inform the whole body or organs of fat store availability. On the other hand, alteration of metabolic pathways other than from adipose tissue can be suggested. Among them, a reduction of fatty acid oxidation in tissues such as the liver should be considered first. In prolonged fasting rats, entrance into phase III has been shown to be associated with a rapid decrease in the total hepatic activity of carnitine palmitoyltransferase and fatty acid oxidase, which are enzymes involved in mitochondrial and peroxisomal fatty acid oxidation, respectively (Andriamampandry et al., 1996). Such a decrease in hepatic fatty acid oxidation in the face of an increased RaNEFA could explain the transitory (several days) increase in plasma NEFA concentration observed previously at entrance into phase III in young (Cherel and Le Maho, 1985) and adult (R. Groscolas, E. Mioskowski and J.-P. Robin, unpublished data) king penguins. Here, plasma NEFA concentration was slightly but not significantly higher in phase III than in phase II, perhaps because the experiments were done a little before or after reaching the peak in plasma NEFA concentration. A decrease in hepatic fatty acid oxidation in phase III fasted king penguins is also suggested by the slight decrease in the plasma concentration of β-hydroxybutyrate, a product of β-oxidation. Although non-significant, this decrease at least indicates that the progressive increase in plasma β-hydroxybutyrate concentration that is observed during phase II in penguins (Groscolas, 1986; Cherel et al., 1988b) has been reversed. Altogether, these observations support the view of a reduced fatty acid oxidation in penguins with the same energy status as those spontaneously departing to refeed at sea. A reduction of hepatic fatty acid oxidation has been shown to stimulate feeding behaviour in rats relying heavily on fat as energy substrate (Langhans and Scharrer, 1987). The same might apply in penguins, the reduction in fatty acid oxidation apparently being independent of fatty acid production by adipose tissue.
Financial support was provided by the Institut Français pour la Recherche et la Technologie Polaires (Programme 119) and logistical support by the Terres Australes et Antarctiques Françaises. We thank E. Mioskowski for assistance in the sample analyses.
References
Ahima, R. S., Prabakaran, D., Mantzoros, C., Qu, D., Lowell, B., Maratos-Flier, E. and Maratos-Flier, J. S. (1996). Role of leptin in the neuroendocrine response to fasting. Nature 382, 250–252.
Ancel, A., Petter, L. and Groscolas, R. (1998). Changes in egg and body temperature indicate triggering of egg desertion at a body mass threshold in fasting incubating blue petrels (Halobaena caerulea). J. Comp. Physiol. B 168, 533–539.
Andriamampandry, M. D., Bnouham, M., Michard, D., Gutbier, G., Le Maho, Y. and Leray, C. (1996). Food deprivation modifies fatty acid partitioning and β-oxidation in rat liver. J. Nutr. 126, 2020–2027. Armstrong, D. T., Steele, R., Altszuler, N., Dunn, A., Bishop, J. S. and De
Bodo, R. C. (1961). Regulation of plasma free fatty acid turnover. Am. J.
Physiol. 201, 9–15.
Belo, P. S., Romsos, D. and Leveille, G. A. (1976). Blood metabolites and glucose metabolism in the fed and fasted chicken. J. Nutr. 106, 1135–1143. Bernard, S. F., Reidy, S. P., Zwingelstein, G. and Weber, J.-M. (1999). Glycerol and fatty acid kinetics in rainbow trout: effects of endurance swimming. J. Exp. Biol. 202, 279–288.
Bonadonna, R. C., Groop, L. C., Zych, K., Shank, M. and DeFronzo, R. A. (1990). Dose-dependent effect of insulin on plasma free fatty acid turnover and oxidation in humans. Am. J. Physiol. Endocrinol. Metab. 259, E736–E750.
Bortz, W., Palve, P., Haff, A. C. and Holmes, W. L. (1972). Glycerol turnover and oxidation in man. J. Clin. Invest. 51, 1537–1546.
Cahill, G. F. (1976). Starvation in man. Clin. Endocrinol. Metab. 5, 397–415. Campbell, P. J., Carlson, M. G. and Nurjhan, N. (1994). Fat metabolism
in human obesity. Am. J. Physiol. Endocrinol. Metab. 266, E600–E605. Castellini, M. A., Costa, D. P. and Huntley, A. C. (1987). Fatty acid
metabolism in fasting elephant seal pups. J. Comp. Physiol. B 157, 445–449. Chaurand, T. and Weimerskirch, H. (1994). Incubation routine, body mass regulation and egg neglect in the blue petrel Halobaena caerulea. IBIS 136, 285–290.
Cherel, Y., Gilles, J., Handrich, Y. and Le Maho, Y. (1994). Nutrient reserve dynamics and energetics during long-term fasting in the king penguin (Aptenodytes patagonicus). J. Zool. 234, 1–12.
Cherel, Y. and Groscolas, R. (1999). Relationship between nutrient storage and nutrient utilization in long-term fasting birds and mammals. In 22nd Int.
Ornithol. Cong. Durban (ed. N. J. Adams and R. H. Slotow), pp. 17–34.
Johannesburg: BirdLife South Africa.
Cherel, Y. and Le Maho, Y. (1985). Five months of fasting in king penguin chicks: body mass loss and fuel metabolism. Am. J. Physiol. Reg. Int. Comp.
Physiol. 249, R387–R393.
Cherel, Y., Robin, J.-P. and Le Maho, Y. (1988a). Physiology and biochemistry of long-term fasting birds. Can. J. Zool. 66, 159–166. Cherel, Y., Robin, J.-P., Walch, O., Karmann, H., Netchitailo, P. and Le
Maho, Y. (1988b). Fasting in king penguin. I. Hormonal and metabolic changes during breeding. Am. J. Physiol. Reg. Int. Comp. Physiol. 254, R170–R177.
Commerford, S. R., Pagliassotti, M. J., Melby, C. L., Wei, Y., Gayles, E. C. and Hill, J. O. (2000). Fat oxidation, lipolysis and free fatty acid cycling in obesity-prone and obesity-resistant rats. Am. J. Physiol. Endocrinol.
Metab. 279, E875–E885.
Coppack, S. W., Jensen, M. D. and Miles, J. M. (1994). In vivo regulation of lipolysis in humans. J. Lipid Res. 35, 177–193.
Dewasmes, G., Le Maho, Y., Cornet, A. and Groscolas, R. (1980). Resting metabolic rate and cost of locomotion in long-term fasting emperor penguins. J. Appl. Physiol. Resp. Environ. Exercise Physiol. 49, 888–896. Di Girolamo, M., Skinner, N. S., Hanley, H. G. and Sachs, R. G. (1971). Relationship of adipose tissue blood flow to fat cell size and number. Am.
J. Physiol. 220, 932–937.
Dole, V. P. and Meinertz, H. (1960). Microdetermination of long chain fatty acids in plasma and tissues. J. Biol. Chem. 235, 2595–2599.
Emmanuel, B., Berzins, R. and Robblee, A. R. (1983). Rate of entry of
alanine and glycerol and their contribution to glucose synthesis in fasted chickens. Brit. Poult. Sci. 24, 565–571.
Folch, J., Lees, M. and Sloane-Stanley, G. H. (1957). A simple method for the isolation and purification of total lipids from animal tissues. J. Biol.
Chem. 226, 497–509.
Goodman, M. N., Larsen, P. R., Kaplan, M. M., Aoki, T. T., Young, V. R. and Ruderman, N. B. (1980). Starvation in the rat. II. Effect of age and obesity on protein sparing and fuel metabolism. Am. J. Physiol. Endocrinol.
Metab. 239, E277–E286.
Groscolas, R. (1986). Changes in body mass, body temperature and plasma fuel levels during the natural breeding fast in male and female emperor penguin Aptenodytes forsteri. J. Comp. Physiol. B 156, 521–527. Groscolas, R. (1990). Metabolic adaptations to fasting in emperor and king
penguins. In Penguin Biology (ed. L. S. Davis and J. T. Darby), pp. 269–296. San Diego: Academic Press.
Groscolas, R. and Bézard, J. (1977). Effect of glucagon and insulin on plasma free fatty acids and glucose metabolism in the emperor penguin,
Aptenodytes forsteri. Gen. Comp. Endocrinol. 32, 230–235.
Groscolas, R., Decrock, F., Thil, M.-A., Fayolle, C., Boissery, C. and Robin, J.-P. (2000). Refeeding signal in fasting-incubating king penguins: changes in behavior and egg temperature. Am. J. Physiol. Reg. Int. Comp.
Physiol. 279, R2104–R2112.
Groscolas, R. and Robin, J.-P. (2001). Long-term fasting and re-feeding in penguins. Comp. Biochem. Physiol. 128A, 645–655.
Groscolas, R. and Rodriguez, A. (1981). Glucose metabolism in fed and fasted emperor penguins (Aptenodytes forsteri). Comp. Biochem. Physiol. 70A, 191–198.
Handrich, Y., Nicolas, L. and Le Maho, Y. (1993). Winter starvation in captive common barn-owls: physiological states and reversible limits. Auk 110, 458–469.
Hasselblatt, A., Patin, V. and Poser, W. (1971). The stimulatory effect of antilipolytic compounds on amino acid metabolism and urea synthesis in the rat. In Metabolic Effect of Nicotinic Acid and its Derivatives (ed. K. F. Gey and L. A. Carlson), pp. 1023–1034. Bern, Switzerland: Hans Huber. Hazelwood, R. L. (1984). Pancreatic hormones, insulin/glucagon molar ratios,
and somatostatin as determinants of avian carbohydrate metabolism. J. Exp.
Zool. 232, 647–652.
Jensen, M. D., Chandramouli, V., Schumann, W. C., Previs, S. F., Gupta, S. and Landau, B. R. (2001). Sources of blood glycerol during fasting. Am.
J. Physiol. Endocrinol. Metab. 281, E998–E1004.
Kalderon, B., Mayorek, N., Berry, E., Zevit, N. and Bar-Tana, J. (2000). Fatty acid cycling in the fasting rat. Am. J. Physiol. Endocrinol. Metab. 279, E221–E227.
Klein, S., Peters, J., Holland, O. B. and Wolfe, R. R. (1989). Effect of short-and long-term β-adrenergic blockade on lipolysis during fasting in humans.
Am. J. Physiol. Endocrinol. Metab. 257, E65–E73.
Klein, S., Young, V. R., Blackburn, G. L., Bistrian, B. R. and Wolfe, R. R. (1986). Palmitate and glycerol kinetics during brief starvation in normal weight young adult and elderly subjects. J. Clin. Invest. 78, 928–933. Koubi, H. E., Robin, J.-P., Dewasmes, G., Le Maho, Y., Frutoso, J. and
Minaire, Y. (1991). Fasting-induced rise in locomotor activity in rats coincides with increased protein utilization. Physiol. Behav. 50, 337–343. Langhans, W. and Scharrer, E. (1987). Role of fatty acid oxidation in control
of meal pattern. Behav. Neur. Biol. 47, 7–16.
Le Maho, Y., Vu Van Kha, H., Koubi, H., Dewasmes, G., Girard, J., Ferré, P. and Cagnard, M. (1981). Body composition, energy expenditure, and plasma metabolites in long-term fasting geese. Am. J. Physiol. Endocrinol.
Metab. 241, E342–E354.
Leibel, R. L. and Edens, N. (1990). Control of acylglyceride stores in human adipose tissue: re-esterification and lipolysis. Comparability of in vivo and in vitro findings. UCLA Symp. Mol. Cell Biol. 133, 189–201.
Lillioja, S., Foley, J., Bogardus, C., Mott, D. and Howard, B. V. (1986). Free fatty acid metabolism and obesity in man: in vivo and in vitro comparisons. Metabolism 35, 505–514.
McClelland, G. B., Hochachka, P. W., Reidy, S. P. and Weber, J.-M. (2001). High-altitude acclimation increases the triacylglycerol/fatty acid cycle at rest and during exercise. Am. J. Physiol. Endocrinol. Metab. 281, E537–E544.
Nurjhan, N., Kennedy, F., Consoli, A., Martin, C., Miles, J. and Gerich, J. (1988). Quantification of the glycolytic origin of plasma glycerol: implication for the use of the rate of appearance of plasma glycerol as an index of lipolysis in vivo. Metabolism 37, 386–389.
to a metabolic shift. Am. J. Physiol. Reg. Int. Comp. Physiol. 274, R746–R753.
Robin, J.-P., Fayolle, C., Decrock, F., Thil, M.-A., Côté, S. D., Bernard, S. and Groscolas, R. (2001). Restoration of body mass in King Penguins after egg abandonment at a critical energy depletion stage: early versus late breeders. J. Avian Biol. 32, 303–310.
Robin, J.-P., Frain, M., Sardet, C., Groscolas, R. and Le Maho, Y. (1988). Protein and lipid utilization during long-term fasting in emperor penguins.
Am. J. Physiol. Reg. Int. Comp. Physiol. 254, R61–R68.
Steele, R. (1959). Influences of glucose loading and of injected insulin on hepatic glucose output. Ann. NY Acad. Med. Sci. 82, 420–430.
Steele, R., Winkler, B., Rathgeb, I., Bjerknes, C. and Altszuler, N. (1968). Plasma glucose and free fatty acid metabolism in normal and long-fasted dogs. Am. J. Physiol. 214, 313–319.
Turcotte, L. P., Richter, E. A. and Kiens, B. (1992). Increased plasma FFA
uptake and oxidation during prolonged exercise in trained versus untrained humans. Am. J. Physiol. Endocrinol. Metab. 262, E791–E799.
Weber, J.-M., Parkhouse, W. S., Dobson, G. P., Harman, J. C., Snow, D. H. and Hochachka, P. W. (1987). Lactate kinetics in exercising Thoroughbred horses: regulation of turnover rate in plasma. Am. J. Physiol.
Reg. Int. Comp. Physiol. 253, R896–R903.
Wolfe, R. R. (1992). Radioactive and Stable Isotope Tracers in Biomedicine.
Principles and Practice of Kinetic Analysis. New York: Wiley-Liss.
Wolfe, R. R., Klein, S., Carraro, F. and Weber, J.-M. (1990). Role of triglycerides-fatty acid cycle in controlling fat metabolism in humans during and after exercise. Am. J. Physiol. Endocrinol. Metab. 258, E382–E389. Wolfe, R. R., Peters, E. J., Klein, S., Holland, O. B., Rosenblatt, J. and