John R. Hesselink 1.2 Kee Hyun Chang 1 Kyung J. Chung2
.3 Lauren Abbate 1 Mitchell Goodsitt 1
Received June 21, 1983; accepted after revision August 23, 1985.
This work was supported in part by a grant from the Technicare Corporation, Solon, OH.
, Department of Radiology, Massachusetts Gen-eral Hospital and Harvard Medical School, Boston MA02115.
2 Present address: Department of Radiology, University of California at San Diego Medical Cen-ter, 225 W. Dickinson St.. San Diego CA 92103-9981. Address reprint requests to J. R. Hesselink. 3 Department of Pediatrics, Tufts University Med
-ical School, Boston. MA 02111.
AJNR 7:427-431, May/June 1986
0195-6108/86/0703-427
© American Society of Neuroradiology
Flow Analysis with Digital
Subtraction Angiography:
2. Acquisition and Accuracy of
Transit-Flow Measurements
A steady-state flow model was used to optimize methods of data analysis, to investigate variables that affect the time-density curves, and to determine the accuracy of transit-flow measurements with digital subtraction angiography, The most accurate data were obtained by using a small region of interest placed within the vessel, averaged data acquisition, and a gamma-variate fit applied to the time-density curve. The inte-grated area of the curve depended on the flow, vessel size, amount of iodine injected, framing rate, and the kVp. The integrated area was not affected by the mAs; the matrix size; or the volume, concentration, or rate of injection of the contrast material. Subject density, image intensifier mode, and field size did not affect the curves except for their contribution to scatter and beam hardening, There was good corrrelation between digital subtraction angiographic transit-flow measurements and known flow values.
Digital subtraction angiography (DSA) lends itself to flow analysis because the data are in a digital format. Regional density measurements of a series of consec-utive images can be rapidly calculated and displayed as time-density (T-D) curves. A flow model for use with DSA was described in our companion article [1]. Initial tests prove that the model gives reproducible results and responds appropriately to changing flow rates.
There are a number of operator-controlled variables associated with DSA flow analysis that affect the T-D curves and, thus, flow calculations. The integrated area of the T -D curves is inversely proportional to flow and directly related to the amount of iodine injected and the cross-sectional area of the vessel [2]. We conducted experiments to determine the effect of other variables, including methods of T-D curve analysis, kVp, mAs, framing rate, subject density, matrix size, and image-intensifier mode. Finally, the flow model was used to determine the accuracy of DSA transit-flow measurements in a controlled laboratory setting.
Methods
For the assessment of different methods of accumulating flow data, 10 DSA runs were performed with the flow model by using a standard technique of 70 kVp, 200 mA, and 0.024 sec. The images were acquired at 4 frames per sec for 10 sec on a 256 x 256 matrix with a 4-in. (1 O-cm) mode on the image intensifier. System flow was 59 ml per min, and the contrast media consisted of 0.35 ml of Hypaque 50 injected over 1 sec. These raw data were used to investigate the effects of size, shape, and position of the region of interest (ROI) upon T-D curves and to determine the relative accuracy of averaged versus total data collection. In each case, the integrated area was calculated after a gamma-variate fit was applied to the T-D curve. The data used to make the gamma-variate curve ranged from the point at which the data rose to 20% of the peak density through the peak at which the data fell back to 40%. To study the effect of variables on the integrated area of the T-D curves, we repeated the DSA runs and changed one variable each time. The variables studied included kVp, mAs, frame rate, subject density, matrix size, and image-intensifier mode.
428 HESSELINK ET AL. AJNR:7, May/June 1986
Fig. 1.-Time-density (T-D) curves were generated with different-sized regions of interest (A) using
both averaged data (8) and total data (C). With larger ROls, integrated curve area decreased for averaged
data but increased for total data.
I •.• I •.• 2
8 .• 8 .•
6 .• 6 .•
4.11 4 .•
2.11 2 .•
•. 11 •. 11
311 ell 311
3
I •.• 1 •. 11
8 .• 8 .•
6 .• 6.11
4 .• 4 .•
2 .• e.1I
.
.
.
2. 3..
.
.
2. 3.6
I •.• I •. '
8 .• 8 .•
6 .• 6 .•
4 .• 4 .•
2.11 2 .•
II .• 11.11
IfI 211 311 211 311
known flow values (ranging from 25 to 300 ml/min) and tubes of various diameters (2.3,4.7,6.2, and 7 mm). All other variables were kept constant.
Results
Methods of Accumulating T-O Curves
We selected a OSA run and placed different-sized ROI
boxes on the model tube or vessel and background areas to evaluate the effect of ROI size on the flow curves for both
averaged and total data (Fig. 1 A). With averaged data, the T-O curves decreased as the size of the ROI was increased
(Fig. 1 S, curves 1 through 4). The amplitudes of the
back-ground (curves 5 and 6) were the same for the small and
large ROls. The reverse effect was observed with total data. The T-O curves increased in size as the ROI was increased
(Fig. 1 C, curves 1 through 4). Furthermore, the background
amplitude was higher for the larger ROI (curves 5 and 6).
Increasing the height of the ROI increased the T-O curve with total data but had no effect on averaged data.
PLOT OF TOTAL YB. FRANE HUNBER PLOT OF TOTAL YB. FRANE HUNBER
I I!
611. 6.11
41111 41111
2f1f1 eflfl
II
IfI 28 38 18 e8 38
PLOT OF TOTAL YS. FRANE HUNBER PLOT OF TOTAL YS. FRANE HUNBER
3 4
6f1f1 6f1f1
4f1f1 488
..
eflfl•
8111 28 3. 8
PLOT OF TOTAL YB. FRANE HUNBER PLOT OF TOTAL YS. FRANE HUNBER
S 6
6.11 &fI8
4 •• 4f1f1
21111 21111
II
8 111 e8 38
With averaged data, the ROI was moved from side to side and longitudinally along the tube to measure the effect of ROI position. The diameter of the contrast column within the tube was approximately 5 pixels. When the ROI (1
x
2 pixels) wasshifted 1 pixel to the left or right of center, there was a 2.8% decrease in integrated area under the T-O curve. A 2-pixel shift to either side resulted in a 5.5% decrease in curve area. When an ROI box (3
x
3 pixels) was placed in five locations along the tube, the SO of the integrated areas of the five T-O curves was ±3.1 %.Finally, T -0 curves were generated for each of the 10 OSA
runs with averaged data and total data to determine which method gave more accurate flow measurements. For
aver-aged data, a 3
x
3 pixel ROI was placed within the model vessel, and for total data a 5x
8 pixel ROI was positioned to include the entire width of the vessel. The background wassubtracted in each case. Curve area was calculated by using
a gamma-variate fit as described in the previous section. The
% SO was ±4.49 for averaged data and ±6.85 for total data
100
•
•
80..
C'U
•
-
•
..
ell•
£
20
80 80 100
KVP (Varia"" iliA.)
Fig. 2.-As kVp was varied from 55 to 100, the mAs was adjusted to
maintain a constant exposure. As kVp increased, curve area decreased in a
nonlinear fashion. Steeper negative slope between 65 and 75 kVp reflects
k-edge of iodine with a polychromatic X-ray beam.
of the contrast density for the averaged data and 8% for the
total data.
Technical Variables
A direct linear correlation was found between the framing
rate and the integrated area of the T-D curves.
As the kVp was increased from 55 to 100, the integrated
curve area progressively decreased, but not in a linear fashion.
A distinct decline occurred between 65 and 75 kVp (Fig. 2).
Changing the mAs with a constant kVp resulted in no change
in the integated areas of the T-D curves.
A step-wedged phantom was placed over the model vessel
to simulate subject density. The subject density had no
ob-servable effect upon the T-D curves.
Finally, the DSA runs were obtained with matrix sizes of
128, 256, and 512, and with the 4-, 6-, and 9-in. (10-, 12.5-,
and 22.5-cm) modes on the image intensifier. Changing the
matrix size of the image-intensifier mode had no observable
effect upon the T-D curves.
Accuracy of DSA Transit Flow Measurements
Since Q
=
[(Av 1)/Ac]· k, where Q=
flow, Av=
cross-sectional area of the vessel, I = amount of iodine injected,
Ac
= integrated area of the T-D curve, the constant k can be
determined if the flow is known. The constant k was
deter-mined to be 5.3. Using this constant, we calculated flow
values from the multiple DSA runs obtained by varying flow and vessel size with other variables remaining constant. One
set of data was excluded because it was entirely inconsistent
with the others and could not be reproduced. A good
corre-lation was noted between the known and calculated flow
rates (r = 0.882) (Fig. 3).
Q)
ro
a:
3~
Oc
u:
'
E
'0 ...2'E
C\l~:::l
()
C\l
U
300
200
100
8
100 o
o o o
r = 0.882 o 9
Y
=
0.83x + 25.15N = 40
200
Actual Flow Rate
o
300
Fig. 3.-Comparison of calculated flow from the DSA curves with known
(actual) flow values. Diagonal line represents the line of identity.
Discussion
Our results show that the method of data acquisition affects
the T -0 curves and the flow data. With averaged-data
acqui-sition, the amplitudes of the T-D curves are inversely related
to ROI size (Fig. 18). This is to be expected because the
density numbers of all the pixels within the ROI are added
and the total is divided by the total number of pixels. Density
is directly proportional to the thickness and concentration of
the contrast material. Since the tube used in the experiments
is round, the pixels near the edge of the vessel measure a
smaller thickness of contrast material (Fig. 4). If the diameter
of the ROI is greater than that of the tube, the pixels without
contrast material are averaged with the pixels over the vessel,
resulting in a lower number.
With total-data acquisition, the density numbers of all the
pixels in the ROI are added together. Consequently, the
amplitudes of the T-D curves increase as the size of the ROI
increases (Fig. 1 C). When the ROI extends beyond the tube,
the amplitudes of T-D curves continue to increase because
more background noise is added. As the background ROI
increases, the amplitude of the background T-D curve
in-creases, whereas with averaged data, the ROI size does not
affect background curves.
Precise placement of the ROI over the tube is essential in
averaged-data acquisition. With a cylindrical tube 5 pixels in
diameter, a 1-pixel shift can result in underestimation of the
integrated curve area by 2.8%. Since there is also some
variation along the length of the tube, the ROI should be
placed in the same region each time. A number of factors
account for the regional variation: (1) regional differences in
photon flux and field differences along the imaging chain, (2)
stream-430 HESSELINK ET AL. AJNR:7, May/June 1986
Fig. 4.-Thickness of contrast viewed
by pixel. Centered pixel (A) thicker
seg-ment of contrast material than pixel near
the edge (B) of round vessel. Density
measurement of pixel in A would be
higher than pixel in B.
ing or nonideal flow, (4) finite frame rate and, (5) off-center positioning of the ROI. With a finite frame rate, the system
may sample slightly different portions of the contrast bolus
curve. A faster framing rate or continuous-mode DSA system
would be preferable. We were limited to a framing rate of 4
per sec because of a mechanical contact generator. With
regard to positioning, the ROI moves only on whole-pixel
shifts. Perfect centering of the ROlon the vessel would
require a fractional pixel shift. This would be less of a problem
with a larger matrix because the pixels are smaller.
Even after the contrast bolus passes the ROI, a tail in the
T -D curve occurs because the density measurements do not
return to baseline. This is caused by laminar flow and
turbu-lence. In the former, contrast material is moving faster in the
center of the vessel than adjacent to the wall, where it is
relatively stagnant and lags behind the main bolus. On the
other hand turbulence causes more mixing and dilution of
contrast material, which leads to broadening of the T-D curve.
Although there is uncertainty about how much of the tail
should be included when the curve area is integrated, a
gamma-variate fit produced the most consistent results.
More accurate results are obtained with averaged data
acquisition. DSA systems are inherently noisy. Average data
with a small ROI gives a higher signal-to-noise ratio. Back-ground subtraction eliminates much, but not all, of the error
caused by system noise, because system noise is random
and varies across the field of view. Furthermore, with a small
ROI, chance of including line-scan artifacts of the video
sys-tem is less likely. The use of a small ROI has a practical
advantage because less time is required to accumulate the
data. In a clinical setting, there is less likelihood of including
adjacent vessels when a small ROI is used and the data are
less influenced by misregistration. The optimal method for
acquisition of flow data with a Technicare DSA system is to:
(1) place a small ROI over the vessel to be studied, (2) use
averaged data, (3) apply background subtraction technique,
and (4) integrate the curve area after a gamma-variate fit.
Erroneous flow data are avoided by recognizing and
un-derstanding the effects of radiographic exposure factors on
T-D curves. Peak kilovoltage affects the density
measure-ments because radiographic contrast varies inversely with
kVp. Therefore, if the kVp is increased in DSA, the density
difference between a vessel filled with contrast agent and the
adjacent background decreases. As the density difference
decreases, the integrated curve area also decreases. The
rate of change of the integrated area is highest in the kVp
range of 65-75 (Fig. 2), and the portion of the curve reflects
the k-edge of iodine with a polychromatic X-ray beam.
One might expect that the mAs would also affect the DSA
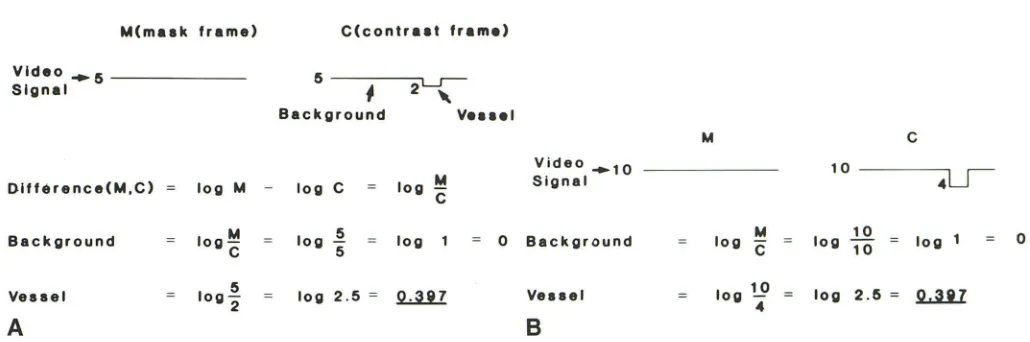
density measurements, because changes in the mAs alter density on radiographic film, fluoroscopy, and videodensi-tometry [2]. However, the data show that mAs does not affect the T -D curves obtained with DSA. Our DSA system loga-rithmically amplifies the video signal and uses a subtraction
technique. As shown in Figure 5, doubling the mAs results in
doubling of the pixel amplitudes in both the mask and contrast frames. However, the difference of the logs of the pixel
amplitudes is identical for the two mAs values. On the other
hand, if a linear subtraction processing is used, the mAs will affect the DSA density measurements. Most DSA systems use logarithmic processing.
Increasing subject density does not directly affect flow measurements, but it does introduce error by contributing to beam hardening and scatter. Similarly, increasing field size contributes to scatter. As pointed out by Shaw et al. [3],
beam hardening, X-ray scatter, and veiling glare are significant sources of error in DSA density measurements. All three factors suppress the iodine signal resulting in falsely low density measurements. The same group of investigators have reported a digital convolutional algorithm to correct for X-ray scattering and veiling glare [4].
Another source of error is imprecision in the measurement of the vessel diameter. A measurement error of 0,5 mm in a 5-mm vessel results in a 19% error in the flow calculation. Edge-detection algorithms have been developed for digital systems but were not useful for improving the accuracy of vessel measurement.
System drift was not a major problem in the DSA system. At least, density measurements of a phantom varied only by a % SD of ±4.3 over a 3-month period. Nevertheless, when flow values measured on different days are compared, it is advisable to standardize the measurements by determining the constant k on each day on which a flow study is to be done. Although our flow model is relatively simple, it does require time to set it up and thus would be impractical for that purpose. We have developed a mechanical flow model in our laboratory that could be conveniently used [5].
Measurement of the degree of arterial stenosis is less accurate on a digital image than on a conventional radi-ographic image because there is less spatial resolution in the former. However, determination of the degree of stenosis is imprecise even on conventional radiographs because the
residual lumen can be measured on only one projection.
Therefore, measuring the flow may be useful for establishing
the presence of a hemodynamically significant lesion. Our
results show good correlation between in vitro flow measure-ments made by DSA and actual flow rates.
Despite the demonstrated in vitro accuracy, measurement of flow with DSA systems has not yet gained clinical accept-ance. This delay results from the multiple variables and sources of error, which cause uncertainty in individual flow measurements in a clinical setting. Some of the variables that
affect absolute flow measurements can be eliminated by
measuring relative flow rates [6]. However, these require injection of contrast media into both the aorta and selectively into the vessel to be studied. In this case, the values are given as percentages of cardiac output.
assess-M(ma.k frame)
Video __ 5
-Signa'
Difference(M,C) log M
Background iog~
C
Ve •• el IOg~
2
A
C(contra.t fram.)
5----2-=-'~
~
"
Background V • • • • I
log C log M
C
log 5
5 log 0
log 2.5 = Ui1
C
Video -10
Signal 10
...
~Background log M log 10 log 1
C 10
Ve •• el log
u>
log 2.5=
2...ll.1...
B
Fig. 5.-Calculations for two different X-ray exposures. A. mAs,; B. mAs2 (= 2 mAs,). Change in mAs does not affect DSA density measurements.
ing carotid artery disease. Whether these methods use
rela-tive or absolute measurements, only flow at the site of
injec-tion is determined. If the injecinjec-tion is made in the common carotid artery, flow can be determined for that vessel only and not for the internal carotid and external carotid arteries.
Such information is of limited clinical value. A catheter must
be selectively placed in the internal carotid artery if flow in
that vessel is to be determined. This is hazardous in patients with disease of the carotid bifurcation, and flow determina-tions by this method are impossible.
REFERENCES
1. Hesselink JR. Chang KH, Chung KJ. Abbate l. Flow analysis with digital subtraction angiography: 1. description of a simplified
flow model. AJNR 1986;7:423-426
2. Lantz BMT, Foerster JM. Link DP, Holcroft JW. Determination
of relative blood flow in single arteries: new video dilution
tech-nique. AJR 1980;134: 1161-1168
3. Shaw CG, Ergun DL, VanLysel MS. et al. Quantitation techniques in digital subtraction video angiography. Digital Radiography 1981;314:121-129
4. Shaw CG, Ergun DL, Myerowitz PO, et al. Technique of scatter
and glare correction for video densitometric studies in digital
subtraction video angiography. Radiology 1982;142:209-213
5. Goodsitt MM, Abbate L, Hesselink JR. A solid bolus contrast
digital phantom for assessing the performance of digital
subtrac-tion angiography systems. Radiology (in press)
6. Lantz BMT, Dublin AB. McGahan JP, Link DP. Carotid blood
flow in man determined by video dilution technique: I. Theory,
procedure and normal values. AJNR 1981;2:511-516
[image:5.612.49.564.121.292.2]