Reactivating Spatial Stimulus Codes
in a Multi-Item Simon Task
Carsten Bundt
(s0167487)Supervisor:
Dr. Rob H. J. van der Lubbe*
Dr. Elger L. Abrahamse
Cognitive Psychology and Ergonomics
University of Twente
Date: 11-04-2011
*Corresponding author
Cognitive Psychology and Ergonomics, Faculty of Behavioral Sciences, University of Twente, Postbox 217, 7500 AE Enschede, The Netherlands.
Index
Abstract... 1
Samenvatting... ... 2
1. Introduction... 3
1.1. The attention-shifting approach... 3
1.2. The referential-coding approach... 4
1.3. EEG components are assumed to indicate the existence of spatial codes... 5
1.4. Reactivating spatial codes... 6
1.5. Research outline... 7
2. Method...8
2.1. Participants... 8
2.2. Apparatus and data recording... 8
2.3. Stimuli, task and procedure... 9
2.4. Response parameters... 10
2.5. EEG parameters... 10
2.6. Statistical instruments... 11
3. Results... 12
3.1. Response parameters... 12
3.1.1. Reaction times... 12
3.1.2. Response accuracy... 13
3.2. EEG parameters... 15
4. Discussion... 16
4.1. Behavioral results and its implications... 16
4.2. Electroencephalographic results and its implications... 17
4.3. Shifts of attention and TEC... 18
4.4. Is it just a matter of time?... 18
5. Conclusion... 20
References... 21
Abstract
Samenvatting
Responses zijn sneller als zij ruimtelijk met de target stimulus corresponderen dan als zij dat niet doen; hoewel de locatie van de stimuli voor de taak niet belangrijk is (i.e. Simon effect). De attention-shift hypothese verondersteld dat deze spatial codes door een verschuiving van attentie naar de target stimulus ontstaan. Daarentegen gaat die referential-coding hypothese
van uit dat spatial codes geproduceerd worden als het stimulus ten opzichte van een
1. Introduction
Responses that spatially correspond with the stimulus location are executed faster than incompatible stimulus-response combinations (Fitts & Seeger, 1935). A prominent variant of stimulus-response correspondence (SRC) effects is the Simon effect, which denotes that these correspondence effects even appear, when the location of the stimulus was task-irrelevant (e.g. Simon, 1969; Simon et al., 1967;1969).
As has been pointed out by Rubichi et al. (1997), most accounts of the Simon effect share two assumptions: 1) an irrelevant spatial stimulus code for the stimulus location is formed and 2) if there is enough similarity between stimulus and response dimensions, a response code will be formed automatically. Evidence for the latter assumption was provided by De Jong et al. (1994). To explain general SRC effects, they assumed that response dimensions are processed and activated via an unconditional (automatic) route, and relevant stimulus features via a conditional (i.e. controlled) route. If both routes generate similar codes, the correct response could be triggered faster than if both codes do not correspond. Furthermore, SRC effects do not depend on a particular hand, which is related to a specific stimulus, and eventually is used to make a response, rather, stimulus-response correspondence effects are dependent on the specific position of the response key (Wallace, 1971). But why and how are these irrelevant spatial codes formed? Two explanations have been proposed to answer this question.
1.1 The attention-shifting approach
The attention shift hypothesis proposed that forming a spatial code is dependent on shifts of attention, which are directed to the location of the (relevant) stimulus (see Wright et al., 1994, for a methodological overview of visual attention shifts). It was demonstrated that if it was not possible to shift attention from fixation to the relevant stimulus, no Simon effect (Nicoletti & Umiltá, 1994), or a substantially reduced effect was obtained (Stoffer & Yakin, 1994).
The critical role of attention in explaining the Simon effect is based on the Premotor
responses were faster in correctly cued conditions than in incorrectly cued conditions. Importantly, reaction times increased with distance relative to the cued location, but were exceptionally larger when the target appeared on the non-cued side. To explain this effect,
Rizolatti et al. thought of a program, which prepares for executing a motor response
(oculomotor program), but do not have to be executed. In their view, the direction parameter (left - right) was more time consuming than the distance parameter (far away - nearby), which would explain the correspondence effects of the Simon task (Rizzolatti, Riggio, Dascola & Umiltà, 1987), in that a valid cue led to a covert attentional shift, which, in turn, prepared for a motor response. Nowadays, the PMTA does not only account for preparatory oculomotor movements, rather it includes general motor movements (see e.g. Sheliga, Craighero, Riggio & Rizzolatti, 1997; Neggers & Bekkering, 2001).
1.2. The referential-coding approach
The second theoretical approach explaining the Simon effect is the referential-coding
hypothesis. This theory assumes that an attentional shift is not the crucial factor to produce a spatial code, but, in contrast, it depends on the formation of a spatial stimulus code, which is coded “in reference to an intentionally defined object or frame of reference” (Hommel, 1993, p. 209). To explain the origin of this reference frame, two theories were proposed (but see Lleras, Moore & Mordkoff, 2004).
One version assumes that the spatial code is determined by a reference frame, which depends on the fixation point. This assumption was supported by Zimba et al. (1995), who obtained a Simon effect, although the target location of the stimulus was identical with the attentional focus (i.e. the locus of attention), indicating that not the attentional focus, but the static fixation point was necessary for referential coding. Contrary to these findings, Proctor and Lu (1994) provided some evidence that the Simon effect is substantially reduced, when a fixation point is used, which suggests that the fixation point is not an optimal object to establish a reference frame upon it.
effects were dependent on the locus of attention. They found, that subdividing visual space with attention prevailed over other reference points (e.g. body midline, head midline etc.).
Hommel (1998) augmented his initial proposal of a reference frame, when he
suggested the concept of event files. Hommel´s conception of event files was an extension of
the theory of object files by Kahneman et al. (1992). In the latter study, participants had to respond to letters appearing on the screen. The target display (i.e. a letter) was preceded by a task-irrelevant display (preview field), which displayed two letters. If the task-irrelevant letter matched the target letter with respect to identity, participants responded slower than if the irrelevant letter matched the target letter with respect to identity and location. This suggested that location played a crucial role in coding for an object. However, Hommel (1998) thought that this approach by Kahneman et al. was too narrow. He assumed that not only codes, which are attributes of the stimulus itself are formed, but rather, that these codes are linked with features, which characterize a corresponding action.
In turn, these considerations led to the Theory of event Coding (TEC). TEC is based on
the assumption that “cognitive representations of events… subserve not only representational functions… but action-related functions as well.” (Hommel et al., 2001, p. 849). Thus, representations underlying perceptual stimuli are coded and stored within the same representational medium as the representations underlying action planning.
To sum up, two approaches have been proposed to explain the origin of irrelevant spatial codes in the Simon task. Following the attention-shifting account, a shift of attention to the relevant target creates the spatial code. In contrast, the referential-coding approach assumes that spatial codes were formed in reference to an intentionally defined object. For a detailed comparison of both theories, see Van der Lubbe & Abrahamse (2010).
1.3. EEG components are assumed to indicate the existence of spatial codes
Some studies suggested that the formation of spatial codes could be related to
electroencephalographic components. A prominent component is the PCN (Van der Lubbe et
al., 2001) (also referred to as N2pc): An enhanced posterior contralateral negativity, which
1994). Thus, this negativity only appears if one had to discriminate between stimuli and is assumed to be involved in suppression of irrelevant features (but Mazza et al., 2008). More recent studies found additional evidence emphasizing the importance of the PCN during attentional processes. In contrast to the assumption that the PCN reflects suppression mechanisms, Eimer (1996) found evidence that a PCN could be obtained with just one
distracter stimulus, suggesting that the PCN indicates attentional selectivity (i.e. the selection
of a specific stimulus via attentional mechanisms) and is less paradigm specific than previously thought (see also Kiss et al., 2008). To sum up, although there is no perfect consensus, based on previous results the PCN appears when relevant targets have to be discriminated between distracters, and when these targets are selected to eventually guide a specific response.
1.4. Reactivating spatial codes
Hommel (2002) proposed that the integration of spatial and nonspatial object information, and therefore the tendency to react towards a specific spatial location (i.e. the response code), could be reactivated after a short time interval. Even if the (target) stimuli would be absent, a cue could serve as a trigger to internally reactivate the integrated information. Hommel used a multi-item Simon task (see Method) and different SCOAs (Stimulus-Cue Onset Asynchrony) to examine his proposal. SCOAs are defined as the interval between stimulus and cue onset, which can be positive (stimulus appears first, the cue thereafter), negative (cue appears first, the stimulus thereafter), or neutral (stimulus and cue appear at the same time). Following Hommel´s presumption, the cueing of nonspatial object information (i.e. color) should lead to an automatic reactivation of spatial object codes, because they are both parts of the same event file. Therefore, direct activation of one feature of an event file automatically (and more or less indirectly) activates related features within this specific file. Consequently, (re-)activated spatial stimulus codes in combination with response dimensions should yield SRC effects, if Hommel´s considerations were correct. The reactivation of spatial codes and its relation with SRC effects were examined in the second
1.5. Research outline
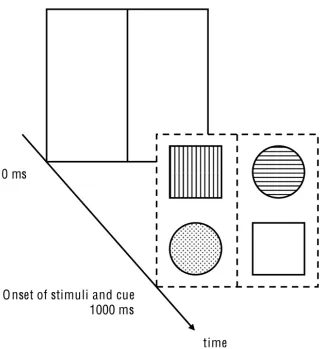
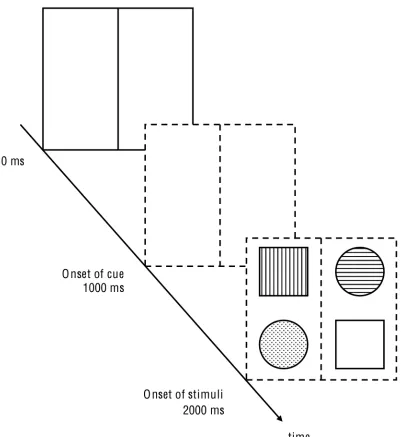
In the present study, we attempted to replicate the findings of Hommel (2002, Experiment 2). In our study, three SCOAs were employed, which were slightly modified compared to Hommel: First, a -1000 ms SCOA, in which the cue preceded the stimulus by 1000 milliseconds. Second, a 0 ms SCOA, in which the stimulus and cue were presented at the same time. And third, a 1000 ms SCOA, in which the stimulus preceded the cue by 1000 ms (see Appendix for an illustration). Due to the similar experimental setup, it was expected that the present study could replicate the main findings of Hommel (2002, Experiment 2). That is: SRC effects (i.e. Simon effect) could be found for each SCOA condition. Furthermore, because time is required to integrate object features into a coherent representation (e.g. Kahnehman, Treisman & Gibbs, 1992), reaction times should be greatest for the 0 ms SCOA condition and should decrease with increasing SCOA interval.
2. Method
2.1.Participants
Eighteen participants (students from the University of Twente; 13 women, 5 men) between 18 and 23 years old (mean age = 19.1, two left-handed, sixteen right-handed) took part in the study. They received course credits for their participation. All of them had normal or corrected-to-normal eye-vision, no neurological disorders and were not affected by color-blindness. Participants were naïve to the real purpose of the experiment and to the displayed stimuli. Every participant gave his/her approval by signing the informed consent preliminary to the study.
2.2. Apparatus and data recording
Participants were seated in an armchair in a shielded chamber, with a distance of approximately 50 cm in front of a 17” CRT monitor. The monitor was running at 60 Hz and had a screen resolution of 1024 x 768 pixel. A standard QWERY keyboard for response-inputs was used. Light was turned off during the experiment to prevent visual irritations.
Stimuli were presented with Neurobehavioral System Presentation (version 11.0)on a
personal computer (Intel P640, 3.2 GHz). Reaction time was measured using event-markers.
These contained information about stimulus and cue onset, as well as response time, and were sent to a second computer, which recorded the markers alongside with EEG and EOG waves using Brainvision Recorder (version 1.05) software.
EEG was recorded according to the 10/20 system from 25 Ag/AgCl ring electrodes located at Fpz, F7, P3, Fz, F4, F8, FC5, FC6, T7, C3, Cz, C4, T8, CP5, CP6, P7, P3, Pz, P4, P8, PO7, PO3, PO4, PO8 and Oz. Electrodes were referenced to both (i.e. left and right) mastoids electrodes. Vertical EOG was recorded from electrodes placed above and below the left eye, horizontal EOG from electrodes placed at the outer canthi of both eyes. EEG and EOG were amplified with a Quick-Amp amplifier (72 channels, DC). Electrode impedance
was kept below 10 kΩ. EEG and EOG were continuously recorded with a sampling rate of
1000 Hz and a resolution of 0.0715 Hz per electrode. A software-based high-cutoff filter at 200 Hz was used and a 50 Hz Notch filter was implemented. Trials with eye movements
exceeding +/- 60µV horizontally or +/- 150µV vertically during the first 200 ms after stimulus
2.3. Stimuli, task and procedure
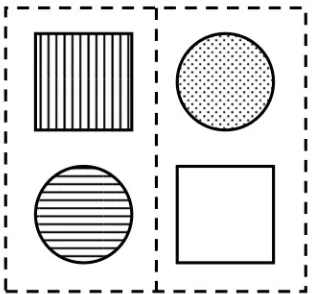
[image:11.595.75.231.447.594.2]In general, participants had to complete 684 trials, which were composed of three different conditions (32 test trials and 196 experimental trials per condition). Instructions and descriptions of the task were shown beforehand. Every condition was distinguished by having a different SCOA (Stimulus-Cue-Onset Asynchrony; 0 ms, 1000 ms, and -1000 ms respectively). Participants had the chance to pause between conditions, test and experimental blocks for a short period of time (less than two minutes). The background of the computer screen was black during the whole session. Trials were composed of a frame (124 mm x 106 mm) and four stimuli (two squares; two circles; 8.46 mm x 8.46 mm), which occupied the corners of the frame (every element of the same shape occupied the diagonally opposite corners of the frame). The distance between midlines (horizontal and vertical) and stimuli was 56 and 60 px respectively. The frame itself was subdivided by a vertical line. The vertical and horizontal midpoint of the frame was always represented by a fixation point, which the participants had to direct their gaze upon during trials. Stimuli were colored differently (blue, yellow, green, or red), as well as the frame, which cued the target stimulus with a corresponding color (see Figure 1 for a schematic example). Within the individual experimental blocks, every possible stimulus-cue combination was randomly tested.
Figure 1 Schematic illustration of the presentation of stimuli and cue. (Fixation point not shown).
fingers corresponded spatially with the specific response buttons (left index finger used left response key, right index finger used right response key). The individual trial ended, when the participant gave a response. Erroneous responses evoked a short textual feedback (“wrong”). Correct responses elicited no specific feedback.
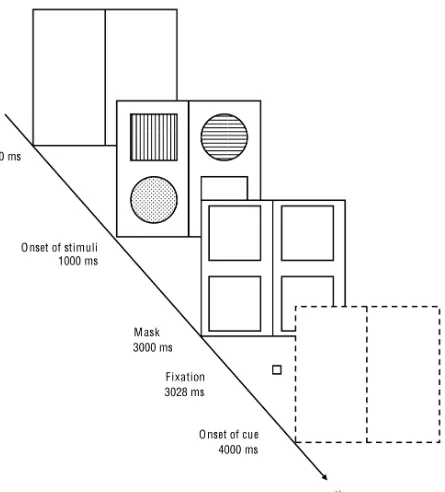
In the 1000 ms condition, the introducing white frame was followed by stimuli and a neutral frame (white frame). To avoid visual aftereffects, after two seconds a mask composed of four white squares was shown for 28 ms at the respective stimulus locations. Subsequently, only the fixation point was shown for 972 ms and was followed by the colored frame, which, again, cued the target stimuli (see Appendix, Figure 3).
A white frame also introduced the -1000 ms condition. After one second, the cue appeared and converged with the stimuli after another second (see Appendix, Figure 4). The order of individual SCOA conditions was counterbalanced among participants. That is, the first participant had to accomplish the condition with 0 ms, and then 1000 ms and -1000 ms. The second participant started with a SCOA of 1000 ms and continued with -1000 ms and so on.
2.4. Response parameters
Performance on the Simon task was subdivided into reaction time (RT) and proportion correct responses (PC). An average value of RTs and PCs was obtained per participant, SCOA condition and correspondency levels, and eventually computed into two discrete factors (SCOA and correspondency) with 2x3 levels (i.e. correspondence, noncorrespondence x -1000 ms, 0 ms, 1000 ms) as within-subjects variables. Repeated measures ANOVA was used to analyze previous factorial design. Subsequently, significant main effects were further
analyzed administering paired-samples t tests. A response was defined as premature, if the
participant responded to the relevant stimulus or cue by pressing the response key within 150 ms after stimulus/cue onset. Responses were counted as too slow, if the participant needed more than 2000 ms to respond. Response omissions, anticipations, as well as wrong responses were excluded from further analysis.
2.5. EEG parameters
yielding a general ERP wave, which indicated the general difference between ipsi- and contralateral hemisphere relative to the relevant stimulus side (for a similar procedure see: Oostenveld et al., 2001; Van der Lubbe et al., 2005; Wascher et al., 1996;). Activity was referenced to a baseline, which was defined as the mean amplitude of 100-0 ms interval
before stimulus onset. One sample t tests were used to analyze the mean amplitude per SCOA
condition for specific time intervals.
2.6. Statistical instruments
3. Results
[image:14.595.63.527.147.254.2]3.1. Response parameters 3.1.1. Reaction times
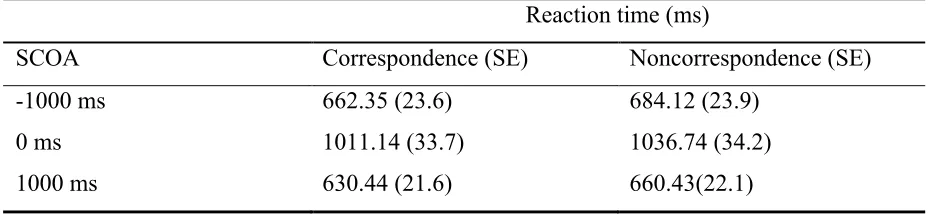
Table 1 Mean reaction times per SCOA and correspondency level with standard errors in parentheses.
Reaction time (ms)
SCOA Correspondence (SE) Noncorrespondence (SE)
-1000 ms 662.35 (23.6) 684.12 (23.9)
0 ms 1011.14 (33.7) 1036.74 (34.2)
1000 ms 630.44 (21.6) 660.43(22.1)
Overall response omissions were rare (0.9%), as well as anticipations (0%). A
significant main effect was found for SCOA (F(2, 34) = 125.16, p < .01), which indicated that
reaction times were different for individual stimulus-cue delays and became faster with longer SCOAs (Table 1). Moreover, a significant effect of correspondency per SCOA intervals was
found (F(1, 17) = 24.45, p < .01), suggesting that reaction times were faster for corresponding
than for noncorresponding trials, which indicates a Simon effect (see Table 1). However, no
interaction between correspondency and SCOA interval (F(2, 34) = 0.2, p > .05) was
obtained, which suggested that individual SCOA intervals did not modulate the magnitude of the Simon effect (see Figure 5). To examine the exact relationship between the specific
SCOA conditions, paired-samples t tests were employed. The tests revealed significant
differences between 0 ms SCOA and 1000 ms SCOA (t(17) = 12.81, p < .001) as well as
between a SCOA of 0 ms and -1000 ms (t(17) = 12.34, p < .001). However, no significance
was found comparing 1000 ms SCOA and -1000 ms SCOA (t(17) = -1.3, p > .05), illustrating
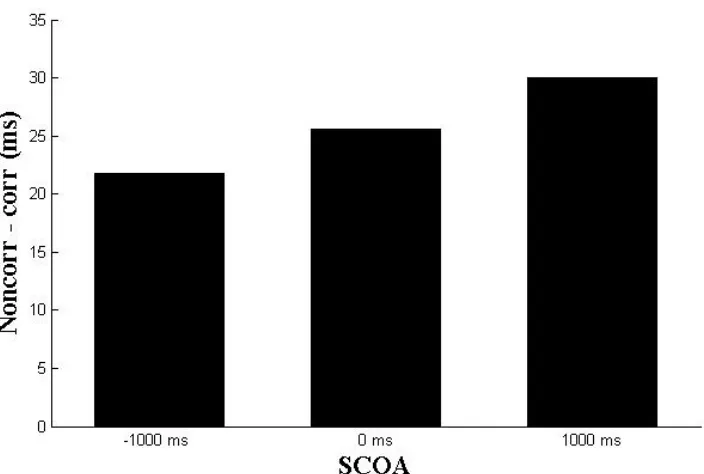
Figure 5 Differential reaction times for individual SCOA intervals in milliseconds. Reaction times
were computed by substituting the mean reaction time of corresponding trials from noncorresponding trials, indicating substantial Simon effects. The magnitude of the Simon effects did not differ significantly across conditions, suggesting that SCOA did not modulate stimulus-response correspondence effects.
3.1.2. Response accuracy
A significant main effect was found for SCOA (F(2,34) = 7.57, p < .01) and for
correspondency (F(1,17) = 19.95, p < . 001), indicating that the proportion correct responses
depended on SCOA condition as well as the level of correspondency. A slightly significant interaction between both variables (i.e. SCOA and correspondency) was found as well
(F(2,34) = 3.61, p < .04), suggesting that accuracy per correspondency level did depend on
individual SCOA conditions (see Figure 6).
Paired-samples t tests for SCOA conditions resulted in a significant effect comparing
-1000 ms and 0 ms SCOA conditions (t(17) = -3.93, p < .01) and -1000 ms and 1000 ms
SCOA conditions (t(17) = 2.29, p < .05), indicating that the proportion of correct responses
was significantly higher for the -1000 SCOA interval (Table 2).
Additionally, paired-samples t tests revealed that the comparison between
correspondency levels within the -1000 ms SCOA condition (t(17) = 5.05, p < .001) as well as
within the 0 ms SCOA condition (t(17) = 3.79, p < .001) reached significance. This showed
that for the -1000 ms and 0 ms SCOA condition the percentages of correct responses of corresponding trials was significantly higher than for noncorresponding trials. When
analyzing the effect of SCOA within the specific correspondency level (i.e. correspondence),
[image:15.595.111.463.91.328.2]< .01) as well as the 1000 ms and -1000 ms condition (t(17) = -3.61, p < .01), indicating that participants responded in the -1000 ms condition significantly more accurate than in the other conditions.
The comparison between SCOA condition and the noncorrespondence levels indicated
a significant effect comparing 0 ms and -1000 ms condition (t(17) = -3.23, p < .01), revealing
[image:16.595.64.525.266.372.2]that in noncorresponding trials, responses of the -1000 ms condition were more precise than in the 0 ms condition, but were not different from responses in the 1000 ms condition.
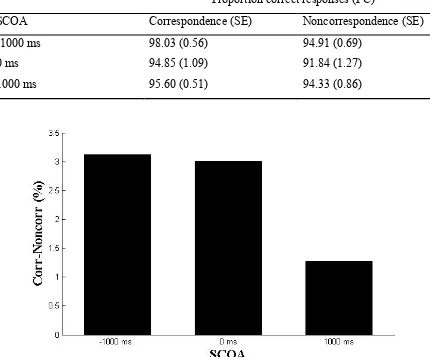
Table 2 Proportion correct responses (PC) per SCOA and correspondency level with standard errors in parentheses.
Proportion correct responses (PC)
SCOA Correspondence (SE) Noncorrespondence (SE)
-1000 ms 98.03 (0.56) 94.91 (0.69)
0 ms 94.85 (1.09) 91.84 (1.27)
1000 ms 95.60 (0.51) 94.33 (0.86)
Figure 6 Differential scores of proportion correct responses (PC) for individual SCOA intervals. PCs
[image:16.595.75.505.271.628.2]3.2. EEG parameters
Figure 7 (see Appendix) depicts the stimulus-locked ERL waveforms per SCOA interval. At t=0 the relevant stimulus (-1000 ms SCOA), cue (1000 ms SCOA) or both (0 ms SCOA) were presented. The -1000 ms SCOA is represented by a bold dotted line, the 0 ms SCOA condition by a thin line and the 1000 ms SCOA condition by a thin dotted line.
A moderate negativity can be observed for the 0 ms SCOA condition in the 60 ms –
200 ms time range. One-tailed t tests revealed a significant deviation from baseline (t(17) =
-4.34, p < .001 ), indicating a PCN.
Furthermore, a large negativity can be seen for the -1000 ms SCOA condition from
approximately 170-290 ms. One-tailed t tests revealed that the mean amplitudes of the -1000
ms SCOA condition differed significantly from baseline (t(17) = -5.30, p < .001).
Another moderate negativity was found for the 400-600 ms time range of the 0 ms SCOA condition. Analysis of the mean amplitude of this interval suggested that the 0 ms
SCOA condition differed significantly from baseline (t(17) = -4.80, p < .001) indicating a
PCN. Mean amplitudes for -1000 ms SCOA condition were significant as well (t(17) = 1.85,
p < .05), which presumably was due to the depolarization following the previous PCN at
170-290 ms.
Thus, results clearly indicated moderate PCNs for the -1000 ms SCOA condition in the 60 - 200 ms and 400 – 600 ms time ranges, and an unambiguous PCN for the -1000 ms condition in the 170 – 290 ms time range. Importantly, no PCN could have been obtained
when investigating mean amplitudes of the reactivation condition (i.e. SCOA of 1000 ms) (p
> .05).
4. Discussion
4.1. Behavioral results and its implications
Behavioral results indicated correspondence effects for every individual SCOA interval. That is, every individual SCOA condition was accompanied by a Simon effect. Importantly, even the 1000 ms SCOA interval elicited correspondence effects, which suggested that a cue, which comprised a specific stimulus feature (i.e. color), could trigger other stimulus features as well. In other words, the presence of perceptual features of a relevant stimulus is not necessarily required to yield stimulus-response correspondence effects. Stimulus-response correspondence was also obtained when stimulus features were absent and had to be selected from memory. This in turn suggested that (at least) stimulus features like color and form were closely tied to the response code of the object and both ‘dimensions’ were implemented as a whole.
However, the size of the Simon effects was not significantly affected by stimulus-cue
intervals (p > .05). Even when using postcues, a reliable Simon effect was obtained (30 ms).
This represents a successful replication of Hommel´s (2002, Experiment 2) findings, but at the same time it disfavors the assumption of spontaneous decay of correspondence effects when stimulus information is delayed (Hommel, 1994). Following Van der Lubbe and Abrahamse (2010), because TEC assumes that stimulus and spatial codes were formed at the same time, the implication is that these codes necessarily decay simultaneously right after they had been created. In contrast to TEC, PMTA assumes that the formation of spatial codes depends on a shift of attention. Therefore, the attentional selection of a certain stimulus indicates the starting point where decay sets off. Because no effect of decay could be observed across conditions, present behavioral results clearly correspond with assumptions made by PMTA.
In a sense, the decay effect could be observed when examining PCs. That is, only the
reactivation condition (1000 ms SCOA) indicated no significance comparing PCs of
that was triggered by an attentional shift. Thus, these results provide further and strong evidence for the assumptions made by PMTA, and at the same time favoring its broader application (e.g. Sheliga, Craighero, Riggio & Rizzolatti, 1997; Neggers & Bekkering, 2001).
In contrast, the reactivation condition (1000 ms SCOA) indicated that attention was not shifted (i.e. no PCN; see section 4.2.). Interestingly, in this condition the PCs did not differ significantly. If the considerations mentioned beforehand were correct, this could further support the findings of electroencephalographic measures: attentional shifts were not involved and therefore, no significant difference for PCs could have been obtained. This would imply that a different and more reliable process integrated object information and that this process should have elicited the non-significance between PCs in the reactivation condition. Interpreting these findings in line with the assumptions of TEC, spatial stimulus codes could be reactivated more reliably, because they were processed equally strong due to multiple object files. That is, the inherent “ballistic” component of attentional shifts and therefore the responses triggered by them is reduced in TEC. In this vein, it seems that in the present study the processes, by which spatial codes were generated, were due to two qualitative different processes.
4.2. Electroencephalographic results and its implications
As mentioned before, electroencephalographic results did not indicate an attention shift within the reactivation condition. That is, no PCN could have been obtained, when the target stimulus disappeared before it was cued and therefore the arrangement of stimuli had to be remembered until the cue appeared.
In contrast, when examining electroencephalographic results of -1000 ms and 0 ms SCOA condition (cue preceded stimuli; cue and stimuli appeared at the same time) PCNs for both conditions clearly indicate the involvement of attentional shifts. An unambiguous PCN could be found during the time interval of 170 – 290 ms for the -1000 ms SCOA condition. The presence of the PCN accords with the conceptions Eimer (1996), Kiss et al. (2008) and Luck et al. (1994) have about its role. That is, the suppression and/or selection of the relevant stimulus elicited a PCN, thereby indicating the creation of spatial codes.
occurrence of the PCNs nicely accords with the moment of responding. That is, responses in the -1000 ms condition were executed approximately 400 ms after the PCN (elicited by relevant stimuli) occurred. The same PCN-response relationship was true for the 0 ms condition.
4.3. Shifts of attention and TEC
Although present results are partially in line with the assumptions made by PMTA, it is possible that a shift of spatial attention could be interpreted in accordance with TEC. Eimer (1995) suggested that SRC effects could be obtained if the relevant stimulus had a spatial left-right meaning but was presented centrally. Therefore, following Van der Lubbe and Abrahamse (2010), a shift of attention could indicate a reorientation of the reference frame (i.e. from fixation to target stimulus). Subsequently, spatial codes were formed on the basis of the left-right meaning of the new reference frame. In this vein, the attentional shift would be involved in changing the reference frame, but would become causal unnecessary for the creation of the spatial code. However, if this was the case, attention had to fulfill multiple roles within a rather short time window (i.e. focusing on the fixation point, shifting attention to the relevant target, establishing a reference frame on it, and generating the spatial code). Due to reasons of parsimony and because PMTA assumes that the attentional shift directly creates the spatial codes, TEC should be disfavored as an interpretation for the occurrence of attention-shifts.
4.4. Is it just a matter of time?
Overall, results do not provide evidence for just one single theory (i.e. TEC or
PMTA). Results of the -1000 ms and 0 ms SCOA condition clearly favor an interpretation, which is in line with PMTA. On the other hand, behavioral and electroencephalographic results of the reactivation condition (1000 ms SCOA) were more in accordance with the assumptions made by TEC. Thus, how could present findings help to elucidate the issue of explaining the Simon effect and its underlying mechanisms?
The crucial factor of the study at hand, that discriminated conditions, was time (i.e.
different SCOAs). Incorporating time as a determinant of stimulus processing, it might becomes possible to explain the appearance of the PCN in the -1000 and 0 ms SCOA condition, as well as the non-appearance in the 1000 ms condition.
participant to “look out” for the target stimulus (cf. Treisman & Gelade, 1980; Wolfe, 1994). Selective attentional mechanisms (i.e. PCN) were required to successfully identify the correct stimulus by suppressing irrelevant ones (e.g. Eimer, 1996; Kiss et al., 2008; Luck, 1995).
Importantly, it is also conceivable that these attentional mechanisms were required because
the cognitive system was forced to make a fast decision (i.e. giving the correct response). Thus it was neither possible, nor necessary to process every stimulus completely. Selective attention immediately enabled participants to focus on the relevant stimulus features (i.e. color) and process this particular object further to give the correct response. Thus in a way, selective attentional mechanisms were obtained when the stimuli were not processed beforehand, but had to be selected right when they appeared.
In contrast, the 1000 ms SCOA condition differed from other conditions in that the cue appeared 1000 ms after stimuli-offset and the target stimulus had to be retrieved from memory. One possible explanation for the non-appearance of a PCN in this condition is the length of the SCOA interval. Possibly, the length of SCOA and therefore the time the cognitive system had to process stimuli (in total: 3 seconds), determined the cognitive process, with which stimuli are integrated. A SCOA of 1000 ms allows for stimuli, which are processed (relative) completely. In this case, the TEC would be an acceptable framework explaining the Simon effect; a shift of attention was simply not necessary, because the cognitive system had enough time to process stimulus-features and spatial codes completely. In contrast, when SCOAs were short(er), reactivation possibly could elicit selective attentional mechanisms due to the incomplete processing of stimulus-features and response-codes and the necessity for the cognitive system to direct further processing resources to the relevant stimulus.
The result could be a two-level Simon effect: In that early Simon effects, which were obtained due to time pressure, were determined by mechanisms explained by the attention shifting account. And late Simon effects were dependent on complete and terminated processing of stimuli as explained by the referential-coding approach.
5. Conclusion
References
De Jong, R., Liang, C.-C., & Lauber, E. (1994). Conditional and unconditional automaticity: a
dual-process model of effects of spatial stimulus-response correspondance. Journal of
Experimental Psychology: Human Perception and Performance, 20,731-750.
Eimer, M. (1995). Stimulus-response compatibility and automatic response activation:
Evidence form psychophysiological studies. Journal of Experimental Psychology:
Human Perception and Performance, 21, 837-854.
Eimer, M. (1996). The N2pc component as an indicator for attentional selectivity.
Electroencephalography and clinical Neurophysiology, 99, 225-234.
Fitts, P. M., & Seeger, C. M. (1953). S-R compatibility: spatial characteristics of stimulus and
response codes. Journal of Experimental Psychology, 46, 199-210.
Hommel, B. (1993). The role of attention for the Simon effect. Psychological Research, 55,
208-222.
Hommel, B. (1994). Spontaneous decay of response code activation. Psychological Research,
56, 261-268.
Hommel, B. (1998). Event Files: Evidence for Automatic Integration of Stimulus-Response
Episodes. Visual Cognition, 5, 183-216.
Hommel, B. (2002). Responding to object files: Automatic integration of spatial information
revealed by stimulus-response compatibility effects. The Quarterly Journal of
Experimental Psychology, 55A, 567-580.
Hommel, B., Müsseler, J., Aschersleben, G., & Prinz, W. (2001). The Theory of Event
Coding (TEC): A framework for perception and action planning. Behavioral and Brain
Sciences, 24, 849-937.
Kahneman, D., Treisman, A., & Gibbs, B. J. (1992). The reviewing of object files:
Object-specific integration of information. Cognitive Psychology, 24, 175-219.
Kiss, M., van Velzen, J., & Eimer, M. (2008). The N2pc component and its links to attention
shifts and spatially selective visual processing. Psychophysiology, 45, 240-249.
Lleras, A., Moore, C. M., & Mordkoff, J. T. (2004). Looking for the source of the Simon
effect: Evidence for multiple Codes. The American Journal of Psychology, 117,531-542.
Luck, S. J. (1995). Multiple mechanisms of visual-spatial attention: recent evidence from
human electrophysiology. Behavioural Brain Research, 71, 113-123.
Luck, S. J., & Hillyard, S. A. (1994). Spatial filtering during visual search: Evidence from
human electrophysiology. Journal of Experimental Psychology. Human Perception and
Mazza, V., Turatto, M., & Caramazza, A. (2009). Attention selection, distractor suppression
and N2pc. Cortex, 45, 879-890.
Neggers, S.F.W., & Bekkering, H. (2001). Gaze anchoring to a pointing target is present
during the pointing movement and is driven by a non-visual signal. Journal of
Neurophysiology, 86,961-970.
Nicoletti, R., & Umiltá, C. (1987). Splitting visual space with attention. Journal of
Experimental Psychology: Human Perception and performance, 15, 164-169.
Nicoletti, R., & Umiltá, C. (1994). Attention shifts produce spatial stimulus codes.
Psychological Research, 56, 144-150.
Oostenveld, R., Praamstra, P., Stegeman, D.F., & Van Oosterom, A. (2001). Overlap of attention and movement-related activity in lateralized event-related brain potentials.
Clinical Neurophysiology, 112,477–484.
Proctor, R. W., & Lu, C.-H. (1994). Referential coding and attention-shifting accounts of the
Simon effect. Psychological Research, 56,185-195.
Rizzolatti, G., Riggio, L., Dascola, I., & Umiltà, C. (1987). Reorienting of attention across the horizontal and vertical meridians: Evidence in favor of a premotor theory of attention.
Neuropsychologica, 25, 31-40.
Rubichi, S., Nicoletti, R., Iani, C., & Umiltá, C. (1997). The Simon effect occurs relative to
the direction of an attention shift. Journal of Experimental Psychology: Human
Perception and Performance, 23,1353-1364.
Sheliga, B. M., Craighero, L., Riggio, L., & Rizzolatti, G. (1997). Effects of spatial attention
on directional manual and ocular responses. Experimental Brain Research, 144, 339-
351.
Simon , J. R. (1969). Reactions towards the source of stimulation. Journal of Experimental
Psychology, 81, 174-176.
Simon, J. R., & Rudell, A. P. (1967). Auditory S-R compatibility: The effect of an irrelevant
cue on information processing. Journal of Applied Psychology, 51, 300 – 304.
Simon, J. R., & Small, A. M., Jr. (1969). Processing auditory information: Interference from
an irrelevant cue. Journal of Applied Psychology, 53, 433-435.
Stoffer, T. H. (1991). Attentional focusing and spatial stimulus-response compatibility.
Psychological Research, 53, 127-135.
Stoffer, T. H., & Yakin, A. R. (1994). The functional role of attention for spatial coding in the
Treisman, A., & Gelade, G. (1980). A Feature-Integration Theory of Attention. Cognitive Psychology, 12, 97-136.
Valle-Inclán, F., Hackley, S. A., & de Labra, C. (2003). Stimulus-response compatibility between stimulated eye and response location: implications for attentional accounts of the
Simon effect. Psychological Research, 67, 240-243.
Van der Lubbe, R. H. J., & Abrahamse, E. L. (2010). The premotor theory of attention and the
Simon effect. Acta Psychologica, doi:10.1016/j.actpsy.2010.09.007.
Van der Lubbe, R. H. J., Jaśkowski, P., & Verleger, R. (2005). Mechanisms underlying
spatial coding in a multiple-item Simon task. Psychological Research, 69, 179-190.
Van der Lubbe, R.H.J., Jaśkowski, P., Wauschkuhn, B., & Verleger, R. (2001). Influence of
time pressure in a simple response, a choice-by-location task, and the Simon task.
Journal of Psychophysiology, 15, 241-255.
Wallace, R. J. (1971). S-R compatibility and the idea of a response code. Journal of
Experimental Psychology, 88, 354-360.
Wascher, E., & Wauschkuhn, B. (1996). The interaction of stimulus- and response-related
processes measured by event-related lateralizations of the EEG. Electroencephalography
and Clinical Neurophysiology, 99,149–162.
Weeks, D. J., Chua, R., & Hamblin, K. (1996). Attention shifts and the Simon effect. A
failure to replicate Stoffer (1991). Psychological Research, 58, 246-253.
Wolfe, J. (1994). Guided Search 2.0. A revised model of visual search. Psychonomic Bulletin
& Review, 1, 202-238.
Wright, R. D., & Ward, L. M. (1994). Shifts of visual attention: an historical and
methodological overview. Canadian Journal of Experimental Psychology, 48, 151-166.
Zimba, L. D., & Brito, C. F. (1995). Attention precuing and Simon effects: A test of the
Appendix
Fi gu re 7 St im ul us -lo ck ed e ve nt -re la te d la te ra li za ti on s (E R L s) fo r oc ci pi to -te m po ra l ele ctr od e pa ir P O 7/8 . T he ve rt ic al dot te d lin e at t = 0 m s in dic ate s th e on se t of th e stim ulu s or c ue r es pe ctiv ely . T ha t i s, f or t he -1000 m s S C O A c ondi ti on (bol d dot te d li ne ) t = 0 m s indi ca te s the ons et of th e stim uli; fo r th e 0 m s S C O A c on ditio n (th in lin e) , at t = 0 m s bo th s tim uli an d cu e ap pe ar ed a t th e sa m e tim e; an d fo r th e 10 00 m s S C O A co nd it io n (t hi n do tt ed li ne) , at t = 0 m s on ly th e c ue a pp ea re d a fte
r it w