'1 4 figures
mted in Great Britain
CONTINUOUS EVALUATION OF P
fl>OiIN FISH:
RECORDING AND DATA PROCESSING
BY ALAIN BELAUD, YVES TROTTER AND CLAUDE PEYRAUD
Laboratoire de Physiologic animale*, Faculti des Sciences et Techniques, Brest, France
{Received 2 November 1978)
SUMMARY
1. In the eel (Anguilla anguxlla L.), the dorsal and ventral aortas and the subhepatic vein were catheterized to provide an external circulatory shunt. Po, m tn e shunted blood was continuously recorded using a polarographic measuring device.
2. Spontaneous interruptions in the eel's ventilatory activity result in rapid changes in Pa Oi. The period of these Pa Ot oscillations is sometimes
less than 1 min. However, the response time of the measuring system is so great under the conditions of these experiments that only slow variations of
Pa o^ of a period greater than 5 min, are faithfully recorded.
3. In view of the impractibility of technical improvement in the recording system, a data processing method was developed to reconstitute the real physiological variations from the distorted experimental recordings.
4. Through this method of data correction, it is demonstrated that apnoeic or active ventilatory phases in the eel's breathing pattern are not triggered by constant low values of Pa> Oj. Other physiological applications are suggested.
INTRODUCTION
Several authors had observed that ventilation in the eel is spontaneously inter-rupted by periods of apnoea (Van Dam, 1938; Steen & Kruysse, 1964; Belaud, 1975). This ventilatory pattern results in rapid variations in blood pH, Pco, an<l Pot
-Water breathing poikilotherms exposed to changes in enviromental factors (such as temperature, Pw Oi, Pw COi) may also exhibit large and sudden variations in blood
characteristics (Dejours, 1972; Dejours, 1973; Dejours & Armand, 1973). Similar variations may be induced by changes in the internal milieu (e.g. injection of catecho-lamines (Peyraud-Waitzenegger, 1978)). These few examples demonstrate the need for continuous, accurate measurement of various blood characteristics.
Blood pH, PO j and PQQ, have been continuously recorded in mammals, either by miniature catheterizable probes (Kreuzer, Harris & Nessler, i960; Schuler, 1966), or by installing an external circulatory shunt permitting uninterrupted blood flow into a measuring chamber. In both cases the problem of response time of the probes must be taken into account; however, the latter technique has the advantage
owing frequent calibration of the measuring system.
322 A. BELAUD, Y. TROTTER AND C. PEYRAUD
Implanting miniature electrodes in fish presents two difficulties: the size oft™ probes, which are of the same order as the blood vessels, and the necessity of re-calibrating the system, following temperature changes for example. At present, the chronic miniature electrode implantation method does not appear feasible, and only measurements made in an external circulatory shunt seem adequate for the continuous study of blood characteristics in fish.
The external circulatory shunt of the fish is characterized by a relatively small blood flow in comparison with that of large mammals, and by a much lower and more variable temperature (0-30 °C). These two factors result in a lengthening of the response time of the measuring electrode (Schuler, 1966), which would thus appear inadequate for following rapid variations of blood PO f.
The purpose of the present article is thus (1) to define the limits of validity of the recordings, continuously performed in an external circulatory shunt in the fish; and (2) in view of the impossibility of improving the technique itself, to provide a mathe-matical treatment of the recording, which should increase the validity and thus the range of application of this method. This technique will be illustrated by a study of the rapid variation in PO i in the arterial blood in a fish which exhibits intermittent ventilation. Adaptations of the techniques for other physiological applications are suggested.
MATERIALS AND METHODS
Ten eels {Anguilla anguilla L.) were used. Their weight ranged between 300 and 500 g. and the fish were maintained at all times at a temperature of 15 ± 1 °C.
The technique for chronic catheterization of the fish's ventral or dorsal aorta and the intestinal or subhepatic vein has been described previously (Smith & Bell, 1964; Randall & Stevens, 1967; Chan et al. 1967; Garey, 1969; Kirsch, 1971; Belaud, 1975; Payraud-Waitzenegger, 1978). Eels were anaesthetized with 3 % ethyl carbamate in water, and, during surgery, the gills were irrigated with the air-equilibrated anaes-thetic solution. The ventral and dorsal aortas and the subhepatic vein were fitted with catheters permitting blood withdrawal or re-injection. Electrodes recording ventilatory activity were attached to each gill cover (Belaud, Peyraud-Waitzenegger & Peyraud, 1971). In order to prevent blockage of the catheters, heparin (100 i.u. ml"1 in eel physiological solution) was administered through the implanted catheter; the total daily dose being 1000 i.u. kg-1. The eels were allowed a recovery period of several days in an aquarium supplied with well-aerated water.
During the experiments, blood passed via the aortic catheter (ventral or dorsal) through the Po -measuring cell and returned to the animal via the venous catheter. The thermostatted measuring cell (Radiometer D616) equipped with a polarographic electrode (Radiometer E5046) sensitive to oxygen partial pressure, was previously filled either with heparinized physiological saline (heparin concentration: 100 i.u. ml-1) or with heparin-treated blood from other eels. No transfusion incompatibility was observed.
Continuous PB>o, measurement 323
[image:3.451.80.360.41.264.2]Rec.
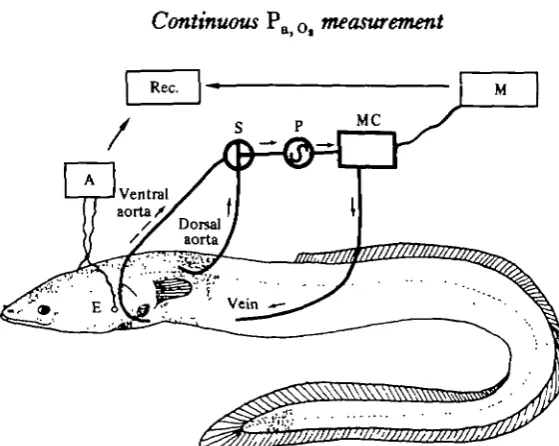
Fig. 1. Diagram of the measuring system. E, Electrodes for recording ventilation; A, amplifier; Rec., recorder; S, stopcock for selecting either dorsal or ventral aortic blood; P, peristaltic pump
ml min"1 constant flow rate); MC, measuring cell; M, P
same temperature using mixtures of known gaseous composition obtained by Wosthoff pumps.
Blood PO l and opercular movements were recorded simultaneously on a pen recorder and tape recorder. The data were later treated using a Hewlett-Packard 9825 A calculator.
RESULTS AND DISCUSSION
(1) Characteristics of the blood POt value measured via an
extracorporeal arterio-venous shunt
An example of the continuous recordings is shown in Fig. 2. The lower trace (curve 1) shows the apparent Pa Ol-value in the dorsal aorta, and the opercular
move-ments are shown in the upper trace. These recordings were obtained simultaneously from an eel weighing 420 g, maintained in air-equilibrated water at 15 °C.
In the course of this 8 min recording, the apparent Pa> Ol value ranged between
30 and 75 torr. The Pa Ol trace shows more or less marked oscillations due to the
intermittent ventilatory activity. Inspection of the ventilation and Pa Ol traces reveals
that a given Po_ Oi oscillation corresponds to a change in ventilatory activity which occurred approximately 65 s previously. This latency, a result of the transit time of the blood between the gills and the measuring chamber, depends on the geometry of the system, which thus must be determined for each experiment performed.
Fig. 3 shows what happens when, in an eel exhibiting a regular and continuous ventilatory pattern, the dorsal aortic blood is suddenly replaced by ventral aortic blood at the entry to the measuring system (three-way stopcock switch, Fig. 1). u r to the change, the Pa< Ol value was stable at 88 torr; after about 3 min, the Pa Ol
324 A. BELAUD, Y. TROTTER AND C. PEYRAUD
8 Time (min)
Fig. 2. Simultaneous records of the ventilatory movements (upper trace) and the apparent
Pa,ot (curve i) from a 420 g eel breathing air-equilibrated water at 15 °C. In relation to the
interrupted ventilatory pattern, curve 1 shows fluctuations occurring with a latency of about 65 s, corresponding to the delay in circulation along the catheters. Curve 2 is a plot of the calculated effective values for Pa,ot at the implanted tip of the arterial catheter. Like the
ventila-tory activity, curve 2 shows marked oscillations, but it is clear that apnoeic or active ventilaventila-tory phases do not always coincide with a constant level of P8 i 0,.
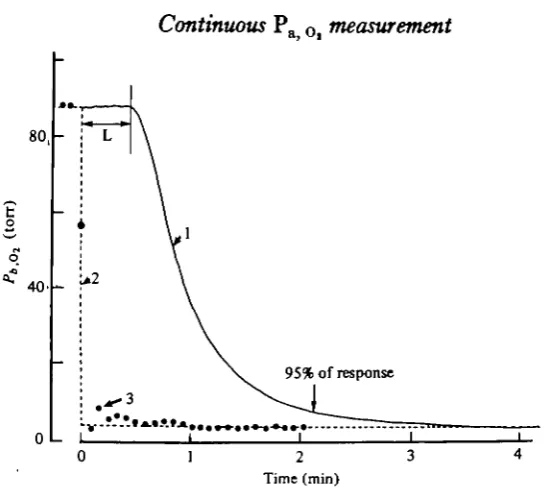
the beginning of the response was 28 s in this experiment, less than that shown in Fig. 2, since the catheter was shorter. The solid line in Fig. 3, curve 1, represents the untreated recorded values which result from the quasi-instantaneous input change in the POt value shown in the dashed curve 2. Comparison of curves 1 and 2 reveals
that the time for a 95 % response was approximately 100 s which cannot be considered negligible in comparison with the period of the natural Pa Ol oscillations shown in
Fig. 2. Thus, Fig. 3 indicates the limits of validity of this measuring technique, which, in its present state, is only adequate for the study of very slow variations of
Pa< Ot having a periodicity of approximately 5 min.
Data derived from experiments with ten different eels, using different catheters and electrodes equipped with propylene membranes of different ageing times show that the recorded POi curve for a switch from dorsal to ventral aorta blood (Fig. 3) varied
from one experiment to another. These curves, unique for each experiment, all show a characteristic exponential decline differing only in the time constant. The response time of the system, determined in situ by sudden substitution of venous for arterial blood entering the measuring cell, ranged between 90 and 130 s for 95% response. This is due partly to the kinetics of the electrode, a function of temperature (Schuler, 1966), and partly to the kinetics of blood renewal in the measuring chamber, a function of the circulatory flow and the circuit volume. Here, the circulatory flow was held constant at 0-47 ml min"1 by the peristaltic pump and the temperature remained constant at 15 °C. Therefore the response time of the electrode depended primarily on the geometry and on the volume of the measuring chamber, length and width of catheters, etc., which were never identical from one experiment to another.
Continuous P^
0, measurement
3*5
80
40
95% of response
[image:5.451.76.351.63.309.2]Time (min)
Fig. 3. Curve 1 is the record of apparent Po obtained after an abrupt shift from arterial
dorsal aortic blood to mixed venous ventral aortic blood entering the measuring system. After a latency period (L), the kinetics is exponential with a 95 % response time of about 100 8. The dashed curve (2) is the instantaneous change in Po, an<^ the points (3) results from mathematical deconvolution method given in appendix. Differences between curves 2 and 3 are discussed in text.
system cannot be predicted in advance; rather, this curve must be established at the beginning of each experiment, checked periodically, and reestablished whenever elements of the circuit are modified: electrode, membrane, catheter, etc.
At first glance it appears possible to reduce the response time of the measuring electrode either by using thinner membranes or by constructing special rapid-response electrodes (Schuler, 1966). Several attempts have shown that, under such conditions, the response time may only be reduced by 30% at most, due to the existence of an unavoidable time lag: the flow rate of the external circulatory shunt. A supplementary experimental study of the dilution kinetics of a coloured fluid in the circuit was performed using dyes because a photosensitive cell has the advantage of responding without inertia. This study showed that, with a flow of 0-5 ml min^1 the irreducible time for dilution was approximately 85 s, an insufficient improvement. Classic-type electrodes were therefore used instead as they exhibit a greater stability with time.
In conclusion, the measuring system responds with a latency related to the dynamic characteristics of the external circulatory shunt. Continuous measures are unavoidably distorted to such an extent that rapid changes in the Pa 0 | value in fish cannot be
326 A. BELAUD, Y. TROTTER AND C. PEYRAUD
(2) Data processing to obtain the actual values of POt variations
in the dorsal aorta blood
Two sets of data, the continuous recording of blood Po > from the experimental animal - the output of the measuring system - on the one hand, and the transient curve, which is the response of the system to a step-change in the POi value of the blood entering the measuring cell, on the other hand, can be processed to yield the actual variations of POt in situ. Details of the data-processing method are given in an appendix.
A transient curve, of the type illustrated in Fig. 3, is satisfactorily fitted by the form of the product of exponential terms (see appendix). The exponential terms can be interpreted as the quantitation of many physical phenomena occurring in the catheter (mixing of flowing blood layers), in the measuring cell (dilution of entering blood) or in the electrode (diffusion of oxygen through the membrane or through electrolyte). By analysis of the co-ordinates of points sampled on the transient curve, the exponent factor of each exponential term is calculated. The data treatment must start on a part of t h e P0 | curves where the effective value of P0 | is known and constant, i.e. at the end of a calibration operation. The calibration is carried out by flowing for more than 5 min a blood sample equilibrated at constant PO l (cf. methods). In this case, the final recorded PO i value can then be considered as the true value of PO l of the blood sample entering the electrode.
The suggested method for data processing was submitted to two successive control stages: (1) Fig. 3 shows an example of an experimental transient curve (curve 1), recorded after an abrupt switch from arterial dorsal aortic blood to venous ventral aortic blood entering the measuring cell. The real instantaneous change of PO l is represented by curve 2. The experimental curve 1 has been treated according to the method given in the appendix. The plotted points (curve 3), which are the calculated results, are closer to the theoretical curve 2. The residual errors which appear in Fig. 3 are interpreted as resulting from uncertainties in determining the exponent coefficients of the equation of the treated curve and in sampling the co-ordinates of points on the recorded curve. However, this test shows that a known step-change in PO i, modified by the measuring system, can be satisfactorily reconstituted by the data processing method suggested.
Continuous P
a 0>measurement
327120 Constant/"o, —
80
40
4 6 Time (min)
10
Fig. 4. Control of validity of the suggested deconvolution method with a physical model. The physical model generates in water a change in Po, represented by the dashed line 1; curve 2 is the experimental response of the measuring system and 3 are the points resulting from calculation.
(3) Application of the data processing method
The method for data processing described here has been used to investigate the relationship between fish's ventilation and arterial PQl. In Fig. 2, the continuously
recorded experimental values for the eel's ventilatory activity and the apparent Pa Of
(solid curve 1) are given together with the processed Pa Oi values (curve 2). When the
fish starts or stops ventilating, the effective Pa,ot v alu e i3 quite different from the value
read on the meter. For the eel exposed to air-equilibrated water at 15 °C, the results do not support the view that active ventilation is always triggered at the same level of
^a,
O,-The method can also be applied to investigations of rapid changes in blood pH or Pco, values. It will be useful in studies where the measuring system does not allow the instantaneous display of the true values of the physiological characteristics.
The authors would like to express their sincere gratitude to Dr L. Calvez who has suggested and controlled the data processing method. They thank also Professor P. Dejours for improving the manuscript and for his helpful critical comments.
REFERENCES
BELAUD, A. (1975). Contribution a l'^tude de quelques reactions physiologiques de l'anguille (Anguilla
anguilla L.) soumise a diverse* conditions hyperbares. Thesis, Brest.
BELAUD, A., PEYRAUD-WAITZENECGER, M. & PEYRAUD, C. (1971). Techniques originales de prelevement dea parametres physiologiques sur le Congre (Conger conger L.) libre de ses deplacements. I. Electro-cardiogramme et activite respiratoire. Hydrobiologia 38 ( i ) , 49-59.
BRIGHAM, E. O. (1974). Discrete convolution and correlation. In The fast Fourier transform, Chap. 7 (ed. E. O. Brigham), pp. 110-122. Englewood Cliffs: Prentice-Hall Inc.
CALVEZ, L. C. (1973). Contribution a l'£tude des proprietes de la transformation Z et de la transfor-mation de Laguerre. Application a l'analyse des signaux et circuits. Thesis, Brest.
CHAN, D . K. O., CHESTER-JONES, I., HENDERSON, I. W. & RANKIN, J. C. (1967). Studies on the
328 A. BELAUD, Y. TROTTER AND C. PEYRAUD
DEJOURS, P. (197a). Action des changements de PO j et de P0 0 | de l'eau sur la ventilation et l'equilibrt^
acide-base du sang de quelques poissons teleosteens. J. Phyriol., Paris 65, 386A.
DEJOURS, P. (1973). Problems of control of breathing in fishes. In Comparative Physiology (ed. L. Bolis, K. Schmidt-Nielsen and S. H. P. Maddrell), pp. 117-133. Amsterdam: North Holland Pub-lishing Company,
DEJOURS, P. ET ARMAND, J. (1973). L'equilibre acide-base du sang chez la Carpe en fonction de la temperature. J. Physiol., Paris 67, 264A.
GAREY, W. F. (1969). Sampling blood from freely swimming fish. J. Appl. Physiol. 2:7, (5), 756-757. JURY, E. J. (1964). Theory and Application of the Z-transform method. New Jersey: John Wiley and
Sons Inc.
KIRSCH, R. (1971). Echanges d'eau, de chlorures et de sodium au niveau des different* erTecteurs de l'osmorigulation chez l'anguille (Anguilla anguilla L.) en eau douce et au cours de Padaptation d'eau douce a eau de mer. Thesis, Strasbourg.
KREUZER, F., HARRIS, E. D. & NESSLER, C. G. (i960). A method for continuous recording in vivo of blood oxygen tension. J. Appl. Physiol. 15, 77-82.
MAX, J. (1977). Methodes et techniques de traitement du signal et application aux mesures physiques. zeme edition. Paris: Masson.
MOTT, J. C. (1957). The cardiovascular system. In The physiology of fishes, vol. I. (ed. M. E. Brown), pp. 81-108. New York: Academic Press.
PEYRAUB-WAITZENEGGER, M. (1978). Contribution a l'itude du r61e des catecholamines circulantes dans la regulation ventilatoire de deux especes de teleosteens: la Carpe et l'Anguille. Analyse des modifications saisonnieres de reactivite. Thesis, Brest.
RANDALL, D. J. & STEVENS, E. D. (1967). The role of adrenergic receptors in cardiovascular changes associated with exercise in Salmon. Comp. Biochem. Pltysiol. ai, 415-424.
SCHULER, R. (1966). Evaluation and design of rapid polarographic in vivo oxygen catheter electrodes. Thesis Nijmegen.
SMITH, L. S. & BELL, G. R. (1964). A technique for prolonged blood sampling in free-swimming salmon. J. Fish. Res. Bd., Canada 31, (4), 711-717
STEEN, J. B. & KRUYSSE, A. (1964). The respiratory function of teleostean gills. Comp. Biochem. Physiol. ai, 127-142.
VAN DAM, L. (1938). On the utilization of oxygen and regulation of breathing in some aquatic animals. Thesis, Groningen.
APPENDIX
Data processing techniques
The unknown is the function f(t) (in the present example, the changes in blood PO f, the input to the measuring system).
The data are: (1) the experimental curve s(t), the output from the measuring system; (2) the previously determined transient response curve r(t) (this is the output curve corresponding to an instantaneous step-change in the value of Pot)> (3) the
derivative^*) = [dz{t)/dt], the impulse response.
Using the impulse response, a relation may be established between the input function f(t) and the output function s(t).
Equation (1): s(t) = g(t) • /(*),
where the symbol • denotes convolution. The output function s(t) results from the convolution of the input frunction/(/) and the impulse response g(t).
The following method of deconvolution permits the calculation of f(t) from s(t) and g(t).
The operation of convolution, indicated symbolically in equation (1), is (Max,
1977):
Continuous P
a O imeasurement 329
re o and a are integration limits; u is an integration variable which covers the range (0, a).
In the particular case where the functions s(t), g(t) and f(t) are known only at a finite number n of discrete points at constant spacing T in time, integration in equation (2) is effectively replaced by a sum. In this case, the value of s(t) at the instant t = nT is given by the equation (Brigham, 1974):
Equation (3): s(nT) = '£* Tg(jT)f([n-j] T). y-o
This equation allows the calculations of s(t) as the product of a convolution of
g{t) and/(£). We are however intrested in the inverse process of deconvolution. Thus,
we seek to transform equation (3) in such a way as to obtain a recurrence relation which allows us to obtain the value of f(t) at each point in time from the values of
s(t) andg(t). We proceed in two stages: (a) parametrization ofg(t); (b) deconvolution
of s(t) to obtain/(f).
(a) Parametrization ofg{t)
The experimental curves r(t) (cf. Fig. 3) may be satisfactorily fitted by the analytical form:
Equation (4): r(t) = ro+[(rm-ro) (1-«-&'*>>)
(i-where r = r(t) for t = 0 is the initial value of PO l; rx represents the value of r(i) for t-*• 00; Klt K2, K3 ... Kn are the time constants for the respective exponential terms
and are characteristic of the speed of response of the system. The physical significance
of these exponential terms has been treated in the text. The values of Ku Kt,... Kn
can be obtained from calculations involving the coordinates of a few points on the experimental curve r{t).
While the model described by equation (4) contains an arbitrary number of ex-ponential terms, it is found in practice that the experimental curves can be fitted to within the experimental error by two or three exponents, additional terms being unreproducible and thus not significant. In order to simplify the following develop-ment, we shall retain only two such terms; the results for three terms will be stated without proof.
By differentiation of equation (4), and normalizing to r^ — r^ = 1, we obtain the impulse response g{t) :
Equation (5): g(t) = a^-^i* + 0^-^* _ ( ^ + oa)«-<ai-H»iH,
where ctj = i/Kx and 04 = i/K%.
(b) Deconvolution of s(t)
Several different algorithms may be envisaged based on the use of various function transforms, The Fourier transform has been extensively used in this context, but we found that for our purpose, the Z-transform (Jury, 1964; Calvez, 1973) is particularly well adapted, because of its simplicity, and because of the discrete nature of our signal.
The Z-transform of function/(n) is defined as:
"
quation (6): F(z) = "if
33° A. BELAUD, Y. TROTTER AND C. PEYRAUD
and the Z-transformation of equation (3) can be written symbolically as:
Equation (7): S(z) = T G(z) F(z).
Use of the properties of Z-transformed functions allows us to calculate G(z) from
g(t). Substitution of G(Z) into equation (7) gives:
Equation (8): S(z) = T.
J
^
^
where, for clarity, we have introduced symbols alt a^, bv b3 and b3 denoting the
expressions:
a
i = a1( at = a1
bx =
(«A =
-Thus equation (8) may be rewritten as:
Equatxon (9): FW = A2.—±
The inverse transform to equation (9), carried out according to the properties of Z-transform allows us to reconstitute the values of/(f) at the instants T,iT, 3T ...nT, from the equation.
Equation (10): f(n) =
This recurrence relation (which is mathematically rigorous) shows that once g(t) is known, the value of/(nT) at any instant nT may be calculated using the previous value/([n— i]T) and four values from the curve s(t).
In the case where the calculation is carried out using a model for r(t) with three exponential term3 (equation 4), we obtain the following recurrence relation:
(Equation 11): f(n) =
where a^ to a6 and b0 to bt are dependent on the time constants of exponential terms