Nutrients 2019, 11, x; doi: FOR PEER REVIEW www.mdpi.com/journal/nutrients Article
1
Vive la difference! Effects of natural and
2conventional wines on blood alcohol concentrations:
3a randomized, triple-blind controlled study.
4Federico Francesco Ferrero 1,*, Maurizio Fadda 2, Luca De Carli 3, Marco Barbetta 5
4, Rajandrea Sethi 5 and Andrea Pezzana 3 6
1 FFF IMAGE srls, Torino, Italy; [email protected] 7
2 Clinical Nutrition Unit, Città della Salute e della Scienza, Torino, Italy; [email protected] 8
3 Clinical Nutrition Unit, ASL Città di Torino, Torino, Italy; [email protected], [email protected] 9
4 MSquare Dynamics S.r.l., Padova, Italy; [email protected] 10
5 Department of Environment, Land and Infrastructure Engineering (DIATI), Politecnico di Torino, Torino, 11
Italy; [email protected]
12
* Correspondence: [email protected]; Tel.: +39-349-432-1277
13
Received: date; Accepted: date; Published: date
14
Abstract: Different alcoholic beverages can have different effects on blood alcohol
15
concentrations (BAC) and neurotoxicity even if equalized for alcohol content by
16
volume. Anecdotal evidence suggested that natural wine is metabolized differently
17
from conventional wines. This triple-blind study compared the BAC of 55 healthy
18
male subjects after consuming the equivalent of 2 units of alcohol of a natural or
19
conventional wine over 3 mins in two separate sessions one week apart. BAC was
20
measured using a professional breathalyzer every 20 mins after consumption for 2
21
hrs. The BAC curves in response to the two wines diverged significantly at twenty
22
minutes, at forty minutes and also at their maximum concentrations (peaks), with
23
the natural wine inducing a lower BAC than the conventional wine (T20 0.40 vs.
24
0.46 [p<0.0002], T40 0.49 vs. 0.53 [p<0.0015], peak 0.52 vs. 0.56 [p<0.0002]). These
25
differences are likely related to the development of different amino acids and
26
antioxidants in the two wines during their production. This in turn may affect the
27
kinetics of alcohol absorption and metabolism. Other contributing factors may also
28
include pesticide residues, differences in dry extract content and the use of
29
indigenous or selected yeasts. Further studies are needed to fully understand why
30
natural wines are metabolized differently from conventional wines.
31
Keywords: alcohol; natural wine; blood alcohol content; breathalyzer; pesticides
32 33
1. Introduction
34
In recent decades, wine consumption has been the subject of intense debate
35
within the scientific community. On the one hand, wine has been linked to reduced
36
risk for several chronic illnesses, such as cardiovascular diseases, osteoporosis and
37
Nutrients 2019, 11, x FOR PEER REVIEW 2 of 20
diabetes [1]. On the other hand, international guidelines for cancer prevention
38
emphasize the direct correlation between alcohol intake and cancer risk [2, 3]. The
39
positive health benefits provided by wine come primarily from compounds called
40
polyphenols, which are natural antioxidants that help fight inflammation and
41
improve plasma lipid profiles [4]. When consumed regularly and moderately,
42
ethanol, the main alcohol component in wine, confers cardioprotective effects by
43
acting directly on cardiomyocytes, blood circulation and platelet aggregation [5].
44
However, ethanol and its metabolite acetaldehyde are also responsible for adverse
45
neurological, hepatic and oncological consequences secondary to alcohol
46
consumption [6, 7]. Because of its potentially beneficial and harmful effects, many
47
scientific organizations recommend that alcohol consumption be limited to
lower-48
alcohol beverages, such as wine [8], and that such beverages be consumed
49
moderately and responsibly, if at all [9, 10].
50
In Italy, the Research Centre for Food and Nutrition (CREA-AN) of the Council
51
for Agricultural Research and Economics has adopted guidelines issued by the
52
National Institute for Research on Food and Nutrition (INRAN), which define
53
moderate alcohol consumption as an average daily allowance of no more than 2-3
54
units of alcohol for men, and 1-2 units for women. The standard value of a unit of
55
alcohol in Italy is 12 g of ethanol [11].
56
As reported by the Italian National Institute for Research on Food and Nutrition,
57
there is a well-known linear correlation between blood alcohol concentration BAC
58
and the deleterious effects of alcohol, particularly those involving the central
59
nervous system [11]. The short-term neurotoxic effects of elevated BAC include a
60
state of euphoria or inebriation, slowed reflex and reaction times, diminished
61
peripheral vision, and cognitive impairment [12].
62
The relationship between the amount of alcohol consumed and BAC is
63
influenced by numerous factors, including the individual’s sex, age, body weight, 64
liver volume and function, drinking habits, use of medications, medical conditions,
65
and fasting or non-fasting state [13].
66
It has also been established that, when equalized for alcohol content by volume,
67
different beverages are absorbed at different rates and lead to different maximum
68
concentration (peaks) in BAC [14, 15]. This study set out to determine whether the
69
absorption of ethanol from two wines produced from the same grape (with similar
70
alcohol and sugar content) might be affected by differences in the farming and
71
winemaking techniques used in their production. The approach is therefore to
72
compare the evolution of BAC of healthy male subjects after their consumption of 2
73
units (24 g of alcohol) of a natural wine (i.e., cultivated without pesticides and
74
agrochemicals, fermented with wild yeasts, unfiltered and with no fining; see
75
Materials and Methods) and after their consumption of the same amount of a
76
conventional wine, a week apart and under the same experimental conditions.
77
2. Materials and Methods
78
2.1. Selection of the natural and conventional wines 79
Preprints (www.preprints.org) | NOT PEER-REVIEWED | Posted: 4 April 2019 doi:10.20944/preprints201902.0258.v2
In the absence of clear national or international legislation on the definition of
80
natural wine, it was decided for the purpose of this study to compare the effects of
81
consuming two near-identical wines differing only in the farming management and
82
vinification protocols adopted in their production. Over three hundred wines were
83
purchased for testing by an independent laboratory specialized in alimentary
84
analysis to identify those suitable for comparison. Our intention was to find a pair
85
of wines, one natural and one conventional, with near-perfect (or the best-possible)
86
correspondence in grape variety, proximity of the area of production, age of
87
harvesting, alcoholic strength by volume, and low sugar content (<1.5 g/L). Two
88
wines satisfied the inclusion criteria. Both were whites made from Cortese grapes
89
grown in vineyards located within ten kilometers of each other in Piedmont, Italy.
90
They were of the same vintage and aged in bottles for twelve months. Table 1 shown
91
the main characteristics of the two wines selected for the trial.
92
Table 1. Characteristics of the natural and conventional wines tested.
93
Natural wine Conventional wine Actual alcoholic strength by volume (vol%) 13.19 13.03
Volatile acidity (mEq/L) 20 4.5
Total sugar content (g/L) < 1.5 < 1.5
Total dry extract (g/L) 24.93 18.23
Total sulfur dioxide (g/L) 0.025 115
Pesticides1 n.d. present
1Over 200 pesticides were analyzed. Traces of Iprovalicarb (45 g/kg) and Fenhexamid (120 g/kg) 94
were found in the conventional wine.
95
As can be seen from the table, the two wines had the same percent of alcohol by
96
volume and a low sugar content (<1.5 g/L), and both were made from the same
97
variety of grape grown in the same geographic location. The grapes used for making
98
the natural wine, however, were cultivated without pesticides or agrochemicals
99
other than those approved for organic farming by EC Reg. 834/2007 [16]. The wine
100
was fermented without the use of selected yeasts or fining processes. The wine was
101
also left unfiltered and no sulfites were added. Instead, the grapes for making the
102
conventional wine were grown using regulated synthetic pesticides and
103
agrochemicals, and fermented with selected yeasts, and the entire winemaking
104
process was based on conventional methods permitted by Italian law, including
105
filtration and the addition of sulfur dioxide. The wines were subjected to additional
106
tests for pesticides, confirming traces of Iprovalicarb (45 g/kg) and Fenhexamid
107
(120 g/kg) in the conventional wine.
108
2.2. Study design 109
The study was a randomized, triple-blind, controlled trial. Each phase of the trial
110
was conducted in triple-blind, meaning that at no time were any of the three research
111
teams aware of the identity of the wines being administered to the subjects or being
112
analyzed. The first team designed the study, selected the volunteers and set up the
Nutrients 2019, 11, x FOR PEER REVIEW 4 of 20
samples for testing. The second administered the doses of wine to the subjects and
114
recorded the resulting data, and the third conducted the final data analysis. Among
115
the 167 eligible subjects, 55 subjects were drawn by a random number generator. In
116
addition, at the start of the test, the matrices containing the matching between the
117
subjects and the bottles were generated by a random number generator, as was the
118
assignment one of the two types of wine to each subject in the first or second week.
119
2.3. Subjects 120
All participants in the study were university student volunteers, screened using
121
a questionnaire to collect data on their height, weight, body mass index (BMI),
122
dietary habits, and use of prescription medicines. Ethical approval was provided by
123
the Polytechnic University of Turin (1037/2018, 01-30-2018) in compliance with the
124
Helsinki Declaration. Recruitment was limited to male subjects, as the study required
125
consumption of 2 units of alcohol, which exceeds the maximum recommended daily
126
amount for women (INRAN, 2003). At the end of the study, an information and
127
awareness campaign was carried out to promote alcohol awareness and responsible
128
use among the entire student body at the Polytechnic University of Turin. Inclusion
129
criteria: Males aged 18 to 30 with a BMI between 18.5 kg/m2 and 25 kg/m2 who could
130
understand the purpose of the study and thus provide written informed consent.
131
Exclusion criteria: Use of prescription medicine for chronic conditions; any
132
pathology that might interfere with alcohol metabolism; habitual consumption of
133
more than 4 units of alcohol per day.
134
2.4. Administering the two wines 135
The test took place over two sessions held one week apart. At the first session,
136
each subject was given 3 min to drink a single, unlabeled and randomly selected 248
137
ml dose of either the natural wine or the conventional wine (the equivalent of 2 units,
138
or 24 g of alcohol). At the second session, seven days later, the subjects had to repeat
139
the experiment, this time being administered the other type of wine to drink.
140
Table 1 summarizes the characteristics of the two wines tested. While similar in
141
alcohol strength by volume and sugar content, they showed significant differences
142
in volatile acidity, total dry extract, and sulfur dioxide concentrations, which can be
143
attributed to the different farming and vinification processes used in their
144
production.
145
After providing breath samples at the beginning of each session to verify a zero
146
BAC, the subjects underwent a series of breathalyzer tests to measure their blood
147
alcohol levels at 20-min intervals for a total of 2 h after ingesting the sample (time
148
intervals T0, T20, T40, T60 T80, T100, T120). A professional AlcoTrue M breathalyzer
149
(bluepoint MEDICAL, Selmsdorf, Germany) was used in order to infer the BAC.
150
The subjects were required to abstain from drinking alcohol for 7 days, from
151
smoking for 8 h and from eating for at least 4 h prior to both sessionsfor minimizing
152
the possible interference of assuming alcohol, smoke or food during the previous
153
week and the previous hours. They were deliberately provided with no information
154
Preprints (www.preprints.org) | NOT PEER-REVIEWED | Posted: 4 April 2019 doi:10.20944/preprints201902.0258.v2
about the wines being tested, and the wines were served at 21°C and the same
155
temperature was maintained in the testing room throughout the test to prevent any
156
temperature-dependent interference on the BAC [17]. The room had artificial
157
lighting and the two tastings took place at the same time of day to minimize any
158
possible interference. The wines were distributed in plain black wine tasting glasses.
159
The labels on the bottles were masked, and the wines were identified strictly by a
4-160
digit code number. The first two digits indicated the day on which the test was
161
performed, while the second two indicated the bottle index randomly assigned to
162
each bottle.
163
2.5. Pharmacokinetic analysis 164
A professional breathalyzer was used to estimate the following pharmacokinetic
165
parameters: BACs expressed in g/L at time intervals T0, T20, T40, T60, T80, T100,
166
T120; maximum BAC (peak)-versus time, the ethanol’s area under curve (AUC)
167
calculated using the trapezoidal rule.
168
2.6. Statistical analysis 169
The sample size was calculated on the basis of the main expected outcome,
170
defined as the difference between BAC after drinking a fixed dose of natural wine
171
and after drinking the same dose of conventional wine. Using data in the literature
172
on subjects similar to those participating in our study, it was calculated that for an
173
effect size of 0.67 and two tailed alpha-error of 0.05, 50 subjects could be needed to
174
obtain 90% of power. As a precautionary measure, the sample size was set at 55
175
subjects. Continuous variables were expressed as medians and interquartile ranges
176
(IQR), and categorical variables as percentages and absolute frequencies. The
177
Student’s t-test for paired samples was used to detect differences in BAC at each of
178
the time intervals (T0, T20, T40, T60 T80, T100, T120) and to detect differences in
179
AUC, too. The resulting data was graphically represented using box-and-whisker
180
plots. The level of significance was set at p ≤ 0.05. All statistical analysis was 181
performed with the MedCalc Statistical Software version 18.9 (Ostend, Belgium).
182
3. Results
183
The 55 male subjects recruited for the study were of median age 23 (p25: 21 years,
184
p75: 24 years), median weight 69 kg (p25: 65 kg, p75: 78 kg), median height 178 cm
185
(p25: 174 cm, p75: 183 cm), and median BMI 22 kg/m2 (p25: 20.8 kg/m2 cm, p75: 22.9
186
kg/m2). Breathalyzer measurements obtained at regular twenty-minute intervals
187
were used to plot concentration-time curves of each subject's BAC response to the
188
natural wine and to the conventional wine. These can be seen in Appendix A,
189
Figures A1 to A5. Superimposition of the pairs of curves reveals that each subject
190
had its own distinct pattern of alcohol pharmacokinetics to both wines, as is evident,
191
for example, for subjects 21, 25, 43 and 44, randomly extracted from the sample
192
(Figure 1).
Nutrients 2019, 11, x FOR PEER REVIEW 6 of 20
194
Figure 1. Examples of blood alcohol concentration (BAC) levels measured every 20 mins after the
195
ingestion of the conventional wine (CW) and of the natural wine (NW) (g/L), subjects #21, #25, #43
196
and #44.
197
By summing all of the subjects’ BAC values at the different time intervals and
198
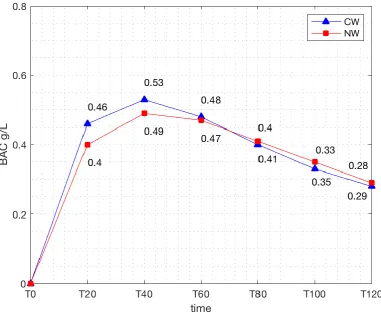
dividing by the number of subjects, the average BAC curves were calculated. Figure
199
2 shows the differences in the average BAC levels registered after the ingestion of
200
the natural vs. the conventional wine.
201 202
Preprints (www.preprints.org) | NOT PEER-REVIEWED | Posted: 4 April 2019 doi:10.20944/preprints201902.0258.v2
203
204
Figure 2. Comparison of the average blood alcohol concentration (BAC) levels measured every 20
205
mins after the ingestion of the conventional wine (CW) and of the natural wine (NW) (g/L).
206
It can be seen that the rate of increase in BAC in response to the two wines
207
diverges significantly at the T20 mark, with natural wine inducing lower levels than
208
conventional wine: 0.40 vs. 0.46 (p<0.0002) (Figure 3); this discrepancy persists at
209
significant levels up to T40: 0.49 vs. 0.53 (p<0.0015) (Figure 4).
Nutrients 2019, 11, x FOR PEER REVIEW 8 of 20
212
Figure 3. Box and whiskers diagram of the blood alcohol concentration (BAC) levels at T20 after the
213
ingestion of the conventional wine (CW) and of the natural wine (NW) (g/L) (T20 p<0.0002).
214
Preprints (www.preprints.org) | NOT PEER-REVIEWED | Posted: 4 April 2019 doi:10.20944/preprints201902.0258.v2
215
216
Figure 4. Box and whiskers diagram of the blood alcohol concentration (BAC) levels at T20 after the
217
ingestion of the conventional wine (CW) and of the natural wine (NW) (g/L) (p<0.0015).
218
The BAC peaks occur between T40 and T60 for both wines. The difference in
219
values of the maximun BAC levels after the ingestion of the the natural wine (NW)
220
is significantly lower than after the ingestion of conventional wine (CW) 0.52 vs. 0.56
221
(p<0.0002) (Figure 5). The curves continue to approach each other until the T80 mark
222
and then intersect. After this point the conventional wine is associated with a slightly
223
lower BAC and the curves gradually converge and largely overlap toward the end.
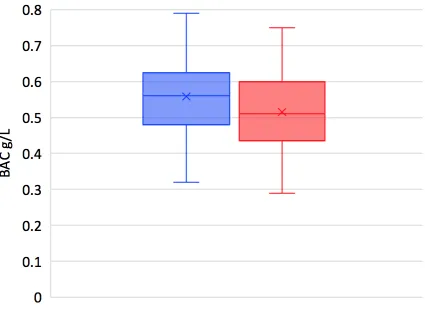
Nutrients 2019, 11, x FOR PEER REVIEW 10 of 20
226
Figure 5. Box and whiskers diagram of the maximum blood alcohol concentration (peak) levels after
227
the ingestion of the conventional wine (CW) and of the natural wine (NW) (g/L). (p<0.0002).
228
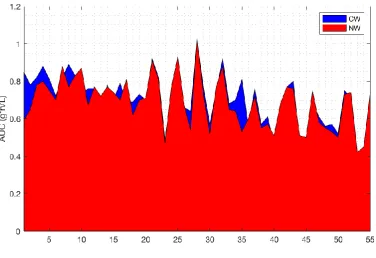
The AUC was calculated from T0 to T120 using the trapezoidal method. This
229
parameter proved not to be significant (p=0.13). This means that although the
230
increasing BAC in response to the two wines differs at specific points along the
231
curve, the overall variation does not reach significance when the curve is considered
232
as a whole (Figure 6).
233
Preprints (www.preprints.org) | NOT PEER-REVIEWED | Posted: 4 April 2019 doi:10.20944/preprints201902.0258.v2
234
235
Figure 6. Area under the curve (AUC) calculated for the conventional wine (CW) and the natural wine
236
(NW). (p=0.13).
237
It is interesting to note that, with the exception of the peak, the median BAC
238
measured in response to the natural wine is consistently below 0.5 g/L, the
239
maximum legal drink driving limit in many countries. In contrast, the BAC in
240
response to conventional wine not only exceeds the legal driving limit at its
241
maximum peak, but also approaches it at T20 and exceeds it at T40.
242
4. Discussion
243
Our findings indicate that the peak BAC reached after drinking a natural wine
244
is significantly lower than after drinking the same amount of a conventional wine
245
with a similar total alcohol strength by volume. The alcohol in natural wine is
246
absorbed more slowly than that in conventional wine, as can be seen by the
247
discrepancy between the BAC measurements at T20 and at T40 (Fig. 2). Ethanol is
248
absorbed into the blood stream mainly through the jejunum via passive diffusion,
249
and down the concentration gradient between the small intestine and the capillaries
250
[13]. Numerous factors can influence the absorption rate of alcohol: the type of
251
beverage and manner of ingestion (total alcohol content, the concentration of
252
alcohol, whether or not it is consumed as a single dose or as multiple smaller doses),
253
as well as the intrinsic characteristics of the subject (mucosal integrity of the
254
intestine, efficient blood flow, the presence or absence of food in the stomach, and
255
alcohol dehydrogenase activity in the gastric mucosa) [13]. This study was designed
256
to rule out possible causes for differences related to the mode of consumption or the
Nutrients 2019, 11, x FOR PEER REVIEW 12 of 20
intrinsic characteristics of the subjects. The causes can thus be attributed to
258
differences in the non-alcoholic component of the two wines.
259
Chemico-physical analysis of the samples revealed substantial differences in the
260
total dry extract of the two wines. This is a direct consequence of differences in
261
farming and winemaking practices, with the absence of filtration processes in
262
natural wine likely to be a key factor. The total dry extract of a wine contains all of
263
its non-volatile substances, such as sugars, polyphenols, fibers and minerals. The
264
total dry extract contained in the dose of natural wine was 1.67 g higher than in the
265
conventional wine used for testing. This may affect gastric emptying time and,
266
consequently, the absorption rate of ethanol [18].
267
The total sulfur dioxide content in the two wines also differed, with conventional
268
wine containing the larger share. Sulfur dioxide has antioxidant and antiseptic
269
properties that inhibit the growth of certain strains of yeast and bacteria during the
270
various phases of winemaking [19]. Although the in vivo metabolic effects of sulfur
271
dioxide have been widely studied [20], there have been no reports on its
272
involvement in the absorption or metabolism of alcohol.
273
Another important distinction between natural and conventional wines lies in
274
the vinification process. Natural wine is the product of spontaneous fermentation by
275
indigenous yeasts naturally found on the grapes, while conventional wines are
276
produced using mixtures of laboratory-selected microorganisms. The presence of
277
various strains of bacteria and yeasts during fermentation results in the
278
development of different metabolites [21, 22]. At present, the results of
chemico-279
physical analysis of the samples used in this study are unable to provide precise
280
information about these differences. Additional data may emerge thanks to the use
281
of new technologies. In recent years, for example, high-field 1H nuclear magnetic
282
resonance (1H-NMR) spectroscopy has allowed detailed investigation of wine
283
metabonomics [23] and has demonstrated that the vinification protocol is one of the
284
chief factors determining the amino acid, alcohol and polyphenol make-up of two
285
wines from the same geographic location [24]. Another study established that
286
different production chains determine variations in the amount and type of
287
antioxidants found in organic and biodynamic wines [25]. Comparable data on
288
wines produced using the natural winemaking process are not yet available.
289
Besides producing wines with different amino acid and polyphenolic profiles,
290
differences in the natural and conventional fermentation pathways may also
291
generate other molecules that interact with absorption or with specific isoforms of
292
alcohol dehydrogenase (ADH), the enzyme involved in breaking down alcohol. This
293
would in turn lead to differences in the rates of metabolism of natural wine and
294
conventional wine.
295
The polyphenolic content of wine has been found to alter the intestinal
296
microbiota by stimulating growth of bifidobacteria and lactobacilli and decreasing
297
the numbers of clostridia and enterobacteria [26, 27]. Prolonged alcohol abuse, on
298
the other hand, can produce a state of intestinal dysbiosis with overgrowth of
299
proteobacteria [28]. It is unlikely, however, that these differences affect the
300
absorption and metabolism of alcohol in the short term.
301
Preprints (www.preprints.org) | NOT PEER-REVIEWED | Posted: 4 April 2019 doi:10.20944/preprints201902.0258.v2
It seems reasonable to expect the polyphenolic profile of two differently
302
produced wines to have dissimilar effects on the individual’s microbiota. In any 303
case, the wines used in this study were white, meaning they were not as rich in
304
antioxidants as reds and rosés, so any variability due to the total content of
305
antioxidants (particularly of resveratrol) was minimized [29].
306
A further possibility is that pesticide residues (Tab. 1) might interfere with the
307
absorption, metabolism and pharmacokinetics of alcohol in conventional wines,
308
where contaminant analysis has revealed traces of the fungicides iprovalicarb and
309
fenhexamid. Both are present within legal limits [30, 31] and there have been no
310
reports of acute intoxication or known effects on liver metabolism caused by their
311
presence in wine [32, 33]. However, understanding the toxicity of pesticides and
312
their interaction with metabolic processes in vivo is extremely complex, given the
313
vast number of simultaneously interacting molecules [34]. Therefore, it cannot be
314
ruled out that synergistic interactions among the different contaminants might
315
influence the absorption or metabolism of ethanol.
316
The different kinetics observed for natural wine and conventional wine may
317
have important clinical implications. Acute alcohol intoxication is one of the leading
318
causes of emergency room visits [35], and approximately 5% of deaths from acute
319
poisoning are attributable to alcohol [36]. Systemic toxic effects are proportional to
320
BAC, and levels above 0.5 g/L are enough to impede normal daily activities.
321
Concentrations above 4 g/L cause hypoventilation, which, if untreated, can lead to
322
coma and death [37]. Our findings show that the peak BAC in response to natural
323
wine is lower than that to conventional wine, meaning that natural wine is less likely
324
to lead to alcohol intoxication.
325
Despite numerous mass media campaigns to promote responsible drinking,
326
alarming epidemiological evidence shows that they are largely ineffective in causing
327
a reduction in alcohol consumption [38]. According to 2017 data from the Italian
328
National Institute of Statistics (ISTAT), regular daily consumption of alcohol with
329
meals is slightly on the decline, whereas occasional or irregular drinking outside of
330
meals and binge drinking, particularly among youths below the age of 25, has
331
increased dramatically [39].
332
It is estimated that 35% of road fatalities are linked to alcohol. Because of the
333
dangers of alcohol-induced cognitive impairment, most European countries have
334
passed laws making it an offense to drive with a BAC in excess of 0.5 g/L. The fact
335
that in our study, among those subjects who drank 2 units of natural wine, only 56%
336
exceeded the legal blood alcohol limit of 0.5 g/L, as opposed to 67% of those who
337
drank the same amount of conventional wine, suggest further investigations.
338
A preliminary study by Bassani et al. (Marco Bassani, personal communication,
339
September 11th, 2018) compares the behavior of subjects who consumed natural wine
340
or conventional wine prior to completing a simulated driving task. Subjects who
341
drank conventional wine before the simulation tended to drive more aggressively
342
than those who consumed an equal amount of natural wine. In particular, the
343
natural wine drinkers drove consistently slower and committed fewer traffic
344
violations than those who drank conventional wine.
Nutrients 2019, 11, x FOR PEER REVIEW 14 of 20
5. Conclusions
346
To our knowledge, this is the first scientific study to compare the
347
pharmacokinetics of alcohol of a conventional wine with that of a nearly identical
348
natural wine. It analyzed the effects on BAC of drinking a natural wine or of an equal
349
amount of conventional wine, both from the same terroir and containing the same
350
percent of alcohol by volume and total sugars. The BAC level 20 mins and 40 mins
351
after drinking the natural wine was lower than that after drinking the conventional
352
wine, and the peak blood alcohol response to drinking natural wine was also lower
353
than the peak response to drinking conventional wine. This supports the hypothesis
354
that natural and conventional wines are metabolized differently.
355
The key strengths of this study are its randomized, triple-blind, controlled
356
design and its careful selection of the wines, both of which came from the same
357
variety of grape and were virtually identical in many of their physical and chemical
358
characteristics. Recruitment of a homogeneous group of subjects reduced the
359
variability in individual kinetics and alcohol metabolism. A limitation of the study
360
is the brief period (2 h) allotted to measuring the subjects’ BAC, and future trials 361
may wish to extend the time used for testing.
362
More work is needed to fully understand the relationship between natural wine
363
and BAC. Currently, little data is available on other types of wine (red and rosé) and
364
other segments of the population (women and the elderly). However, studies using
365
higher doses of wine would pose ethical challenges related to exposing subjects to
366
more alcohol than is considered safe. Additional studies using new technologies
367
such as 1H-NMR will make it easier to pinpoint differences in the chemical
368
composition of natural and conventional wines.
369
In the absence of specific laws and more precise laboratory data, the differences
370
between natural wine and conventional wine must be imputed to differences in
371
agricultural methods, winemaking processes, and preservation techniques, and
372
their description is mainly relegated to expression of the consumers’ sensorial 373
experience of the final product. The present study has been able to confirm that there
374
are indeed objective differences in the absorption of natural wine and conventional
375
wine.
376
Further research would be useful with a view to developing a universal
377
legislative framework for the regulation of natural wines and for shedding light on
378
differences in the public health implications of natural wine and conventional wine.
379
Because it leads to a lower peak BAC than conventional wine, natural wine may be
380
linked to a lower risk for alcohol intoxication. If future studies confirm this
381
hypothesis, every effort should be made to include this information in public
382
awareness and educational campaigns about responsible drinking. Given the
383
growing international interest in natural wines [40, 41] as well as consumers’ 384
increasing demand for “natural” alcoholic beverages with a low environmental 385
impact, further research should be undertaken to better understand the potential
386
health benefits provided by natural wines.
387
Preprints (www.preprints.org) | NOT PEER-REVIEWED | Posted: 4 April 2019 doi:10.20944/preprints201902.0258.v2
Author Contributions: conceptualization, Federico Francesco Ferrero; data curation, Marco Barbetta; formal
388
analysis, Maurizio Fadda and Luca De Carli; methodology, Marco Barbetta; supervision, Federico Francesco
389
Ferrero and Andrea Pezzana; validation, Maurizio Fadda; writing—original draft preparation, Federico
390
Francesco Ferrero, Maurizio Fadda and Luca De Carli; writing—review and editing, Federico Francesco Ferrero,
391
Maurizio Fadda, Luca De Carli, Rajandrea Sethi and Andrea Pezzana.
392
Aknowledgments: the support of Prof. Marco Bassani, Prof. Alberto Godio and all the staff of the Department
393
of Environment, Land and Infrastructure Engineering (DIATI), Politecnico di Torino, Torino, Italy, during the
394
tests, was highly appreciated.
395
396
Funding: This research received no external funding.
397
Conflicts of Interest: FFF IMAGE received an unconditional grant from Velier, S.p.A. in 2018 and 2019. The
398
funders had no role in the design of the study; in the collection, analyses, or interpretation of data; in the writing
399
of the manuscript, or in the decision to publish the results.
400
401
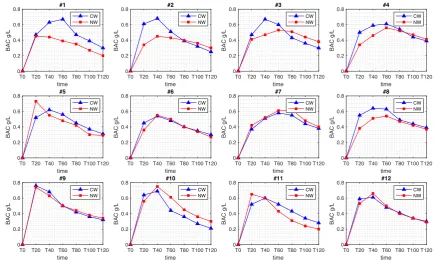
Appendix A. Concentration-time curves of each subject's BAC response to the
402
natural wine and to the conventional wine (Figures A1 to A5).
403
404
Figure A1. Concentration-time curves of BAC responses to the natural wine and to the conventional
405
wine for Subjects #1-#12.
Nutrients 2019, 11, x FOR PEER REVIEW 16 of 20
407
Figure A2. Concentration-time curves of BAC responses to the natural wine and to the conventional
408
wine for Subjects #13-#24.
409
410
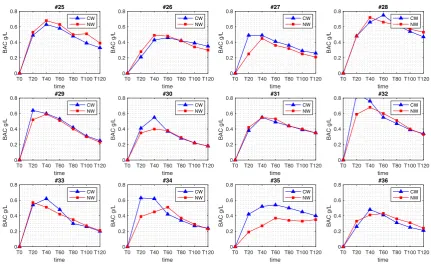
Figure A3. Concentration-time curves of BAC responses to the natural wine and to the conventional
411
wine for Subjects #25-#36.
412
Preprints (www.preprints.org) | NOT PEER-REVIEWED | Posted: 4 April 2019 doi:10.20944/preprints201902.0258.v2
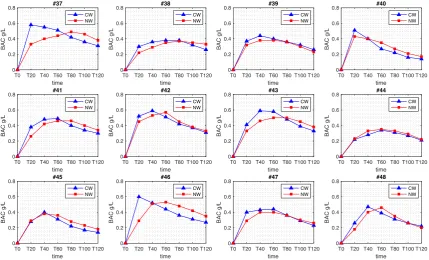
413
Figure A4. Concentration-time curves of BAC responses to the natural wine and to the conventional
414
wine for Subjects #37-#48.
415
416
Figure A5. Concentration-time curves of BAC responses to the natural wine and to the conventional
417
wine for Subjects #49-#55.
418
References
419
1. Artero, A.; Artero, A.; Tarín, J.J.; Cano, A. The impact of moderate wine consumption on health. Maturitas 420
2015, 80(1):3-13.
421
2. Scoccianti, C.; Cecchini, M.; Anderson, A.S.; Berrino, F.; Boutron-Ruault, M.C.; Espina, C.; Key, T.J.;
422
Leitzmann, M.; Norat, T.; Powers, H.; Wiseman, M., Romieu, I. European Code against Cancer 4th Edition:
423
Alcohol drinking and cancer. Cancer Epidemiol2016, 45:181-188.
Nutrients 2019, 11, x FOR PEER REVIEW 18 of 20
3. World Cancer Research Fund/American Institute for Cancer Research Diet, Nutrition, Physical Activity and 425
Cancer: a Global Perspective. Continuous Update Project Expert Report 2018. Available online:
426
www.wcrf.org/sites/default/files/Summary-third-expert-report.pdf (accessed on 12 December 2018).
427
4. Arranz, S.; Chiva-Blanch, G.; Valderas-Martínez, P.; Medina-Remón, A.; Lamuela-Raventós, R.M.; Estruch,
428
R. Wine, beer, alcohol and polyphenols on cardiovascular disease and cancer. Nutrients2012, 4(7):759-781.
429
5. Krenz, M.; Korthuis, R.J. Moderate ethanol ingestion and cardiovascular protection: from epidemiologic
430
associations to cellular mechanisms. J Mol Cell Cardiol2012, 52(1):93-104.
431
6. de la Monte, S.M.; Kril, J.J. Human alcohol-related neuropathology. Acta Neuropathol2014, 127(1):71-90.
432
7. Rocco, A.; Compare, D.; Angrisani, D.; Sanduzzi Zamparelli, M.; Nardone, G. Alcoholic disease: liver and
433
beyond. World J Gastroenterol2014, 20(40):14652-9.
434
8. Piepoli, M.F.; Hoes, A.W.; Agewall, S.; Albus, C.; Brotons, C.; Catapano, A.L.; Cooney, M.T.; Corrà, U.;
435
Cosyns, B.; Deaton, C.; Graham, I.; Hall, M.S.; Hobbs, F.D.R.; Løchen, M.L.; Löllgen, M.; Marques-Vidal, P.;
436
Perk, J.; Prescott, E.; Redon, J.; Richter, D.J.; Sattar, N.; Smulders, Y.; Tiberi, M.; van der Worp, H.B.; van
437
Dis, I.; Verschuren, W.M.M.; Binno, S.; ESC Scientific Document Group 2016 European Guidelines on
438
cardiovascular disease prevention in clinical practice. Eur Heart J2017, 37(29): 2315–2381.
439
9. Arends, J.; Bachmann, P.; Baracos, V.; Barthelemy, N.; Bertz, H.; Bozzetti, F.; Fearon, K.; Hütterer, E.;
440
Isenring, E.; Kaasa, S.; Krznaric, Z.; Laird, B.; Larsson, M.; Laviano, A.; Mühlebach, S.; Muscaritoli, M.;
441
Oldervoll, L.; Ravasco, P.; Solheim, T.; Strasser, F.; de van der Schueren, M.; Preiser, J.C. ESPEN guidelines
442
on nutrition in cancer patients. Clin Nutr2017, 36(1):11-48.
443
10. Mancia, G.; Fagard, R.; Narkiewicz, K.; Redon, J.; Zanchetti, A.; Böhm, M.; Christiaens, T.; Cifkova, R.; De
444
Backer, G.; Dominiczak, A.; Galderisi, M.; Grobbee, D.E.; Jaarsma, T.; Kirchhof, P.; Kjeldsen, S.E.; Laurent,
445
S.; Manolis, A.J.; Nilsson, P.M.; Ruilope, L.M.; Schmieder, R.E.; Sirnes, P.A.; Sleight, P.; Viigimaa, M.;
446
Waeber, B.; Zannad, F.; Redon, J.; Dominiczak, A.; Narkiewicz, K.; Nilsson, P.M.; Burnier, M.; Viigimaa M.;
447
Ambrosioni, E.; Caufield, M.; Coca, A.; Olsen, M.H.; Schmieder, R.E.; Tsioufis, C.; van de Borne, P.;
448
Zamorano, J.L.; Achenbach, S.; Baumgartner, H.; Bax, J.J.; Bueno, H.; Dean, V.; Deaton, C.; Erol, C.; Fagard,
449
R.; Ferrari, R.; Hasdai, D.; Hoes, A.W.; Kirchhof, P.; Knuuti, J.; Kolh, P.; Lancellotti, P.; Linhart, A.;
450
Nihoyannopoulos, P.; Piepoli, M.F.; Ponikowski, P.; Sirnes, P.A.; Tamargo, J.L.; Tendera, M.; Torbicki, A.;
451
Wijns, W.; Windecker, S.; Clement, D.L.; Coca, A.; Gillebert, T.C.; Tendera, M.; Rosei, E.A.; Ambrosioni, E.;
452
Anker, S.D.; Bauersachs, J.; Hitij, J.B.; Caulfield, M.; De Buyzere, M.; De Geest, S.; Derumeaux, G.A.; Erdine,
453
S.; Farsang, C.; Funck-Brentano, C.; Gerc, V.; Germano, G.; Gielen, S.; Haller, H.; Hoes, A.W.; Jordan, J.;
454
Kahan, T.; Komajda, M.; Lovic, D.; Mahrholdt, H.; Olsen, M.H.; Ostergren, J.; Parati, G.; Perk, J.; Polonia, J.;
455
Popescu, B.A.; Reiner, Z.; Rydén, L.; Sirenko, Y.; Stanton, A.; Struijker-Boudier, H.; Tsioufis, C.; van de
456
Borne, P.; Vlachopoulos, C.; Volpe, M.; Wood, D.A. 2013 ESH/ESC guidelines for the management of
457
arterial hypertension: the Task Force for the Management of Arterial Hypertension of the European Society
458
of Hypertension (ESH) and of the European Society of Cardiology (ESC). Eur Heart J2013, 34(28):2159-2219.
459
11. Italian National Institute for Research on Food and Nutrition (INRAN) (2003) Linee guida per una sana 460
alimentazione italiana – Bevande alcoliche: se sì, solo in quantità controllata. Available online:
461
http://nut.entecra.it/files/download/linee_guida/lineeguida_07.pdf (accessed on 12 December 2017, page in
462
Italian).
463
12. Schweizer, T.A.; Vogel-Sprott, M.; Danckert, J.; Roy, E.A.; Skakum, A.; Broderick, C.E. Neuropsychological
464
profile of acute alcohol intoxication during ascending and descending blood alcohol concentrations.
465
Neuropsychopharmacology2006, 31(6):1301-1309.
466
13. Cederbaum, A. Alcohol metabolism. Clin Liver Dis2012, 16(4):667-685.
467
14. Mitchell, M.C. Jr.; Teigen, E.L.; Ramchandani, V.A. Absorption and peak blood alcohol concentration after
468
drinking beer, wine, or spirits. Alcohol Clin Exp Res2014, 38(5):1200-1204.
469
15. Nogueira, L.C.; Couri, S.; Trugo, N.F.; Lollo, P.C. The effect of different alcoholic beverages on blood
470
alcohol levels, plasma insulin and plasma glucose in humans. Food Chem2014, 158:527-533.
471
16. Council Regulation (EC) No. 834/2007 of 28 June 2007 on organic production and labelling of organic
472
products and repealing Regulation (EEC) No 2092/91. Available online: http://eur-lex.europa.eu (accessed
473
12 December 2017).
474
17. Sarafian, D; Maufrais, C.; Montani, J.-P. Early and late cardiovascular and methabolic responses to mixed
475
wine: effects of drink temperature. Frontiers in Phisiology 2018, 9(1334):1-14.
476
18. Franke, A.; Nakchbandi, I.A.; Schneider, A.; Harder, H.; Singer, M.V. The effect of ethanol and alcoholic
477
beverages on gastric emptying of solid meals in humans. Alcohol Alcohol2005, 40(3):187-193.
478
Preprints (www.preprints.org) | NOT PEER-REVIEWED | Posted: 4 April 2019 doi:10.20944/preprints201902.0258.v2
19. Divol, B.; du Toit, M.; Duckitt, E. Surviving in the presence of sulphur dioxide: strategies developed by
479
wine yeasts. Appl Microbiol Biotechnol2012,95(3):601-613.
480
20. Wang, X.B.; Du, J.B.; Cui, H. Sulfur dioxide, a double-faced molecule in mammals. Life Sci2014 98(2):63-67.
481
21. Mas, A.; Guillamon, J.M.; Torija, M.J.; Beltran, G.; Cerezo, A.B.; Troncoso, A.M.; Garcia-Parrilla, M.C.
482
Bioactive compounds derived from the yeast metabolism of aromatic amino acids during alcoholic
483
fermentation. Biomed Res Int2014,2014:898045.
484
22. Romboli, Y.; Mangani, S.; Buscioni, G.; Granchi, L.; Vincenzini, M. Effect of Saccharomyces cerevisiae and
485
Candida Zemplinina on quercetin, vitisin A and hydroxityrosol contents in Sangiovese wines. World J 486
Microbiol Biotechnol 2015, 31:10137-45.
487
23. Godelmann, R.; Kost, C.; Patz, C.D.; Ristow, R.; Wachter, H. Quantitation of Compounds in Wine Using
488
(1)H NMR Spectroscopy: Description of the Method and Collaborative Study. J AOAC Int2016,
99(5):1295-489
1304.
490
24. Parpinello, G.P.; Rombolà, A.D.; Simoni, M.; Versari, A. Chemical and sensory characterisation of
491
Sangiovese red wines: comparison between biodynamic and organic management. Food Chem 2015,
492
167:145-152.
493
25. Laghi, L.; Versari, A.; Marcolini, E.; Parpinello, G.P. Metabonomic Investigation by 1H-NMR to
494
Discriminate between Red Wines from Organic and Biodynamic Grapes. Food Nutr Sci2014,05(01):52-59.
495
26. Queipo-Ortuño, M.I.; Boto-Ordoñez, M.; Murri, M.; Gómez-Zumaquero, J.M.; Clemente-Postigo, M.;
496
Estruch, R.; Cardona Diaz, F.; Andres-Lacueva, C.; Tinahones, F.J. Influence of red wine polyphenols and
497
ethanol on the gut microbiota ecology and biochemical biomarkers. Am J Clin Nutr2012, 95(6):1323-1334.
498
27. Yamakoshi, J.; Tokutake, S.; Kikuchi, M.; Kubota, Y.; Konishi, H.; Mitsuoka, T. Effect of
proanthocyanidin-499
rich extract from grape seeds on human fecal flora and fecal odor. Microb Ecol Health Dis2001,13:25-31.
500
28. Engen, P.A.; Green, S.J.; Voigt, R.M.; Forsyth, C.B.; Keshavarzian, A. The Gastrointestinal Microbiome:
501
Alcohol Effects on the Composition of Intestinal Microbiota. Alcohol Res2015,37(2):223-236.
502
29. Paixão, N.; Perestrelo, R.; Marques, J.C.; Câmara, J.S. Relationship between antioxidant capacity and total
503
phenolic content of red, rosé and white wines. Food Chem2007,105(1):204-214.
504
30. European Food Safety Authority Review of the existing maximum residue levels (MRLs) for iprovalicarb
505
according to Article 12 of Regulation (EC) No 396/2005. EFSA Journal2011,9(8):2338.
506
31. European Food Safety Authority Conclusion on the peer review of the pesticide risk assessment of the
507
active substance fenhexamid. EFSA Journal2014,12(7):3744.
508
32. Moeller, L.; Galea, G. and World Health Organization Regional Office for Europe (2012) Alcohol in the 509
European Union: consumption, harm and policy approaches, edited by Peter Anderson, Lars Moeller and
510
Gauden Galea. WHO Regional Office for Europe, Copenhagen. Available online:
511
www.euro.who.int/__data/assets/pdf_file/0003/160680/e96457.pdf (accessed 12 December 2017).
512
33. NIH National Library of Medicine (2005) TOXNET Toxicology Data Network-Fenexhamide [database].
513
Updated September 22, 2016. Available online: https://toxnet.nlm.nih.gov/ (accessed 12 December 2017).
514
34. Hodgson, E.; Rose, R.L. Human metabolism and metabolic interactions of deployment-related chemicals.
515
Drug Metab Rev2005,37(1):1-39.
516
35. te Wildt, B.T.; Andreis, C.; Auffarth, I.; Tettenborn, C.; Kropp, S;. Durisin, M. Alcohol related conditions
517
represent a major psychiatric problem in emergency departments. Emerg Med J2006,23(6):428–430.
518
36. Mowry, J.B.; Spyker, D.A.; Cantilena, L.R. Jr.; McMillan, N.; Ford, M. 2013 Annual Report of the American
519
Association of Poison Control Centers' National Poison Data System (NPDS): 31st Annual Report. Clin 520
Toxicol (Phila)2014,52(10):1032-1283.
521
37. Vonghia, L.; Leggio, L.; Ferrulli, A.; Bertini, M.; Gasbarrini, G.; Addolorato, G.; Alcoholism Treatment
522
Study Group Acute alcohol intoxication. Eur J Intern Med2008,19(8):561-567.
523
38. Young, B.; Lewis, S.; Katikireddi, S.V.; Bauld, L.; Stead, M.; Angus, K.; Campbell, M.; Hilton, S.; Thomas, J.;
524
Hinds, K.; Ashie, A.; Langley, T. Effectiveness of Mass Media Campaigns to Reduce Alcohol Consumption
525
and Harm: A Systematic Review. Alcohol Alcohol2018,53(3):302-316.
526
39. Italian National Institute of Statistics (ISTAT) (2016) Report: il consumo di alcol in Italia del 12 aprile 2017.
527
Available online: www.istat.it/it/files/2017/04/Consumo_alcol_in_Italia_2016.pdf (accessed 12 December
528
2017, page in Italian).
529
40. Bietti, G. Vini Naturali d’Itala 2.0. Novo manuale del bere sano tra moda e verità. Edizione Estemporanee, Rome,
530
2013.
Nutrients 2019, 11, x FOR PEER REVIEW 20 of 20
41. Legeron, I. Natural Wine: An Introduction to Organic and Biodynamic Wines Made Naturally. Ryland, Peters &
532
Small Ltd., London 2017.
533
© 2019 by the authors. Submitted for possible open access publication under the terms and conditions of the Creative Commons Attribution (CC BY) license (http://creativecommons.org/licenses/by/4.0/).
534
Preprints (www.preprints.org) | NOT PEER-REVIEWED | Posted: 4 April 2019 doi:10.20944/preprints201902.0258.v2