CAOS: a tool for OpenStack accounting management
PaoloAndreetto1,,FabrizioChiarello1,, andSergioTraldi1,∗ 1INFN - Sezione di Padova, Via Marzolo 8, 35131 Padova, Italy
Abstract. The analysis and understanding of resources utilization in shared infrastructures, such as cloud environments, is crucial in order to provide better performance, administration and capacity planning.
The management of resource usage of the OpenStack-based cloud infras-tructures hosted at Padova, the Cloud Area Padovana and the INFN-PADOVA-STACK instance of the EGI Federated cloud, started with the de-ployment of Ceilometer, the OpenStack component responsible for collecting and managing accounting information. However, by using Ceilometer alone we found some limiting problems related to the way it handles information: among others, the imbalance between storage and data retention requirements, and the complexity in computing custom metrics.
In this contribution we present a tool, called CAOS, which we have been im-plementing to overcome the aforementioned issues. CAOS collects, manages and presents the data concerning resource usage of our OpenStack-based cloud infrastructures. By gathering data from both the Ceilometer service and Open-Stack API, CAOS enables us to track resource usage at different levels (e.g. per project), in such a way that both current and past consumption of resources can be easily determined, stored and presented.
1 Introduction
In this article we are going to describe our accounting and monitor tool CAOS (Control Application for OpenStack) for different OpenStack based cloud infrastructures: the Cloud Area Padovana (CAP) [1], the INFN-PADOVA-STACK instance of the EGI federated cloud [2], the cloud of the University of Padova [3] and a private testbed cloud. We are going to describe the architecture of the software, the functionality that CAOS offers and why we decided to create this new component in our infrastructure.
2 Why use CAOS
We started from Ceilometer [4], that is the OpenStack [5] component of the telemetry project. Its data can be used to provide customer billing, resource tracking, and alarming capabilities across all OpenStack core components. Ceilometer is also useful to collect and manage accounting information. We notice that Ceilometer has some limiting problems related to the way it handles information:
• inefficient storage of information, each measurement is accompanied by redundant meta-data;
• the wrong trade-offbetween storage and data history retention. In fact in three months of use, with a medium cloud load, we found less more than 220 GB of data stored in our environment;
• the complexity in computing custom metrics, for example quotas and compute node us-ages are not defined and many times are required modifications to the configuration file in controller nodes or in the ceilometer agent;
• metrics refer to single resource: aggregating data (e.g. per project or per compute node) must be done on the fly and can be extremely slow also in a small observation time slot; • it is not straightforward to get information involving different metrics (e.g. the efficiency
in CPU usage, quota usage);
• several post-processing steps or work-arounds are required in order to fix some known bugs affecting different versions of OpenStack adopted, starting from Kilo, successively Mitaka and Ocata.
Because of these problems we implemented a tool, called CAOS (Control Application for OpenStack), which manages and then presents the accounting data provided by OpenStack (in particular those collected by the Ceilometer service). CAOS enables tracking of usages at different levels: e.g. per project or per compute node, in such a way that both current and past consumption of resources can be easily determined.
3 CAOS architecture
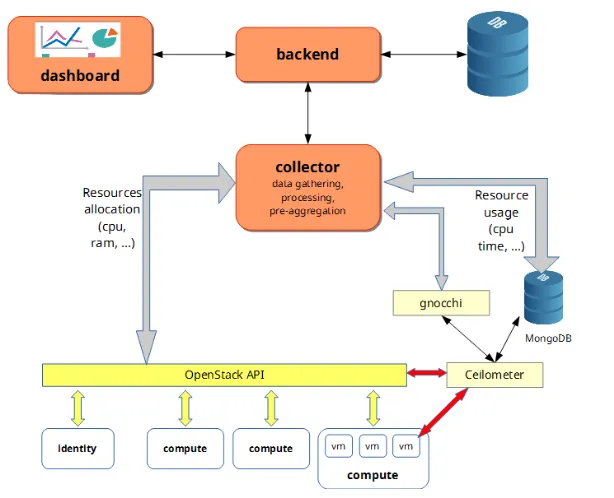
In figure 1 below we can see the CAOS architecture. As we can observe CAOS has three main layers:
• the collector; • the backend; • the dashboard.
Each of those has a specific task described below and they are developed in different lan-guages, so we decided for each one to develop a specific Docker container, through docker-compose. For the collector we use also Vagrant to speed up and simplify the development. All the services are available in the CAOS git repository [6] and they are inserted in a con-tinuous integration and concon-tinuous delivery system [7] to easily test the code changes and to have always the control of all the containers’ versions.
The collector gathers data at regular intervals from both the OpenStack API and the Ceilometer service. The former is used for tracking identity information (e.g. projects), resource allocation and compute nodes’ state; the latter is used mainly for tracking real con-sumption, such as the used CPU time of instances. We decided to read data directly from the MongoDB instance to overcome some Ceilometer limitations and to have more flexibil-ity in the retrieval of the information. In the near future we are planning to migrate from MongoDB to Gnocchi [8] for storing metrics in order to improve performance and have a better metric management. The data are then analyzed and pre-aggregated at coarser gran-ularity (e.g. hourly), enabling almost unlimited data retention. The collector also computes more complex metrics which involve operations across different metrics, such as the CPU efficiency.
• inefficient storage of information, each measurement is accompanied by redundant meta-data;
• the wrong trade-offbetween storage and data history retention. In fact in three months of use, with a medium cloud load, we found less more than 220 GB of data stored in our environment;
• the complexity in computing custom metrics, for example quotas and compute node us-ages are not defined and many times are required modifications to the configuration file in controller nodes or in the ceilometer agent;
• metrics refer to single resource: aggregating data (e.g. per project or per compute node) must be done on the fly and can be extremely slow also in a small observation time slot; • it is not straightforward to get information involving different metrics (e.g. the efficiency
in CPU usage, quota usage);
• several post-processing steps or work-arounds are required in order to fix some known bugs affecting different versions of OpenStack adopted, starting from Kilo, successively Mitaka and Ocata.
Because of these problems we implemented a tool, called CAOS (Control Application for OpenStack), which manages and then presents the accounting data provided by OpenStack (in particular those collected by the Ceilometer service). CAOS enables tracking of usages at different levels: e.g. per project or per compute node, in such a way that both current and past consumption of resources can be easily determined.
3 CAOS architecture
In figure 1 below we can see the CAOS architecture. As we can observe CAOS has three main layers:
• the collector; • the backend; • the dashboard.
Each of those has a specific task described below and they are developed in different lan-guages, so we decided for each one to develop a specific Docker container, through docker-compose. For the collector we use also Vagrant to speed up and simplify the development. All the services are available in the CAOS git repository [6] and they are inserted in a con-tinuous integration and concon-tinuous delivery system [7] to easily test the code changes and to have always the control of all the containers’ versions.
The collector gathers data at regular intervals from both the OpenStack API and the Ceilometer service. The former is used for tracking identity information (e.g. projects), resource allocation and compute nodes’ state; the latter is used mainly for tracking real con-sumption, such as the used CPU time of instances. We decided to read data directly from the MongoDB instance to overcome some Ceilometer limitations and to have more flexibil-ity in the retrieval of the information. In the near future we are planning to migrate from MongoDB to Gnocchi [8] for storing metrics in order to improve performance and have a better metric management. The data are then analyzed and pre-aggregated at coarser gran-ularity (e.g. hourly), enabling almost unlimited data retention. The collector also computes more complex metrics which involve operations across different metrics, such as the CPU efficiency.
The backend, developed in the Elixir language [9] targeting the Erlang VM, provides a time series framework for writing and reading metrics: the data can be used to monitor the
Figure 1.CAOS architecture and objects communication diagram.
actual or very recent state of the cloud, or it can be aggregated (e.g. over all projects) or downsampled at a given resolution or time range to provide resources accounting.
The dashboard is a simple Angular/Javascript [10] application, which allows the cloud administrator to easily get resource usage information (CPU time, wall clock time, efficiency) for all (or some) projects, for a given time period, by querying data from the backend. Such information can also be presented as graphs.
4 Metrics and accounting
By definition metrics are measurements by which efficiency, performance and quality of a service of a process or a product can be assessed.
Accounting [11], in information technology, is the process of keeping track of a user’s activity while accessing a resource, including the amount of time spent in the network, the services accessed while there and the amount of data transferred during the session. Account-ing data are used for trend analysis, capacity plannAccount-ing, billAccount-ing auditAccount-ing and cost allocation.
4.1 Metrics in CAOS
Using CAOS we can easily retrieve metrics from one virtual machine, or from all instances in a project, or we can easily extract general metrics for one specific project instead of a compute node.
The typical metrics retrieved are:
• wall clock time: a performance metric that records the time in seconds taken to execute a block of code (global or per project in a specific period and a given granularity);
• CPU efficiency: is a relationship between wall clock time and CPU time (global or per project in a specific period and a given granularity);
• VRAM: is the amount of virtual memory used (global or per project in a specific period); • instances: number of virtual machines in a project or in a specific compute node (in a
specific period);
• VCPU: virtual CPU number and usage in a project or in a specific compute node (in a specific period);
• usages: amount of VCPU, VRAM, instances and CPU efficiency compared to quota (in a specific period).
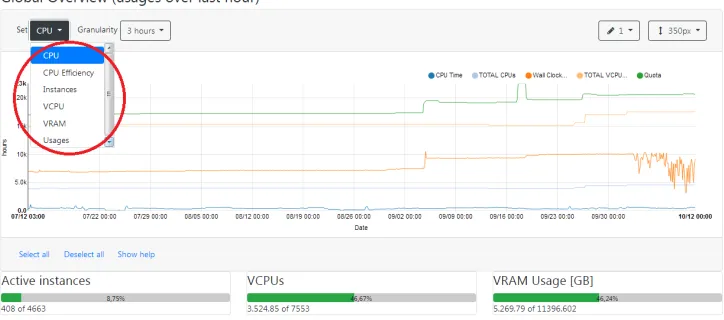
From the dashboard a user can select a time window and its granularity of each metric.
Figure 2.Inside the red circle we can see the available metrics from which a user can choose.
4.2 Accounting in CAOS
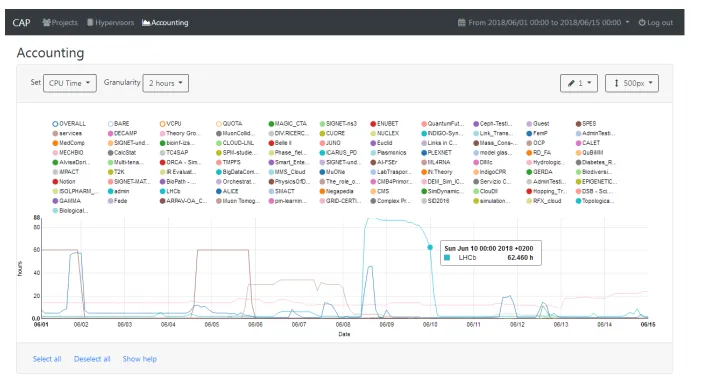
The accounting section of the dashboard allows the user to retrieve comprehensive graphs (see figure 3) or tabular results (see figure 4) of a project on the cloud infrastructure. We decided not retrieving data from single users in the cloud, because our target is to monitor the real usage of the infrastructure. Another point we are focus on is the way to find if there are any significant problems like virtual machines abandoned or with an high load that could be critical for all the infrastructure.
The graphs are generated on the fly from CAOS dashboard component and an user can easily specify the metric, the time range, the granularity and the graph resolution from web interface.
• wall clock time: a performance metric that records the time in seconds taken to execute a block of code (global or per project in a specific period and a given granularity);
• CPU efficiency: is a relationship between wall clock time and CPU time (global or per project in a specific period and a given granularity);
• VRAM: is the amount of virtual memory used (global or per project in a specific period); • instances: number of virtual machines in a project or in a specific compute node (in a
specific period);
• VCPU: virtual CPU number and usage in a project or in a specific compute node (in a specific period);
• usages: amount of VCPU, VRAM, instances and CPU efficiency compared to quota (in a specific period).
From the dashboard a user can select a time window and its granularity of each metric.
Figure 2.Inside the red circle we can see the available metrics from which a user can choose.
4.2 Accounting in CAOS
The accounting section of the dashboard allows the user to retrieve comprehensive graphs (see figure 3) or tabular results (see figure 4) of a project on the cloud infrastructure. We decided not retrieving data from single users in the cloud, because our target is to monitor the real usage of the infrastructure. Another point we are focus on is the way to find if there are any significant problems like virtual machines abandoned or with an high load that could be critical for all the infrastructure.
The graphs are generated on the fly from CAOS dashboard component and an user can easily specify the metric, the time range, the granularity and the graph resolution from web interface.
There is also a functionality to check the overall use of the cloud and navigate through the usage history for all projects or for a specific one.
Figure 3. In this picture we can see the data accounting of the many projects. Within the shown 15 days, a particular Lhcb project used a lot of CPU time in few days.
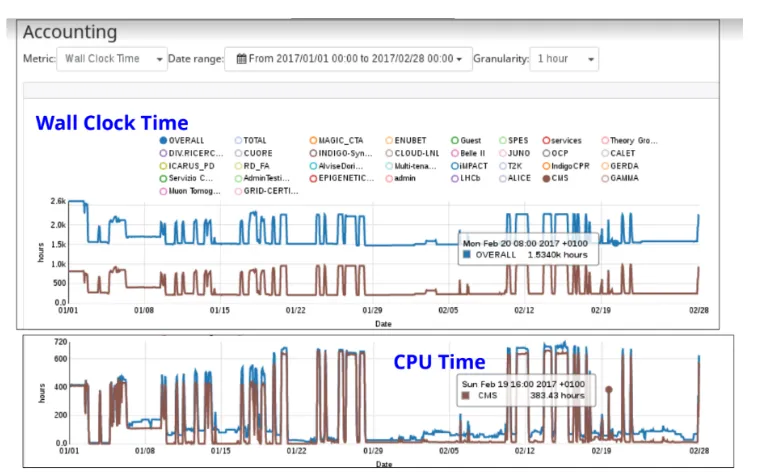
Figure 4.In this picture we can see the data accounting in two tables, one for wall clock time the other for CPU time consumed.
5 Monitor use cases in the cloud
Figure 5.Wall clock time and CPU time for CMS project and overall when a batch cluster is working in the cloud.
In our infrastructure we have a project, the Epigenetics experiment, which sometimes needs some dedicated computing nodes without overcommitment of CPU and RAM because it has to perform intensive CPU jobs with high throughput for only short time.
CAOS is useful for dealing with overcommitment of CPU and RAM. The situation de-picted in figure 6 reports the case of two projects, Epigenetics and CMS, where the former has some dedicated compute nodes with no overcommitment of CPU and RAM. The CMS project deploys an elastic cluster and shares physical resources with the rest of the cloud in-frastructure. The efficiency of the CPU is high whenever the Epigenetics project allocates resources on the dedicated compute node. We can see from date 15/01/2018 to 18/01/2018 the 100% CPU efficiency for the Epigenetics project because VCPU corresponds to bare CPU (no overcommitment) and the experiment runs some jobs using all the CPUs of the compute node in that period.
Figure 6. CPU efficiency of an elastic batch cluster compared to dedicated compute node without
overcommitment.
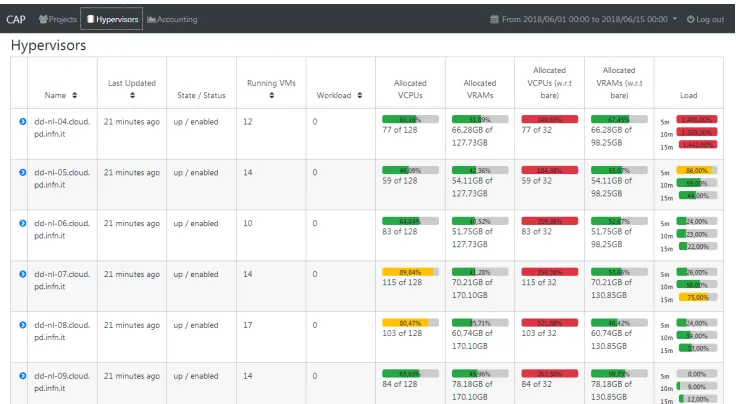
In figure 7 we can see the hypervisor tab of CAOS dashboard. In our cloud infrastructure we have an overcommitment of CPU and RAM, this allows us to increase the number of in-stances running on one compute node at the cost of reducing the performance of the inin-stances in the case all virtual machines in the compute node are working together in intensive way. Typically we define a CPU and RAM allocation ratio of 1.5:1 so with this configuration the scheduler can allocates 1.5 VCPUs for each bare real CPU, and 1.5 GB of VRAM for each 1 GB of real bare RAM.
In this screenshot we can see how many virtual machines are running in the compute nodes. How many virtual CPU are allocated inside the computer nodes and how many virtual RAM has been allocated. We can check also the relationship between the real CPU, RAM and the VCPU, VRAM at time of the query. The last column is the load of the host as reported by the command line tool “top”.
Figure 7.Compute node monitor.
6 Conclusion
This article illustrates the architecture and the features of the Control Application for Open-Stack. The most important key points for the application are:
• the collector leverages standard OpenStack services;
• the resources are tracked at different levels (e.g. per project or per compute node); • current and past resource usage is easily determined, stored and presented and retrieved in
a quick way from dashboard;
• no modification is required to the main cloud installation.
To increase CAOS performance we are going to change the Ceilometer backend from MongoDB to Gnocchi and we are planning also to read metrics directly from Gnocchi instead of from the CAOS backend. Gnocchi allows to customize and aggregate metrics in a simple way so we are evaluating if the backend is useful anymore.
References
[1] P. Andreetto et al, The Cloud Area Padovana: from pilot to production, J. Phys.: Conf. Ser. 898 052007
[2] Enol Fernández Del Castillo, Diego Sardacci, Álvaro López García -The EGI Feder-ated Cloud e-Infrastructure,https://cyberleninka.org/article/n/616383
More info and documentation at EGI federated cloud, https://www.egi.eu/federation/
egi-federated-cloud
[3] P. E. Mazzon, M. Menguzzato, G. Sella, M. Sgaravatto,Progetto CloudVeneto.it - Sta-tus Report, Technical Report, May 2016
[4] Ceilometer project, "Ceilometer" [software], version stable/ocata. Available fromhttps: //github.com/openstack/ceilometer
More documentation athttps://docs.openstack.org/ceilometer/latest/
[5] OpenStack project, "Openstack" [software], version stable/ocata. Available fromhttps: //github.com/openstack
More documentaion at OpenStack project home page:http://www.openstack.org
[6] CAOS project, "CAOS" [software]. version v0.1.3. Zendo DOI: 10.5281/zendo.1488605, 15 Novembre 2018. Avilabe fromhttps://zenodo.org/record/1488605
[7] Here there is the INFN central CI and CD fro CAOS,https://baltig.infn.it/caos/caos [8] Gnocchi project, "Gnocchi" [software], version stable v3.0. Available fromhttps://github.
com/gnocchixyz/gnocchi
[9] Elixir project. "Elixir" [software]. Available fromhttps://github.com/elixir-lang/elixir This is a dynamic, functional language designed for building scalable and maintainable applications. More info athttps://elixir-lang.org/
[10] Angular framework, "AngularJS" [software]. Version 6.1.2, 2018. Available fromhttps:
//github.com/angular/angular
More info from Angular framework -https://angular.io/
[11] Accounting definition, fromEnd-to-End DSL Architectures, ISBN:1587050870, page 60. Available fromhttps://books.google.fr/books?isbn=1587050870
[12] Thain D, Tannenbaum T, and Livny M,Distributed Computing in Practice: The Con-dor Experience, Concurrency and Computation: Practice and Experience, Vol. 17, No. 2-4, pages 323-356, February-April, 2005.