_____________________________________________________________________________________________________ *Corresponding author: E-mail: Dr.leilakolahi@yahoo.com;
(Past name: British Journal of Medicine and Medical Research, Past ISSN: 2231-0614, NLM ID: 101570965)
The Association between Body Mass Index and
Absenteeism
Seyed Akbar Sharifian
1, Omid Aminian
1, Leila Kolahi
1*,
Seyed Amir Hossein Morshed Zadeh
1and Hossein Mohseni
21
Department of Occupational Medicine, Center for Research on Occupational Diseases, Tehran University of Medical Sciences, Tehran, Iran.
2
Department of Health Professional, HSE Management SAIPA Group, Tehran, Iran.
Authors’ contributions
This work was carried out in collaboration between all authors. Authors SAS and LK designed the study, performed the statistical analysis, wrote the protocol, and wrote the first draft of the manuscript. Authors OA and SAHMZ managed the analyses of the study. Author HM managed the literature searches. All authors read and approved the final manuscript.
Article Information
DOI: 10.9734/JAMMR/2017/38219 Editor(s): (1)Mohamed Essa, Department of Food Science and Nutrition, Sultan Qaboos University, Oman.
Reviewers: (1)Monda Vincenzo, University of Study of Campania “Luigi Vanvitelli”, Italy.
(2)Mra Aye, Melaka Manipal Medical College, Malaysia. (3)Azantsa Kingue Gabin Boris, University of Yaounde 1, Cameroon. Complete Peer review History:http://www.sciencedomain.org/review-history/22452
Received 18th November 2017 Accepted 14th December 2017 Published 26th December 2017
ABSTRACT
Aims: This study was conducted to determine the relationship between Body Mass Index and
Absenteeism.
Study Design: This article is a retrospective.
Place and Duration of Study: This study included 905 eligible employees in the Saipa automobile
factory in 2016.
Methodology: Demographic information, occupational characteristics and employees’ health
status and information about employee’s absences were collected from health records of staff recurrent examinations filled out by experts and physicians and from the employee absentee registration system. Ultimately, the collected data were analyzed using SPSS, version 20.
Results: Of the 905 employees participated in the study, 141 (15.6%) had authorized absenteeism
(due to ill) and 105 (11.6%) had Unauthorized absenteeism. With and without controlling for any potential confounders, the Gross Absence Rate (GAR), Sickness Absence Rate (SAR) were in
overweight and obese employees more than normal weight employees (P-value< 0.05) but there was no significant difference between the two Absence Frequency Rate (AFR) and Unauthorized Absence Rate (UAR) indicators in terms of BMI (P-value> 0.05).
Conclusion: According to the results; obese employees are more often absent from work due to
illness and absent longer. Also development and implementation of public educational programs with particular emphasis on high-risk individuals, and focusing on healthy lifestyle and workers can be effective, resulting in improvements in physical and general health of the personnel.
Keywords: Body Mass Index; absenteeism.
1. INTRODUCTION
In recent decades, the number of overweight and obese people has shown a rapid growth worldwide. In 2008, it had been estimated that 1.5 billion adults aged 20 yrs. or older would be over weighted, of which over 200 million were obese men and about 300 million were obese women [1]. Further estimates predict 47% increase in obese men and 36% in obese women by 2035 and these rates could be 60% and 50% in obese men and obese women respectively [2]. It is considered as an annoying issue due to the risk of obesity to health. Overweighting or obesity are identified as the major risk factors of mortality and the cause of many diseases’ outbreaks including many types of cancers, cardiovascular disease (CVD) and a number of risk factors such as an increase in cholesterol level, hypertension, inactivity and diabetes Type II [1,3]. The serious obesity’s outcomes include lung problems, bone disorders, digestive complications, and sleep disorders, social and psychosocial disorders.
Consequently, the obesity significantly increases economic costs of health care in the various communities. On the other hand, increased body mass index (BMI) can increase treatment and early disability costs, which may also affect the feedback of their work [4]. Therefore, it is conceivable that, in addition to its negative effects on health, it may cause adverse effects on work, such as decreased productivity,
absenteeism and increased work-related
pensions, which altogether can lead to increased direct and indirect costs and heavy economic losses in an organization [5]. For example, absence-related costs include direct costs associated with factors such as overtime work, over-hiring, use of staff as part-time alternatives, monitoring time to address the problems of the absenteeism, the costs of absenteeism’s control programs and the salary for absent workers. Indirect costs include reduced morale and loss of productivity [1,3,6].
The short-term absence from work (less than 7 days) is not only indicative of inappropriate individual health status, but also can be known as a strong predictor for longer absenteeism (more than 7 days). In addition with an increase in the levels of absenteeism (more than 4), the likelihood of no return to work increases. Therefore, absence from long-term work is a
serious risk factor for the permanent
abandonment of work, which results in the loss of an experienced and useful workforce [7].
For this reason, recently, the obesity and absenteeism has been considered by some researchers and in some studies, the association between obesity and obesity has been confirmed and rejected in some other [6-11]. These contradictions may be happened because there are some defects in these studies e.g. because of the lack of transparency of the health status and obesity of the staff, the absence may be considered to be due to obesity or illness alternatively or in some studies, company’s reported data was used to assess staff absences, but in many studies, absences was reported by the individuals’ self-declaration [6,9,12]. It seems that the accuracy of data collection obtained from information about absenteeism based on their records in company is more than the self-declaration of individuals [13-15]. Another disadvantage of previous studies is the report of height and weight by individuals themselves, which may be false or incorrect. And at the end, some of these studies do not pay attention to having another disease, which in turn can influence the outcome of the study on the presence or absence of the
association between obesity and the
BMI of employees in a car factory were evaluated.
2. MATERIALS AND METHODS
This retrospective study was carried out on a total number of 1108 employees in the Saipa automobile factory in 2016 using the census. We included all employees of the Saipa automobile factory who were working during 2016 and aged 20-64 years (inclusion criteria). If in the staffs’ health records or individual declarations, any history of diseases such as cardiac, pulmonary, musculoskeletal diseases and so on, was recorded, the person will be excluded from the study. Also, the participants with a history of sport club’s activities for more than one year or achieved a sport medal and documents that highlights the individual’s physical activity distinguishing her/him from other staff, will be excluded. According to theses exclusion criteria, 203 were excluded and the sample size was reduced to 905 individuals. The data used in this
study included demographic information,
occupational characteristics and employees’ health status such as age, education, the field of work, marital status, number of children, smoking, work experience, disease history have been extracted from health records of staff recurrent examinations filled out by experts and physicians.
The weight and height of the staff was measured using a gauge scaled for height measurement ranged from 5 to 150 kg, with the accuracy of 500 grams. All individuals were measured without shoes or heavy clothing. BMI was calculated using weight (kg) divided by height
(m2). Through WHO (World Health Organization)
criteria employees assigned to normal weight
(BMI, 18.5 to 249 kg/m2), overweight (BMI, 25.0
to 29.9 kg/m2) and obese ((BMI >30 kg/m2)
groups.
Also, information about employee’s absences (such as the type of absenteeism due to illness (authorized), unauthorized absenteeism, the
frequency of absences, the reason for
absenteeism) was collected from the employee absentee registration system.
It should be considered that we accessed to data only by the personnel ID. Therefore, it was no need to obtaining consent from personnel separately.
The absenteeism indicators were calculated as follows:
Gross Absence Rate GAR)=
Total authorized and unauthorized absences in a one-year period (days)
ܶݐ݈ܽ ݓݎ݇݀ܽݕݏ ݅݊ ܽ ݊݁ − ݕ݁ܽݎ ݁ݎ݅݀ × 100
Sickness Absence Rate (SAR)=
்௧ ௨௧௭ௗ ௦௦ ௗ௨ ௧ ௦௦ (ௗ௬௦) ்௧ ௪ௗ௬௦ ି௬ ௗ × 100
Absence Frequency Rate (AFR) =
்௧ ௨௧௭ௗ ௗ ௨௨௧௭ௗ ௦௦ ି௬ ௗ
Total employees in a one-year period × 100
Unauthorized Absence Rate (UAR)=
்௧ ௨௨௧௭ௗ ௦௦ ି௬ ௗ Total workdays in a one-year period × 100
2.1 Statistical Analysis
Finally, the data was entered into SPSS software version 20 and we used Chi-square test to compare the qualitative data in terms of BMI. According to the results of the Kolmogorov-Smirnov test indicating non-normalization of the data distribution, the Kruskal-Wallis test was used for the comparison of the mean quantitative data in terms of BMI and the ratio of the request for discharge (absenteeism) from obese or overweight employees was used compared to the normal weight employees using the Odd Ratio. Also, for adjusting the confounding variables affecting the association among the means of absenteeism indicators in terms of BMI, the univariate analysis of variance was applied. In all analyzes, the significance level was considered < 0.05.
3. RESULTS AND DISCUSSION
3.1 Results
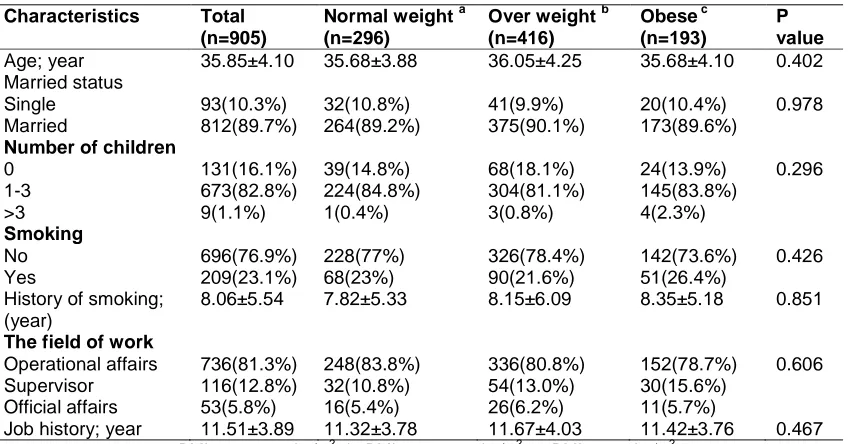
A total number of 905 employees participated in the study including 32.7% normal weight with the mean age of 35.68 ± 3.88 years, 46% overweight with the mean age of 36.05 ± 4.25 years and 21.3% obese with the mean age of 35.68 ± 4.10 years. The association between the main characteristics of the staff and the BMI is shown in Table 1.
Table 1. Basic characteristics of employees
Characteristics Total (n=905)
Normal weight a (n=296)
Over weight b (n=416)
Obese c (n=193)
P value
Age; year 35.85±4.10 35.68±3.88 36.05±4.25 35.68±4.10 0.402
Married status
Single 93(10.3%) 32(10.8%) 41(9.9%) 20(10.4%) 0.978
Married 812(89.7%) 264(89.2%) 375(90.1%) 173(89.6%)
Number of children
0 131(16.1%) 39(14.8%) 68(18.1%) 24(13.9%) 0.296
1-3 673(82.8%) 224(84.8%) 304(81.1%) 145(83.8%)
>3 9(1.1%) 1(0.4%) 3(0.8%) 4(2.3%)
Smoking
No 696(76.9%) 228(77%) 326(78.4%) 142(73.6%) 0.426
Yes 209(23.1%) 68(23%) 90(21.6%) 51(26.4%)
History of smoking; (year)
8.06±5.54 7.82±5.33 8.15±6.09 8.35±5.18 0.851
The field of work
Operational affairs 736(81.3%) 248(83.8%) 336(80.8%) 152(78.7%) 0.606
Supervisor 116(12.8%) 32(10.8%) 54(13.0%) 30(15.6%)
Official affairs 53(5.8%) 16(5.4%) 26(6.2%) 11(5.7%)
Job history; year 11.51±3.89 11.32±3.78 11.67±4.03 11.42±3.76 0.467
a: BMI, 18.5-24.9 kg/m2; b: BMI, 25.0-29.9 kg/m2; c: BMI >30.0 kg/m2.
the levels of absenteeism rate in overweight employees compared to employees with normal BMI was 2.95 and in obese employees was 5.38 times higher than employees with normal BMI (OR (95% CI) overweight vs. normal weight 2.95 (1.73-5.02) and obese versus normal weight: 5.38 (3.06-9.44)).
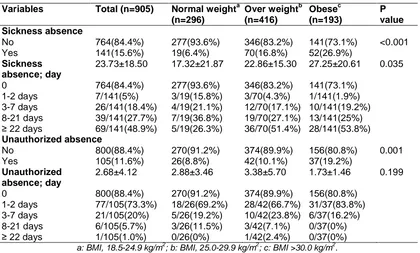
Also, the levels of absenteeism (days) in obese, overweight workers and those with normal BMI was 27.25 ± 20.61, 22.86 ± 15.30, 17.32 ± 21.87 days. Therefore, obese or overweight employees had higher levels of absenteeism due to medical reasons (P-value = 0.035).
The mean levels of unauthorized absenteeism, in 8.8% of normal weight employees, 10.1% of overweight employees, and 19.2% of obese employees, were 2.88 ± 3.46, 3.38 ± 5.70 and 1.73±1.46 days, respectively. Although the unauthorized absenteeism ratio in overweight employees was 1.16 times higher than normal weight employees and in obese employees was 2.46 times higher compared to normal weight employees (OR 95% CI). Overweight vs. normal weight 2.95 (1.73-5.02) and Obese vs Normal weight: 5.38 (3.06-9.44); P-value = 0.001), there was no significant difference between these groups in the levels of unauthorized absenteeism (P-value = 0.119) (Table 2).
Finally, the evaluation of absenteeism indicators suggested that the GAR was maximum in obese employees with a mean of 7.49 ± 7.96% and
minimum in normal weight employees with a mean of 3.41 ± 6.04% (P-value = 0.007). SAR was also found in obese employees with an average of 10.32 ± 7.81 percent more than overweight employees with an average of 8.65 ± 5.79 percent and normal weight employees with an average of 6.56 ± 8.28 percent (P-value = 0.035). There was no significant difference between the two AFR and UAR indicators in terms of BMI (P-value> 0.05).
On the other hand, there was still a significant
association between BMI and GAR/SAR
indicator (P-value<0.05), even though
confounding variables such as age, marital status, smoking and the field of work were controlled and there was still no significant association between BMI and the two other indicators (P-value>0.05) (Table 3).
3.2 Discussion
According to the results of the current study, male staff with the mean age of 35.85 ± 4.10 years of which more than half (67.3%) were overweight or obese and only 32.7% were normal weight. The mean age of obese or overweight employees was also higher than
normal weight employees, although this
difference was not statistically significant. Other factors such as marital status, type of occupation, smoking, etc. were also not
significantly different based on the BMI
Table 2. Comparison duration and frequency of absenteeism over one year period for normal weight, overweight, and obese employees
Variables Total (n=905) Normal weighta (n=296)
Over weightb (n=416)
Obesec (n=193)
P value Sickness absence
No 764(84.4%) 277(93.6%) 346(83.2%) 141(73.1%) <0.001
Yes 141(15.6%) 19(6.4%) 70(16.8%) 52(26.9%)
Sickness absence; day
23.73±18.50 17.32±21.87 22.86±15.30 27.25±20.61 0.035
0 764(84.4%) 277(93.6%) 346(83.2%) 141(73.1%)
1-2 days 7/141(5%) 3/19(15.8%) 3/70(4.3%) 1/141(1.9%)
3-7 days 26/141(18.4%) 4/19(21.1%) 12/70(17.1%) 10/141(19.2%)
8-21 days 39/141(27.7%) 7/19(36.8%) 19/70(27.1%) 13/141(25%)
≥ 22 days 69/141(48.9%) 5/19(26.3%) 36/70(51.4%) 28/141(53.8%)
Unauthorized absence
No 800(88.4%) 270(91.2%) 374(89.9%) 156(80.8%) 0.001
Yes 105(11.6%) 26(8.8%) 42(10.1%) 37(19.2%)
Unauthorized absence; day
2.68±4.12 2.88±3.46 3.38±5.70 1.73±1.46 0.199
0 800(88.4%) 270(91.2%) 374(89.9%) 156(80.8%)
1-2 days 77/105(73.3%) 18/26(69.2%) 28/42(66.7%) 31/37(83.8%)
3-7 days 21/105(20%) 5/26(19.2%) 10/42(23.8%) 6/37(16.2%)
8-21 days 6/105(5.7%) 3/26(11.5%) 3/42(7.1%) 0/37(0%)
≥ 22 days 1/105(1.0%) 0/26(0%) 1/42(2.4%) 0/37(0%)
a: BMI, 18.5-24.9 kg/m2; b: BMI, 25.0-29.9 kg/m2; c: BMI >30.0 kg/m2.
Table 3. Evaluation of absenteeism indicators in terms of BMI and controlling the cofounders
Variables Total (n=905)
Normal weighta (n=296)
Over weightb (n=416)
Obesec (n=193)
P value
GAR 6.24±7.09 3.41±6.04 6.60±6.54 7.48±7.96 0.007
GAR†† 6.12±6.85†† 3.46±6.10†† 6.22±6.51†† 7.56±7.35†† 0.008
SAR 8.99±7.01 6.56±8.28 8.65±5.79 10.32±7.81 0.035
SAR†† 8.87±6.66 6.39±8.44 8.56±5.74 10.25±6.89 0.044
AFR 0.25±0.24 0.21±0.21 0.28±0.26 0.25±0.19 0.361
AFR†† 0.25±0.24†† 0.20±0.22†† 0.26±0.28†† 0.25±0.19†† 0.356
UAR 0.68±0.70 0.74±0.77 0.80±0.88 0.55±0.40 0.324
UAR†† 0.70±0.72†† 0.76±0.91†† 0.77±0.79†† 0.56±0.42†† 0.398
††: Evaluation of mean using Univariate Analysis of Variance with adjusted Married Status, Age, Smoking, and the field of work
GAR: Gross Absence Rate; SAR: Sickness Absence Rate; AFR: Absence Frequency Rate; UAR: Unauthorized Absence Rate.
In this respect, studies in various countries
demonstrate that workforce’s BMI has
experienced an upward trend in obesity and overweight in recent years [16,17]. The role of weight gain in the workforce can be very considerable. Increased BMI of the staff not only increases the risk of occupational injuries and accidents, but also increases the risk of morbidity and pathogens [18].
Based on assumptions, the job can lead to weight gain through various mechanisms, for example, job stress can affect behaviors such as
drinking alcohol and sitting activities style. Or psychological stress may lead to adjustment of weight-gain-related endocrine factors, also long working hours, overtime work and shifts, may result in fatigue and reduced behaviors can prevent obesity and ultimately abdominal obesity [19]. Several studies have proved that aging, low
education and low physical activity are
On the other hand, the results of this study suggested that 43.7% of overweight and obese employees had experiences absenteeism (due to illness) of which 29.3% had unauthorized absenteeism. Thus, the odd ratio of obesity in overweight and obese employees compared to normal weight employees was 2.95 and 5.38, respectively, while in unauthorized absenteeism it was 1.46 and 2.46 respectively. The level of absenteeism of obese or overweight employees (>20 days) has been more than the other employees. There was a statistically significant association between the BMI and absenteeism due to illness (authorized absenteeism) (P-value <0.05). However, this difference was not significant when it was compared with authorized
absenteeism in general (P-value> 0.05).
Therefore, it can be conceivable that the frequency and the level of absenteeism due to illness in employees with a BMI of more than 25 kg/m2 was more than other employees. The evaluation of absenteeism indicators also confirmed this result. The GAR and SAR of these employees were significantly higher than those of normal weight (P-value <0.05) and in contrast, there was a significant difference between AFR and UAR in BMI of employees (P-value> 0.05).
In line with the current study, the results of many previous studies also indicated that obese or overweight employees had often more absences than normal-weight employees and obese staff had experienced much more absences due to illness than their colleagues. Also, these differences were mainly related to the number of cases and the long-term absenteeism (11.6, [22-24]).
It should be considered that the association between obesity and absenteeism may also be influenced by the individual’s physical and sport activity, although different studies have reported contradictory results [25,26]. Also, some studies have shown that obesity can be associated with
several chronic diseases. However, the
absenteeism in obese employees can also occurred due to other reasons. For example, obesity can result in adverse psychological and social consequences and may impose a negative impact on employee collaboration. Obesity can also lead to complaints of musculoskeletal problems in the staff. Chronic disease, just like psychosocial and musculoskeletal problems which can be caused by obesity, may increase the level of absenteeism in obese staff [27-29]. In our study, in order to investigate and control more and more confounding variables, it was
tried to exclude employees who had regular or professional sports activities or chronic disease. Thus, the impact of this factor can be eliminated even better from the obtained results. Also, by adjustment of other confounders such as age, marital status, smoking and the field of work, we analyzed again, the association between the authorized absence (due to illness) and the BMI that was still significant. However, there was a significant correlation between BMI and two indicators of GAR and SAR and no significant correlation was found between BMI and the two other indicators. Therefore, the strength of the current study may be considered to take into account confounding variables or to control them in evaluation of the association between obesity and absenteeism. On the other hand, one of the most important limitations of this study is its cross-sectional design. Because due to the special design of cross-sectional studies, it is infeasible to conclude any causal inference and to determine the time relations between variables. Also due to its cross-sectional entity, it cannot find individuals’ information beforehand, transfers between shifts and job positions.
4. CONCLUSION
Finally, as a general conclusion, it can be conceivable that obesity can be associated with the incidence and the levels of absenteeism. Therefore, preventive strategies about obesity should be considered including prevention from occupational risk through encouraging programs to alter health risk factors (such as lifestyle, weight gain and so on) by individuals. Because obesity can be considered as the strongest risk
factor for chronic diseases (such as
cardiovascular disease). Therefore, lack of funding or incorrect implementation of these strategies may disrupt the workforce and divert them from their role in the workplace and increase the incidence and the levels of absenteeism (especially due to illness).
CONSENT
It is not applicable.
ETHICAL APPROVAL
It is not applicable.
COMPETING INTERESTS
REFERENCES
1. World Health Organisation: WHO
Factsheet No. 311, March 2011.
Available:http://www.who.int/mediacentre/f actsheets/fs311/en/
2. Wang YC, McPherson K, Marsh T,
Gortmaker SL, Brown M. Health and economic burden of the projected obesity trends in the USA and the UK. Lancet. 2011;378:815–825.
3. Kearns K, Dee A, Fitzgerald AP, Doherty
E, Perry IJ. Chronic disease burden associated with overweight and obesity in Ireland: the effects of a small BMI reduction at population level. BMC Public Health. 2014;14(1):143.
4. Bustillos AS, Vargas KG, Gomero-Cuadra
R. Work productivity among adults with varied Body Mass Index: Results from a
Canadian population-based survey.
Journal of Epidemiology and Global Health. 2015;5(2):191-9.
5. Schulte PA, Wagner GR, Ostry A,
Blanciforti LA, Cutlip RG, Krajnak KM, et al. Work, Obesity, and Occupational Safety and Health. American Journal of Public Health. 2007;97(3):428-36.
6. Lehnert T, Sonntag D, Konnopka A,
Riedel-Heller S, König HH. Economic costs of overweight and obesity. Best practice &
research Clinical Endocrinology &
Metabolism. 2013;27(2):105-15.
7. Hestbaek L, Leboeuf-Yde C, Manniche C.
Is low back pain part of a general health pattern or is it a separate and distinctive entity? A critical literature review of comorbidity with low back pain. Journal
of Manipulative and Physiological
Therapeutics. 2003;26(4):243-52.
8. Fitzgerald S, Kirby A, Murphy A, Geaney
F. Obesity, diet quality and absenteeism in a working population. Public Health Nutrition. 2016;19(18):3287-95.
9. Pronk NP, Martinson B, Kessler RC, Beck
AL, Simon GE, Wang P. The association between work performance and physical activity, cardiorespiratory fitness, and
obesity. J Occup Environ Med.
2004;46:19-25.
10. Arena VC, Padiyar KR, Burton WN,
Schwerha JJ. The impact of Body Mass Index on short-term disability in the
workplace. J Occup Environ Med.
2006;48:1118-1124.
11. Jans MP, van den Heuvel SG, Hildebrandt
VH, Bongers PM. Overweight and obesity
as predictors of absenteeism in the working population of the Netherlands. Journal of Occupational and Environmental Medicine. 2007;49(9):975-80.
12. Merchant JA, Kelly KM, Burmeister LF,
Lozier MJ, Amendola A, Lind DP, KcKeen A, Slater T, Hall JL, Rohlman DS, Buikema
BS. Employment status matters: A
statewide survey of quality-of-life,
prevention behaviors, and absenteeism and presenteeism. Journal of Occupational and Environmental Medicine. 2014;56(7): 686-98.
13. Hensing H, Swedish Council on
Technology Assessment in Health Care (SBU). Chapter 4. Methodological aspects in sickness-absence research. Scand J Public Health. 2004;63 :44–48.
14. van Poppel MN, de Ver HC, Koes BW,
Smid T, Bouter LM. Measuring sick leave: A comparison of self-reported data on sick leave and data from company records. Occup Med. 2002;52:485- 490.
15. Severens JL, Mulder J, Laheij RJ, Verbeek
AL. Precision and accuracy in measuring absence from work as a basis for calculating productivity costs in The Netherlands. Soc Sci Med. 2000;51:243- 249.
16. Allman-Farinelli MA, Chey T, Merom D,
Bauman AE. Occupational risk of
overweight and obesity: An analysis of the Australian Health Survey. Journal of Occupational Medicine and Toxicology. 2010;5(1):14.
17. Caban AJ, Lee DJ, Fleming LE,
Gómez-Marín O, LeBlanc W, Pitman T. Obesity in US workers: The national health interview survey, 1986 to 2002. American Journal of Public Health. 2005;95(9):1614-22.
18. Antunes LC, Levandovski R, Dantas G,
Caumo W, Hidalgo MP. Obesity and shift work: Chronobiological aspects. Nutrition Research Reviews. 2010;23(1):155-68.
19. Yamada Y, Ishizaki M, Tsuritani I.
Prevention of weight gain and obesity in occupational populations: A new target of health promotion services at worksites.
Journal of Occupational Health.
2002;44(6):373-84.
20. Morikawa Y, Nakagawa H, Miura K,
Soyama Y, Ishizaki M, Kido T, Naruse Y, Suwazono Y, Nogawa K. Effect of shift work on body mass index and metabolic
parameters. Scandinavian Journal of
21. Akbari H, Mirzaei R, Nasrabadi T, Gholami-Fesharaki M. Evaluation of the effect of shift work on serum cholesterol
and triglyceride levels. Iranian Red
Crescent Medical Journal. 2015;17(1).
22. Aldana SG. Financial impact of health
promotion programs: A comprehensive review of the literature. American Journal of Health Promotion. 2001;15(5):296-320.
23. Schmier JK, Jones ML, Halpern MT. Cost
of obesity in the workplace. Scandinavian Journal of Work, Environment & Health. 2006;5-11.
24. Moreau M, Valente F, Mak R, Pelfrene E,
De Smet P, De Backer G, Kornitzer M. Obesity, body fat distribution and incidence of sick leave in the Belgian workforce: The Belstress study. International Journal of Obesity. 2004;28(4):574.
25. Fogelholm M. Physical activity, fitness and
fatness: relations to mortality, morbidity and disease risk factors. A systematic review. Obesity Reviews. 2010;11(3):202-21.
26. Wille N, Bullinger M, Holl R, Hoffmeister U,
Mann R, Goldapp C, Reinehr T,
Westenhöfer J, Egmond-Froehlich A,
Ravens-Sieberer U. Health-related quality of life in overweight and obese youths: results of a multicenter study. Health and Quality of Life Outcomes. 2010;8(1):36.
27. Craig CL, Marshall AL, Sjöström M,
Bauman AE, Booth ML, Ainsworth BE, Pratt M, Ekelund UL, Yngve A, Sallis JF, Oja P. International physical activity questionnaire: 12-country reliability and validity. Medicine & Science in Sports & Exercise. 2003;35(8):1381-95.
28. van der Starre RE, Coffeng JK, Hendriksen
IJ, van Mechelen W, Boot CR.
Associations between overweight, obesity, health measures and need for recovery in
office employees: A cross-sectional
analysis. BMC Public Health. 2013;13(1): 1207.
29. Howard JT, Potter LB. An assessment of
the relationships between overweight, obesity, related chronic health conditions
and worker absenteeism. Obesity
Research & Clinical Practice. 2014;8(1): e1-5.
_________________________________________________________________________________
© 2017 Sharifian et al.; This is an Open Access article distributed under the terms of the Creative Commons Attribution License (http://creativecommons.org/licenses/by/4.0), which permits unrestricted use, distribution, and reproduction in any medium, provided the original work is properly cited.
Peer-review history: