_____________________________________________________________________________________________________
*Corresponding author: E-mail: [email protected]
www.sciencedomain.org
Evaluation of Ricketts Frontal Analysis Reference
Points on Cone-beam Computed Tomography
Images
Anderson Jaña Rosa
1*, Lívia Gonçalves da Silva
2,
Lilian Atsumi Simabuguro Chinem
1, Beatriz de Souza Vilella
1,
Alexandre Trindade Simões da Motta
1and Oswaldo de Vasconcellos Vilella
11
Department of Orthodontics, Universidade Federal Fluminense, Niterói (RJ), Brazil. 2
Faculty of Dentistry, Universidade Federal Fluminense, Niterói (RJ), Brazil.
Authors’ contributions
This work was carried out in collaboration between all authors. Authors AJR and OVV designed the study, performed the statistical analysis and wrote the first draft of the manuscript. Authors AJR, LGS and LASC managed the analyses of the study. Authors BSV and ATSM managed the literature searches. Authors AJR, BSV, ATSM and OVV revised the manuscript for intellectual content. All authors read and approved the final manuscript.
Article Information
DOI:10.9734/BJMMR/2017/32451 Editor(s): (1) James Anthony Giglio, Adjunct Clinical Professor of Oral and Maxillofacial Surgery, School of Dentistry, Virginia Commonwealth University, Virginia, USA. Reviewers: (1) João Paulo Schwartz, Universidade Estadual Paulista (UNESP-FOAr), Brazil. (2)Mayadhar Barik, All India Institute of Medical Sciences, India. (3)Mehmet Zahit Adisen, Kirikkale University, Turkey. (4)Jose Ricardo Vancetto, São Paulo State University (UNESP), Araraquara, Brazil. Complete Peer review History:http://www.sciencedomain.org/review-history/18667
Received 26th February 2017 Accepted 12th April 2017 Published 17th April 2017
ABSTRACT
Aims: The aim of this study was to evaluate the reliability of Ricketts frontal analysis reference points when viewed by three-dimensional images.
Methodology: The points related to the Ricketts frontal analysis were identified at multiplanar reconstructions (MPR) and three-dimensional reconstructions (Rec 3D) obtained from cone-beam computed tomography. The cephalometric landmarks, following the author’s definition, were located by three operators: an orthodontist, a radiologist, and a student coursing the eighth period of the graduation course in dentistry. After two weeks, the landmarks were repeated. The values of
Rosa et al.; BJMMR, 20(11): 1-9, 2017; Article no.BJMMR.32451
X, Y, and Z were obtained for each point, and the intraclass correlation coefficient was calculated. Results: The intraclass correlation coefficient values were less than 0.45 (poor reliability) at 15 points viewed from the three-dimensional reconstructions and 8 points for the multiplanar reconstructions, including the intra and interobserver assessments. It was not possible to identify the J point on the CBCT images.
Conclusion: The multiplanar reconstructions allow greater reliability in the identification of the anatomical landmarks for both intra and interobserver assessments. To improve its reliability, Ricketts frontal analysis reference points must be defined in the three planes of space before transfer to three-dimensional images, or new anatomical references can be adopted.
Keywords: Anatomic landmarks; cephalometry; cone-beam computed tomography; orthodontics; three-dimensional image; ricketts frontal analysis.
1. INTRODUCTION
Radiographs are the most commonly used imaging studies for diagnosis and orthodontic treatment planning. Due to the two-dimensional (2D) representation of three-dimensional (3D) structures, this method presents well-known limitations: overlapping of anatomical structures, distortion, and magnification [1-3]. Moreover, an incorrect positioning of the head during the acquisition of the image results in other diagnostic problems [4].
Two-dimensional images are traditionally preferred for marking skeletal and dental points and making tracings and measurements [4]. However, it is common for operators to make mistakes when scoring some points due to the overlapping of anatomical structures in an assessed region, which is also influenced by the quality and resolution of the image. Points often erroneously marked are the porion, condyle, orbital, basion, gonion, anterior and posterior nasal spine, and lower incisor apex [1,5].
Cone-Beam Computed Tomography (CBCT) provides a high-resolution image and brings together in a single exposure all traditional orthodontic images [6]. It allows the structures’ visualization in tomographic images, facilitating the analysis of a desired region, produces less artifacts when there are metallic restorations in the mouth, and enables the digital removal of the overlapping structures, such as the vertebral spine. Those features facilitate the identification and marking of the cephalometric points.
The development of a 3D cephalometric analysis requires the selection of reference points in the three spatial planes (axial, sagittal, and coronal) that are easy to identify and reproduce [7-9]. The reconstructed images from the tomographic slices are considered reliable in relation to the
cephalometric points and the measurement of distances between them [10,11]. However, the data obtained may be affected by the anatomical reference structure, the anatomical plane used, and the operator’s level of training [12].
Posteroranterior (PA) radiographs enable the evaluation of the transverse dimension and asymmetries that would not be identified by a lateral view. Among the various analyses proposed, the Ricketts analysis [13,14]. Is the most widely used. Its greater acceptance is due to the understandable standard rules and appropriate value suggestions according to age [15,16]. However, there are only a few studies that have evaluated the PA radiograph and points of the frontal analysis in tomographic images.
The points used on Ricketts [13,14] frontal analysis, when marked over 3D images, have not yet been studied. Therefore, the aim of this study is to determine if these points have the reliability needed to be located in this kind of image.
2. MATERIALS AND METHODS
From a total of 142 orthodontic pretreatment CBCT exams from the institution`s archive, those that were indicated for retreatment, lacked incisors or first permanent molars, or presented with supernumerary teeth or severe asymmetries were excluded. Exams with poor-quality images were also excluded. From the 98 remaining exams, three CBCT images (one male and two females, aged between 21 and 23 years) were randomly selected. The research protocol was approved by the institutional review board in 2016, under the number 1.717.953.
The voxel size was 0.4 mm and the FOV (field of view) was 220 mm. Patients were advised to maintain the natural position of the head and the teeth in centric occlusion. The base images or raw data were exported to a DICOM (Digital Imaging and Communication in Medicine) file type.
2.1 Landmarks Identification
The anatomic reference points were marked using two different visualization modes available in the In Vivo Dental 5.1 software (Anatomage, San Jose, CA, USA) — a multiplanar reconstruction (MPR) of axial, coronal, and sagittal slices and a 3D virtual image model (Rec 3D) — according to the methodology adopted in a previous study [17].
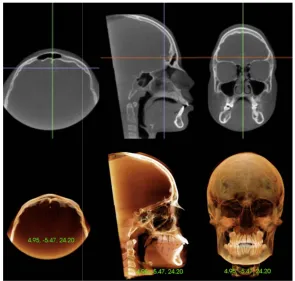
Three operators (an orthodontist, a radiologist, and a student coursing the eighth period of the graduation course in dentistry) were trained and calibrated to identify the reference points using a CBCT scan that was not included in the sample. Subsequently, they marked the points on the three scans of the sample and repeated the procedure after a two-week interval. The operators initially carried out the marking of points in the MPR, automatically obtaining the values of the X (axial), Y (coronal), and Z (sagittal) coordinates by clicking on the image with the marking tool. Next, the evaluation was performed in the Rec 3D (Fig. 1).
The reference points are described in Table 1.
2.2 Statistical Analysis
The intraclass correlation coefficient (ICC) was obtained comparing the X, Y, and Z values that corresponded to the exact location of each point on axial, coronal, and sagittal axes to assess the reliability of the measurements. The ICC values were classified as highly reliable, if the result was greater than or equal to 0.90; reliable, between 0.75 and 0.90; acceptable, between 0.45 and 0.75; and poor, if less than or equal to 0.45.The SPSS v20.0 software (Chicago, IL, USA) was used to calculate the ICC. It was considered the mixed two-way model, with absolute agreement and a 0.95 confidence interval.
3. RESULTS
The frequency results of the intra and interobserver reliability for the MPR and Rec 3D are shown in Tables 2 to 6. The frequency of highly reliable values was higher in intraobserver assessment than in the interobserver assessment in the two types of visualization.
Table 2 shows the frequency of intraobserver reliability for the X, Y, Z, and total values to MPR. The ICC value was greater or equal to
0.90 on 51 assessments (77.27%), with higher frequency for the X coordinate (95.45%).
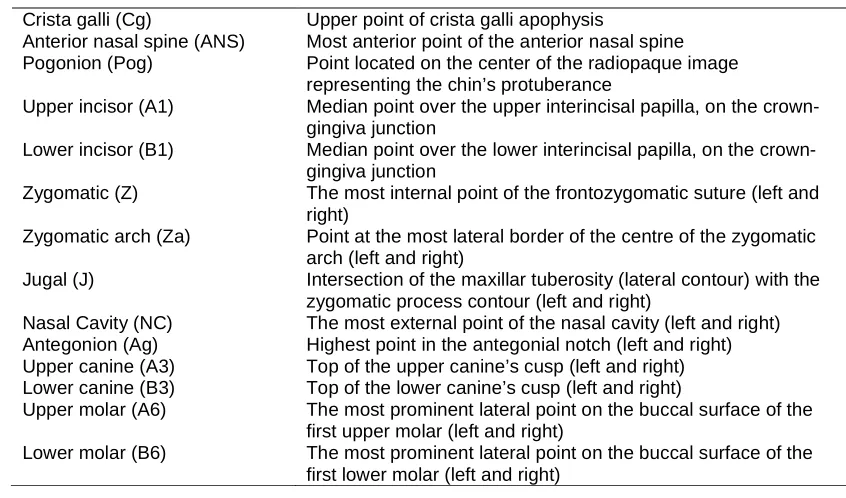
Table 1. Cephalometric landmarks
Crista galli (Cg) Upper point of crista galli apophysis
Anterior nasal spine (ANS) Most anterior point of the anterior nasal spine Pogonion (Pog) Point located on the center of the radiopaque image
representing the chin’s protuberance
Upper incisor (A1) Median point over the upper interincisal papilla, on the crown-gingiva junction
Lower incisor (B1) Median point over the lower interincisal papilla, on the crown-gingiva junction
Zygomatic (Z) The most internal point of the frontozygomatic suture (left and right)
Zygomatic arch (Za) Point at the most lateral border of the centre of the zygomatic arch (left and right)
Jugal (J) Intersection of the maxillar tuberosity (lateral contour) with the zygomatic process contour (left and right)
Nasal Cavity (NC) The most external point of the nasal cavity (left and right) Antegonion (Ag) Highest point in the antegonial notch (left and right) Upper canine (A3) Top of the upper canine’s cusp (left and right) Lower canine (B3) Top of the lower canine’s cusp (left and right)
Upper molar (A6) The most prominent lateral point on the buccal surface of the first upper molar (left and right)
Fig. 1. Identification of the Crista
Multiplanar (upper; X, Y, and Z coordinates) and
The Y and Z coordinates showed lower reliability (ICC ≤0.45) for two variables (9.09%), which represented four assessments i
(6.06%).
The frequency of interobserver reliability for the MPR view is shown in Table 3. The ICC was greater or equal to 0.90 in 22 assessments (33.33%), with the highest frequency for the X coordinate (77.27%). The Z coordinate presented the lowest reliability, with 5 assessments in a total of 12 (18.18%).
Table 4 shows the frequency of intraobserver reliability for the Rec 3D. From 66 assessments, 54 (81.81%) presented the ICC ≥ 0.90. The Y coordinate showed the highest frequency (90.90%). There were five assessments (7.57%) with the ICC ≤ 0.45. X and Z coordinates contributed with two assessments in each one (9.09%).
The frequencies of interobserver reliability for the Rec 3Dshowed that all 19 assessments (28.78%) with ICC ≥ 0.90 belonged to the X coordinate (Table 5). From a total of 16 assessments
Rosa et al.; BJMMR, 20(11): 1-9, 2017; Article no.BJMMR.32451
rista galli (Cg) point, one of the landmarks used in the study. Multiplanar (upper; X, Y, and Z coordinates) and 3D reconstruction (lower) view
The Y and Z coordinates showed lower reliability 0.45) for two variables (9.09%), which represented four assessments in the total
The frequency of interobserver reliability for the MPR view is shown in Table 3. The ICC was greater or equal to 0.90 in 22 assessments (33.33%), with the highest frequency for the X coordinate (77.27%).
The Z coordinate presented the lowest reliability, with 5 assessments in a total of 12
Table 4 shows the frequency of intraobserver 66 assessments, ≥ 0.90. The Y coordinate showed the highest frequency (90.90%). There were five assessments (7.57%) 0.45. X and Z coordinates contributed with two assessments in each one
es of interobserver reliability for the Rec 3Dshowed that all 19 assessments (28.78%) 0.90 belonged to the X coordinate (Table 5). From a total of 16 assessments
(24.24%) that presented ICC ≤ 0.45, 14 (63.63%) belonged to the Z coordinate.
The estimated intra and interobserver reliability by ICC for each landmark evaluated with their respective X, Y, and Z coordinates for the MPR and Rec 3D can be seen in Table 6. In the same table, the clinical reliability is presented, following the criteria by the ICC range. Measurements with low reliability (ICC ≤ 0.45).
The points B1, A3(l), B3(r), B3
showed reliable performance (ICC> 0.75) when viewed through the MPR.
Values considered acceptable (0.45<ICC in both types of view have been checked for points Cg, A6(r), B6(r), and B6(l). When the MPR view was separately analyzed, the points considered acceptable were ANS, Pog, Me, A1, and A3(r). For the Rec 3D, only the Ag( was considered acceptable.
The points Z(r), Z(l), Za(r), Za(l), NC( and Ag(l) showed low reliability (ICC
both view modes. The points ANS, Pog, Me, A1, B1, A3(r), A3(l), B3(r), B3(l), and A6(
reliability for the Rec 3D.
; Article no.BJMMR.32451
g) point, one of the landmarks used in the study. 3D reconstruction (lower) view
0.45, 14 (63.63%)
estimated intra and interobserver reliability by ICC for each landmark evaluated with their respective X, Y, and Z coordinates for the MPR and Rec 3D can be seen in Table 6. In the same table, the clinical reliability is presented, following y the ICC range. Measurements with
, B3(l), and A6(l) showed reliable performance (ICC> 0.75) when
Values considered acceptable (0.45<ICC ≤0.75) been checked for ). When the MPR view was separately analyzed, the points considered acceptable were ANS, Pog, Me, A1, ). For the Rec 3D, only the Ag(r) point
Table 2. Frequency of the intraobserver reliability estimated for the X, Y, and Z coordinates in the visualization of multiplanar reconstructions (MPR)
Range Coordinates
X Y Z Total
n % n % n % n %
ICC≥0.90 21 95.45 18 81.81 12 54.54 51 77.27 0.75< ICC< 0.90 1 4.54 2 9.09 3 13.63 6 9.09 0.45< ICC ≤ 0.75 0 0.00 0 0.00 5 22.72 5 7.57
ICC ≤ 0.45 0 0.00 2 9.09 2 9.09 4 6.06
Total 22 100.0 22 100.0 22 100.0 66 100.0
Table 3. Frequency of the interobserver reliability estimated for the X, Y, and Z coordinates in the visualization of multiplanar reconstructions (MPR)
Range Coordinates
X Y Z Total
n % n % n % n %
ICC≥0.90 17 77.27 0 0.00 5 22.72 22 33.33
0.75< ICC< 0.90 1 4.54 10 45.45 7 31.81 18 27.27 0.45< ICC ≤ 0.75 1 4.54 8 36.36 5 22.72 14 21.21
ICC ≤ 0.45 3 13.63 4 18.18 5 22.72 12 18.18
Total 22 100.0 22 100.0 22 100.0 66 100.0
Table 4. Frequency of the intraobserver reliability estimated for the X, Y, and Z coordinates in the visualization of 3D reconstructions (Rec 3D)
Range Coordinates
X Y Z Total
n % n % n % n %
ICC ≥ 0.90 18 81.81 20 90.90 16 72.72 54 81.81
0.75< ICC< 0.90 1 4.54 0 0.00 3 13.63 4 6.06 0.45< ICC ≤ 0.75 1 4.54 1 4.54 1 4.54 3 4.54
ICC ≤ 0.45 2 9.09 1 4.54 2 9.09 5 7.57
Total 22 100.0 22 100.0 22 100.0 66 100.0
Table 5. Frequency of the interobserver reliability estimated for the X, Y, and Z coordinates in the visualization of 3D reconstructions (Rec 3D)
Range Coordinates
X Y Z Total
n % n % n % n %
ICC ≥ 0.90 19 86.36 0 0.00 0 0.00 19 28.78
0.75< ICC< 0.90 3 13.63 2 9.09 2 9.09 7 10.60 0.45< ICC ≤ 0.75 0 0.00 18 81.81 6 27.27 24 36.36
ICC ≤ 0.45 0 0.00 2 9.09 14 63.63 16 24.24
Total 22 100.0 22 100.0 22 100.0 66 100.0
4. DISCUSSION
Several authors were concerned to validate marking cephalometric landmarks in 3D images [5,10,12,17-21]. Some studies have assessed the reliability and reproducibility of landmarks viewed preferably in cephalometric radiographs obtained in the lateral view. This study aimed to
evaluate the points originally used by Ricketts [13,14] in radiographic images obtained in the posteroanterior view.
Rosa et al.; BMMR, 20(11): 1-9, 2017; Article no.BJMMR.32451
6
Table 6. Reliability estimated by intraclass correlation (ICC) for each landmark and each coordinate in the visualization of multiplanar (MPR) and three-dimensional (Rec 3D) reconstructions, and recommendation for clinical use
Landmark MPR intraobserver MPR interobserver Rec 3D intraobserver Rec 3D interobserver Clinical reliability
X Y Z X Y Z X Y Z X Y Z
Cg 1.000 0.999 0.992 0.984 0.702 0.727 0.999 0.915 0.995 0.995 0.618 0.541 Acceptable both
ANS 0.993 0.997 0.962 0.968 0.774 0.587 0.976 0.986 0.746 0.975 0.783 -0.038 Acceptable MPR
Pog 0.991 1.000 0.837 0.903 0.787 0.563 0.809 0.964 0.996 0.878 0.308 0.547 Acceptable MPR
Me 0.993 0.998 0.976 0.913 0.734 0.936 0.907 0.693 0.972 0.909 0.403 0.035 Acceptable MPR
A1 0.999 0.999 0.934 0.978 0.707 0.765 0.961 0.986 0.993 0.967 0.737 0.314 Acceptable MPR
B1 0.999 0.998 0.971 0.970 0.780 0.971 0.957 0.975 0.973 0.962 0.671 0.138 Reliable MPR
Z(r) 0.988 0.969 0.107 0.980 0.815 0.800 0.992 0.998 0.966 0.996 0.706 0.022 Poor
Z(l) 0.997 0.976 0.498 0.990 0.790 0.061 0.995 0.980 0.970 0.995 0.715 0.243 Poor
Za(r) 0.835 0.849 0.789 0.240 0.189 0.242 0.997 0.982 0.898 0.992 0.726 0.320 Poor
Za(l) 0.926 0.862 0.569 0.673 0.181 -0.023 0.999 0.966 0.964 0.996 0.588 0.327 Poor
J - - - ---
NC(r) 0.977 0.979 0.674 0.990 0.695 0.196 0.992 0.977 0.841 0.990 0.689 0.252 Poor
NC(l) 0.981 0.986 0.544 0.957 0.704 0.159 0.963 0.966 0.852 0.969 0.691 0.281 Poor
Ag(r) 0.945 0.391 0.834 0.107 0.193 0.762 0.921 0.944 0.914 0.873 0.537 0.863 Reliable Rec 3D
Ag(l) 0.956 -0.316 0.411 -0.172 0.438 0.753 0.971 -0.302 -0.447 0.785 0.452 0.681 Poor
A3(r) 0.998 1.000 0.981 0.974 0.735 0.815 0.049 0.980 0.990 0.983 0.656 0.284 Acceptable MPR
A3(l) 0.999 0.999 0.994 0.968 0.782 0.907 0.493 0.986 0.955 0.939 0.698 0.193 Reliable MPR
B3(r) 0.960 0.987 0.975 0.891 0.804 0.860 0.949 0.972 0.985 0.954 0.738 0.126 Reliable MPR
B3(l) 0.975 0.987 0.992 0.929 0.839 0.900 0.970 0.973 0.979 0.980 0.768 0.172 Reliable MPR
A6(r) 0.998 0.975 0.976 0.961 0.689 0.974 0.985 0.974 0.945 0.987 0.740 0.756 Acceptable both
A6(l) 0.996 0.994 0.942 0.974 0.774 0.807 0.057 0.970 -0.015 0.957 0.668 0.637 Reliable MPR
B6(r) 0.999 0.999 0.976 0.949 0.739 0.665 0.968 0.977 0.955 0.962 0.710 0.497 Acceptable both
B6(l) 0.998 0.997 0.668 0.978 0.770 0.557 0.954 0.977 0.986 0.967 0.735 0.627 Acceptable both
a specialist in orthodontics, and a radiologist, we tried to conduct the study with operators from different levels of training, similar to De Oliveira et al. [12].
As the localization of J point is established by image superimposition of two anatomical structures (maxillary tuberosity and zygomatic apophysis), it was not possible to mark this reference point in the MPR or the Rec 3D. Therefore, 22 anatomical landmarks were identified in each image generated by the three CBCT exams. The marking was repeated after a two-week interval. It is valid to assume that the greater the time interval between the markings, the more reliable the results will be, because the operators will landmarks be less able to remember their previous choices of landmark positions.
The ICC values were <0.45 for 15 landmarks in the 3D Rec visualization, while there were 8 landmarks for the MPR. In the present study, the correlation in marking the anatomical points is similar to the results reported by Da Neiva et al. [17]. Thus, the MPR were more reliable than the Rec 3Dconcerning landmark identification. Definitions adopted for the reference points were originally developed for 2D images related to cephalometric radiographs taken in the posteroanterior view. The greatest similarity between radiographic images and the multiplanar view could explain this result. In the multiplanar view the internal structures can be better evaluated, as in the radiographic images. It is also likely that some structures are less visible in the Rec 3D, unlike those completed by Couceiro and Vilella [9]. However, these authors used printed images, which may have influenced the results. In the present study, the images were evaluated directly on the screen. Furthermore, the evaluated points were not the same in both studies.
As occurred in previous studies, [12,17] the frequency of reliable values was higher in the intraobserver assessment than in the interobserver assessment in the two types of visualization. The frequency of ICC values in the MPR view was greater than 0.75 in 86.36% of intraobserver assessments, reaching 100% for the X coordinate, whereas the frequency for interobserver assessment was 60.6% (81.81% for the X coordinate).
When the 3D images were analyzed, it was observed that values higher than 0.75% occurred
in 87.87% of the intraobserver assessments, against 39.38% of interobserver assessments. The poor results related to interobserver assessments were due to the low values found for the Y and Z coordinates (both 9.09%), in contrast to the results presented by Da Neiva et al. [17] in whose study the ICC values for the Y and Z coordinates were greater than 0.75%, representing 63.3% and 70.0%, respectively. Da Neiva et al. [17] redefined the points in 3 planes, whereas in the present research the definitions proposed by Ricketts in a single plan were used.
The variation between intra and interobserver assessments was higher for the Rec 3D (48.49%) than for the MPR visualization (25.76%). This result suggests that there should be an association between both visualization types to increase the reliability of marking the anatomical landmarks, as emphasized by Hassan et al. [20].
The points related to dental structures showed reliable [B1, A3(l), B3(r), B3(l), and A6(l)] or acceptable [A1, A3(r), A6(r), B6(r) and B6(l)] ICC values for the MPR. Regarding the Rec 3D, the A6(r), B6(r), and B6(l) points proved to be acceptable. The results for the MPR were similar to those found by other authors [12,17,19] who evaluated the points related to central incisors and first molars. With respect to the Rec 3D, the values were lower.
The Cg point showed acceptable values for the two visualization types. The ANS, Pog, and Me landmarks were acceptable only for MPR views. De Oliveira et al. [12] and Da Neiva et al. [17] found higher ICC values when evaluating these points. The results suggest that points located on the sagittal plane are more easily identifiable due to the similarity between the sagittal slice and the cephalometric lateral radiograph [21]. This reasoning can also be applied with respect to the Cg point, due to the similarity between the coronal slice and the posteroanterior cephalometric radiograph.
Rosa et al; BJMMR, 20(11): 1-9, 2017; Article no.BJMMR.32451
landmarks could be defined in the three planes of space or new anatomical references could be adopted.
5. CONCLUSION
The multiplanar reconstructions allow for greater reliability in the identification of anatomical landmarks related to the Ricketts frontal analysis, both in the intra and in the interobserver evaluations.
CONSENT
It is not applicable.
ETHICAL APPROVAL
All authors hereby declare that all experiments have been examined and approved by the appropriate ethics committee and have therefore been performed in accordance with the ethical standards laid down in the 1964 Declaration of Helsinki.
COMPETING INTERESTS
Authors have declared that no competing interests exist.
REFERENCES
1. Baumrind S, Frantz RC. The reliability of head film measurements. Landmarks identification. Am J Orthod. 1971;60:111– 127.
2. Ahlqvist J, Eliasson S, Welander U. The cephalometric projection. Principles of image distortion in cephalography. Dentomaxillofac Radiol. 1983;12:101–108. 3. Lou L, Lagravere MO, Compton S, Major
PW, Flores-Mir C. Accuracy of measurements and reliability of landmarks identification with computed tomography (CT) techniques in the maxillofacial area: A systematic review. Oral Surg Oral Med Oral Phatol Oral Radiol Endod. 2007; 104:402–411.
4. Chien PC, Parks ET, Eraso F, Hartsfield Jr JK, Roberts WE, Ofner S. Comparison of reliability in anatomical landmark identification using two-dimensional digital cephalometrics and three-dimensional cone beam computed tomography in vivo. Dentomaxillofacial Radiol. 2009;38:262-273.
5. Quintero JC, Trosien A, Hatcher D, Kapila S. Craniofacial imaging in orthodontics: Historical perspective, current status, and
future developments. Angle Orthod. 1999; 69:491-506.
6. Ludlow JB, Davies-Ludlow LE, Brooks SL. Dosimetry of two extraoral direct digital imaging devices: NewTom cone beam CT
and Orthophos Plus DS panoramic unit. Dentomaxillofac Radiol.
2003;32:229-234.
7. Mozzo P, Procacci C, Tacconi A, Martini PT, Bergamo IA. A new volumetric CT machine for dental imaging based on the cone beam technique: Preliminary results. Eur Radiol. 1998;8:1558–1564.
8. Moshiri M, Scarfe WC, Hilgers ML, Scheetz JP, Silveira AM, Farman AG. Accuracy of linear measurements from imaging plate and lateral cephalometric images derived from cone-beam computed tomography. Am J Orthod Dentofacial Orthop. 2007;132:550-560.
9. Couceiro CP, Vilella OV. 2D / 3D Cone-Beam CT images or conventional radiography: Which is more reliable? Dental Press J Orthod. 2010;15:40-41. 10. Gribel BF, Gribel MN, Frazao DC,
McNamara JA Jr, Manzi FR. Accuracy and reliability of craniometric measurements on lateral cephalometry and 3D measurements on CBCT scans. Angle Orthod. 2011;81:26–35.
11. Berco M, Rigali Jr PH, Miner RM, DeLuca S, Anderson NK, Will LA. Accuracy and reliability of linear cephalometric measurements from cone-beam computed tomography scans of a dry human skull. Am J Orthod Dentofacial Orthop. 2009;136:17.e11-17.e19.
12. De Oliveira AEF, Cevidanes LHS, Phillips C, Motta A, Burke B, Tyndall D. Observer reliability of three-dimensional cephalometric landmark identification on cone-beam computerized tomography. Oral Surg Oral Med Oral Pathol Oral Radiol Endod. 2009;107:256-265.
13. Ricketts RM. Perspectives in the clinical application of cephalometrics. Angle Orthod. 1981;51:115-150.
14. Ricketts RM, Bench RW, Hilgers JJ, Schulholf AB. An overview of computerized cephalometrics. Am J Orthod. 1972;61:1-28.
16. Snodell SF, Nanda RS, Currier GF. A longitudinal cephalometric study of transverse and vertical craniofacial growth. Am J Orthod Dentofacial Orthop. 1993; 104:471-483.
17. Da Neiva MB, Soares AC, Lisboa CO, Vilella OV, Motta AT. Evaluation of cephalometric landmark identification on CBCT multiplanar and 3D reconstructions. Angle Orthod. 2015;85:11-17.
18. McClure SR, Sadowsky PL, Ferreira A, Jacobson A. Reliability of digital versus conventional cephalometric radiology: A comparative evaluation of landmark identification error. Semin in Orthod. 2005; 11:98–110.
19. Zamora N, Llamas JM, Cibrián R, Gandia JL, Paredes V. A study on the reproducibility of cephalometric landmarks when undertaking a three-dimensional (3D) cephalometric analysis. Med Oral Patol Oral Cir Bucal. 2012;17:678-688. 20. Hassan B, Nijkamp P, Verheij H, et al.
Precision of identifying cephalometric landmarks with cone beam computed tomography in vivo. Eur J Orthod. 2013; 35:38-44.
21. Schlicher W, Nielsen Ib, Huang JC, et al. Consistency and precision of landmark identification in three-dimensional cone beam computed tomography scans. Eur J Orthod. 2012;34:263–275.
_________________________________________________________________________________ © 2017 Rosa et al.; This is an Open Access article distributed under the terms of the Creative Commons Attribution License (http://creativecommons.org/licenses/by/4.0), which permits unrestricted use, distribution, and reproduction in any medium, provided the original work is properly cited.
Peer-review history: