19
Method of Evaluating Camouflage of Texture Based On
WSSIM And Nature
Kiran MoreP
1
P
, Borse S. BP
2
P
1
P
PG Student, E&TC Department, LGN Sapkal College of Engineering, Anjaneri, Nashik
P
2
P
Assistant Professor, E&TC Department, LGN Sapkal College of Engineering, Anjaneri, Nashik
Abstract- The human vision system fails to identify the camouflaged image on the surface the object, while visualizing the corresponding image. This is due to the inherent limitation of human vision system. The object which is camouflaged in the background are kept smaller in size and chromatically matches with the surrounding. The success of military weapons depends upon their ability to remain unseen by enemy. Thus camouflaging strategy is purposely employed in military applications.
In this paper, we will focus on the essential of the human visual system, and its relative significance of various factors affecting camouflage texture. The method detailed here develops a computational vision model to examine the perceived differences between camouflage texture image and background image. A variety of features for measuring thresholds for differentiating between small changes in naturalistic images have been studied to direct the camouflage texture designing.
Keywords- Camouflaging, texture analysis, WSSIM, SSIM
INTRODUCTION
The role of images in present day communication has been steadily increasing, but digital images are subjected to variety of distortion during acquisition, processing, compression, storage, transmission and reproduction, which signifies the assessment of image quality for numerous image processing applications. Camouflaging is the process of disguising object to mix-it with its background & surrounding. A camouflaged object cannot be seen by the human vision system. Decamouflaging is the identification of the object which is hidden in the background. For the Decamouflaging and texture analysis is carried out in different zones of the image.
Based on outcomes of the analysis,
camouflaged object is detected. This paper mainly focuses on application of decamouflaging in defense services. Normally, de-camouflaging is done in unsupervised way
that is we don’t have knowledge about the normal background nor the camouflaged object. The camouflaged objects are surface objects that are inducted for hiding characteristics by merging their visuals with the nature of background. The nature of the background is marked by its color, texture, shape, motion etc. We use texture analysis method to identify the hidden object. The assessment of image quality is important for numerous image processing technologies, where target of image quality assessment (IQA) algorithms is to automatically assess the quality of images which is consistent with human visual sensation.
II. IMAGE SIMILARITY INDICES In image processing, image similarity indices evaluate the amount of structural information which is maintained by a processed image in relation to a reference image. Image similarity indices measure the similarity of an image Y in relation to a reference image X and they are of crucial importance in concrete applications. One application is to use image similarity indices together with digital image
processing. Filtering data and their
compression, transmission, or recreation in the form of digital image may sometimes degrade its visual quality. An accurate similarity measure help to set the parameter settings (e.g. threshold cut-offs) for optimal output in image processing. Two prominent examples, the Structural Similarity Image Metric (SSIM) and Multi-scale MS-SSIM, Structural Similarity operate under the assumption that human visual perception is highly adapted for extracting structural information from a scene.
20
structural similarity measure (SSIM), which evaluates image fidelity through estimation of local correlations scaled by local contrast and brightness comparisons. This correlation-based SSIM performs better than MSE in the similarity assessment of natural images. As the correlation method estimates only linear dependence, distortions resulting from multiple image sources or non-linear image processing such as nonlinear filtering can cause SSIM to underestimate or overestimate the actual structural similarity in the image. In this article, we propose a new similarity measure that replaces the correlation and contrast comparisons of SSIM by results obtained from a nonparametric test that has better capability to capture general dependence, including linear and nonlinear dependence in the conditional mean regression function as a special case. This similarity measure technique applied to images
for noise contamination, filtering, and
watermarking, provides consistent image structural fidelity measure than commonly used measures. [1]
Weighted structural similarity index (WSSIM) which represents perceptual image quality based on the structural information .WSSIM is an objective image quality metric and is better than traditional quantitative measures such as MSE and PSNR. This project demonstrates the WSSIM based camouflage texture evaluation and nature image features in terms of human visual perception. Camouflage texture is used to increase the survivability of soldiers and mission effectiveness by preventing visual observation and other military sensors from detecting both the soldiers and their equipment. [1]
III. IMAGE RETRIEVAL TECHNIQUE To avoid the time-consuming, and laborious, expensive image annotations, whose descriptions may even fail to capture the essence of image content, there is growing study on content-based image retrieval (CBIR). A drawback with such approaches is the semantic gap between low-level content and higher-level contents. The image domain is too broad and deep for global features to reduce the semantic gap. A major turnaround witnessed in recent years from global feature representations for images to local features and descriptors, like spatial model features and robust local shape characterizations. Computation of similarity can
be performed with feature vectors, region-based signatures, or summarized local features. But, many such methods sometimes lack the necessary detailing to represent any complex image semantics. [3]
Camouflage images contain one or more hidden figures that remain imperceptible. In one possible explanation, the ability to delay the perception of the hidden figures is attributed to the theory that human perception works in two main phases: feature search and conjunction search. Effective camouflage images make feature based recognition problematic, and thus force the recognition process to utilize conjunction search, in which considerable effort and time is wasted. [2]
21
selection of feature vectors or regions may not fully describe the entire image, other methods are pursued by researchers to account for spatial dependence of image pixels. The Kullback– Leibler (K–L) distance measures the expected log ratio between two distributions with the expectation under one distribution. The unknown distributions required to be estimated to obtain the K– L distance. The estimation is, required to be restricted to a more specific parametric family, also by ignoring the spatial dependence among the image data. A correlation-based SSIM to account for the spatial relationship. Correlation captures a linear relationship, nonlinear or many sources of distortions may limit the performance of SSIM significantly. [3]
IV. TEXTURE ANALYSIS METHODS Approaches to texture analysis are usually categorized into the following methods:
a) Structural approaches represents a texture by defining primitives (micro texture) and a levels of spatial arrangements (macro texture) of those primitives. To explain the texture, one must define the primitives and rules of placement. The choice of a primitive and the probability of the chosen primitive to be kept at a given location can be a function of location or the primitives near the location.
b) Statistical approaches represent the texture indirectly by the non-definable properties that govern the distributions and relationships between the grey levels of an image. Methods based on 2nd-order statistics of pixel pairs have been shown to achieve higher rate of discrimination than the power spectrum and structural methods. [4]
c) Model based texture analysis, using fractal and stochastic models, tries to define an image texture by use of generative image model and stochastic model. The parameters of the model are estimated and then used for image analysis. The computational complexity arising in the estimation of stochastic model data is the main problem.
d) Transform methods of texture analysis, such as Fourier Transform, Gabor Transform and wavelet transforms represents an image in a
space whose coordinate system has an interpretation that is quite close to the characteristics of a texture. Methods based on the Fourier transform performs slowly in
practice, due to absence of spatial
localization. Gabor filters provide means for better spatial localization; however, their usefulness is low in practice as no single filter resolution at which one can localize a spatial structure in natural textures. Wavelet transform is better than all these methods mentioned above [5]
V. METHODOLOGY FOR CAMOUFLAGE TEXTURE EVALUATION
A new camouflage texture evaluation method based on WSSIM (Weight structural similarity) is given to access the effects of camouflage texture at first. Then nature image features between the camouflage texture and the background image are calculated to help direct the designing camouflage texture.
At first, the original and distorted images are divided into 8x8 non-overlapping blocks. The SSIM for each block is computed using equation, to form a matrix S as shown below where each element SRij R represents the SSIM
between corresponding sets of the blocks of the original and distorted images with coordinates (i , j )[6]
l ≤i ≤m=[H/8] and l ≤ j≤ m=[W/8]
(1)Where H and W represent the height and width of the image respectively. Human-eye is sensitive to edge and contour information of the image. Edges per unit area, e, can be estimated by detecting edges in an image, utilizing Canny extension of the Sobel operator and then congregating the edges detected within an 8x8 block. The value of e is placed close to the range [0, 1]. A block without edges have a value of 0. Secondly, the visual regions of interest map, E specified above is obtained for the original image as shown below. The values ERij R represents degree of visual importance of
each block with coordinates (i, j) as defined earlier Weighted structure similarity index (WSSIM) as the
S=
�
𝑠
11⋯ 𝑠
1𝑛⋮
⋱
⋮
𝑠
𝑚1⋯ 𝑠
𝑚𝑛�
22
E=
�
𝑒
11⋯ 𝑒
1𝑛⋮
⋱
⋮
𝑒
𝑚1⋯ 𝑒
𝑚𝑛�
(3)
WSSI is defined as the weighted average of the structural similarity indices SRijR in each local
block with coordinates (i, j) where each SRijR is
weighted with the corresponding visual region of interest values ERij.
Edges play an important role in the perception of images, and distorted edges, e.g., by blur, can greatly impact the perceived quality of an image. We therefore allocate greater weight to the scores on edge regions than on smooth and texture regions. For simplification, we fixed the weight for edge regions at 0.5. Smooth regions are important also, and the eye is reactive to such artifacts as false contouring, blocking, and high-frequency noise in smooth regions. While the error in the textures can also be perceptually significant, some distortions can be obscured or masked by the presence of textures. [7]
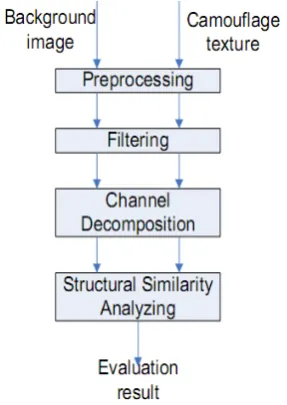
VI. MATLAB IMPLEMENTATION The illustration shows the camouflage texture assessment framework based on human visual model. The implementing formulae for these three methods on MATLAB are as follows:-
a) Variety of basic operations is performed to eliminate distortions from background image and camouflage texture.
b) A low-pass filter simulating the point spread function of the eye optics may be applied.
c) The luminance of camouflage texture and background image is compared as follows:
l (x, y)=
2𝜇𝑥𝜇𝑦+𝐶1𝜇𝑋2+𝜇𝑌2+𝐶2
(4)
Where l(x, y) is the luminance comparison function of the mean intensity µx and µy of the camouflage texture x and background image y respectively. CR1R is included to avoid instability,
value used in the model is around 6.5025. The contrast comparison function is given as follows:
C( x,y)=
(2𝜎𝑥𝑦+𝐶2)(𝜎𝑥2+𝜇𝑦2+𝐶2)
(5)
Where σRx Rand σRyR is the stand deviation and wechoose CR2R value as 58.5225.
We define the structure comparison function as follows:
S(x,y)=
(2𝜎𝑥𝑦+𝐶3)𝜎𝑥𝜎𝑦+𝐶3
(6)
Where σRxyR is the covariance and we choose a
value of CR3R as 58.5225. At last, the structural
similarity (SSIM) index between x and y can be drawn as
SSIM(x,y)=l(x,y)c(x,y)s(x,y) (7)
The camouflage texture is compared with each block of the background with same size to get the whole evaluation result by Weight-SSIM as follows:
WSSIM(X,Y)=1
𝑀∑𝑀𝑗=1𝑊𝑗𝑆𝑆𝐼𝑀(𝑥𝑗𝑦𝑗) (8)
Fig 1: Camouflage assessment Frame work for WSSIM
Where Wj is the weight of different block of background and M is the sum of the blocks. WSSIM is calculated three times on each pair of background image and camouflage texture for the red green and blue channels. The value will show the differences between the background image and the camouflage textures in RGB channels.
VII. RESULT
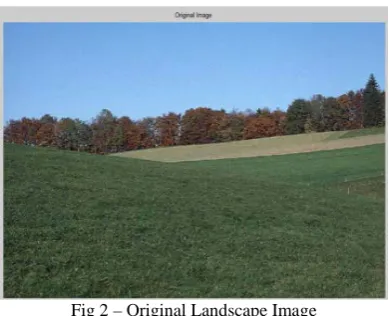
a) Original Landscape Image- Using WSSIM
23
0.8860, num. of closed areas = 2177. Index of similarity=1.
Fig 2 – Original Landscape Image
b) Texture 1 Image Landscape View- By using WSSIM and nature image feature analysis test we get parameters or feature values, like max. Luminance as 1, min .luminance = -0.5977, mean. Luminance = 0.9780, deviation of luminance = 0.1272, image entropy = 7.5361, correlation length = 0.8865, num. of closed areas = 2065, index of similarity=0.9780
Fig 3- Texture 1 image of landscape view
c) Texture 2 Image Landscape View By using WSSIM and nature image feature analysis test we get parameters or feature values, like max. Luminance = 1, min. luminance = -0.5529, mean. Luminance = 0.9812, deviation of luminance = 0.1167, image entropy = 7.5489, correlation length = 0.8865, num. of closed areas = 2184. Index of similarity = 0.9812.
So, as per the above parametric or nature image feature extraction we observe that we get of degree of similarity between the images based on calculation of correlation length and from entropy we can conclude that how original
the textures are. Also from calculations of closed areas we get closeness between the images.
Fig 4- Texture 2 image of landscape view
And finally from similarity index we get the similarity of the images in terms of luminance, contrast and structure by applying weightage at different regions of the images. From this result we can take the decision that whether to accept camouflage texture design or not and how to improve the texture pattern.
CONCLUSION
Images can be camouflaged to hide essential
data. The data can be reconstructed using many recreation techniques. The study discussed the WSSIM technique of data extraction which results in the proper extraction of image from the hidden image, and it provide higher clarity & data integrity compared to other process of image recreation.
REFERENCE
[1]H.Wanga, Diego M, S. Silwalb, A nonparametric test
based structural similarity measure for digital images, Sciencedirect Journal
[2]Hung-Kuo Chu, Wei-Hsin Hsu, Niloy J. Mitra, Daniel
Cohen-Or, Tien-Tsin Wong, Tong-Yee Lee Camouflage Images, 31TACM SIGGRAPH 201031T
[3]Dr.V.Karthikeyani ,Dr.P.Kamalakkannan, “Defect
identification Using texture analysis, K.S.R College of Arts & Science Tiruchengode, Journal of Computer Applications, Vol – 1, No.4, Oct – Dec 2008
[4]Nitin Gupta, Randhir Singh, Parveen Lehana, “Texture
Enhancement of Plants IR Images Using Genetic Algorithm, International Journal of Scientific and Research Publications, Volume 4, Issue 10, October 2014
[5]Kriti Jain, Nidhi Sethi, Vishal Sharma, “Skin texture
analysis for medical Diagnosis- A Review, IJARSE, Vol. No.4, Special Issue (02), February 2015
[6]Chaofeng Li , Alan Conrad Bovik, “Three-Component
Weighted Structural Similarity Index”, 2008