Product Sales Prediction Based on Sentiment
Analysis Using Twitter Data
Dipak Gaikar1,Bijith Marakarkandy2
1,2
Information Technology, Thakur College of Engineering & Technology, Mumbai-400101, India
Abstract—Online social media websites represent how
fundamental information is created, transferred and consumed. Social media, user generated content in the form of comments, blog posts and tweets establish a connection between the producers and the consumers of information. Today’s world is connected to each other via social network like Twitter millions of people connected to each other through that network. Tracking the pulse of the social media contain, enables companies to gain feedback and insight in how to improve and market products better. It continues to offer new opportunities for organizations to directly interact with their customers or audience, the aimed at monitoring the online reputation of an organization, brand or person, social media and search engine result.
This research paper uses a survey approach for movie sales prediction. This paper analyses, impact of the positive, negative, strongly positive and strongly negative online reviews of movies on the audience. It should be noted that the user feedback is given prior to watching the movie only on the basis of the online reviews. The result of this research will help the film industry to effectively address and meet the expectations of customers and stakeholder.This paper also investigates techniques for twitter data extraction using an API key.
Keywords—Twitter, Sentiment Analysis, ANOVA, Prediction,
Social Media, Data Mining.
I. INTRODUCTION
Due to its high popularity, Weblogs provide a wealth of information that can be very helpful in assessing the general public’s sentiments and opinions. It is therefore imperative to analyze them and distil useful knowledge that could be of economic values to vendors and other interested parties. Whereas marketing plays an important role for the newly released products, public opinion about the products might be crucial to determine their success in the long run. Analyzing the large volume of online reviews available would produce useful actionable knowledge that could be of economic values to vendors and other interested parties. Prediction of product performance is an extremely domain-driven task, for which a deep understanding of a variety of aspects involved are important. Previous studies have confirmed that the sentiments expressed in the online reviews are strongly correlated with the sales performance of products.
From the recent studies regarding writing the reviews, online opinions, online comments, discussion forums, the most stakes is taken by film industry, which includes videos, songs, movies, television programs, etc. It is very easy to get reviews about movies after or before its release from websites dedicated for movies and it was therefore decided to take up movie as a product in this study. If the prediction is focused on electronic goods, then it is required to
consider different companies/brands, but here for movies it is possible to get exact amount of the box office revenue information. There has been previous research and comparing the results with previous results was also another motivation. Various economic functions have been utilized to examine the relationship between opinions discovered from product reviews and revenue growth, stock trading volume change, as well as the bidding price variation in commercial Websites, such as eBay.
Social media is increasingly being used by a large section of population in India. The content generated on social media websites have been largely untapped by businesses for gaining customer insights and predicting real outcomes. Microblogging services in recent times have been a popular communication tool among internet users. It generates millions of daily messages for popular websites. Microblogging is online word of mouth branding like Twitter, is now serving as electronic word of mouth (eWOM), forming a eWOM branding which is based on social networking and trust. Twitter has been swamped with active users during the last years and much attention has been given in analyzing the social behavior and opinions of users. The wide-spread popularity of online social networks and the resulting availability of data have enabled the investigation of new research questions, such as the analysis and estimation of public opinion on various subjects [30].
The focus of this study is on movies as it is of interest to the social media community. Large numbers of social media users discuss movies and box-office revenues this data is easily available from Internet Movie Data Base (IMDB). Microblogging sites like twitter also generate tweets which help people make decisions about watching a movie. The focus of this research is movie revenue prediction, but can be extended to other consumer products.
II.RELATED WORK
(Duan et al., 2008) showed that both a movie’s box office revenue and WOM valence significantly influence WOM volume. WOM volume in turn leads to higher retrieve other customer’s online articulations from web-based consumer opinion platforms. The relevance of these motives and their impact box office performance. This positive feedback mechanism highlights the importance of WOM in generating and sustaining retail revenue.
(Chevalier & Mayzlin, 2006) hypothesized that buyers suspect that many reviewers are authors or other biased parties. They found marginal (negative) impact of 1-star reviews is greater than the (positive) impact of 5-star reviews. The results suggest that new forms of customer communication on the Internet have an important impact on customer behavior.
Work on sentiment analysis found using a formal approach is the work by (Simancík and Lee, 2009). The paper presents a method to detect sentiment of newspaper headlines, in fact partially using the same grammar formalism that later will be presented and used in this work, however without the combinatorial logic approach. The paper focus on some specific problems arising with analysing newspaper headlines, e.g. such as headline texts often do not constitute a complete sentence, etc. However the paper also present more general methods, including a method for building a highly covering map from words to polarities based on a small set of positive and negative seed words. This method has been adopted by this thesis, as it solves the assignment of polarity values on the lexical level quite elegantly, and is very loosely coupled to the domain. However, their actual semantic analysis, which unfortunately is described somewhat shallow in the paper, seems to suffer from severe problems with respect to certain phrase structures, e.g. dependent clauses.
eWOM is a form of communication, defined as a: “statement made by potential, actual, or former customers about a product or company, which is made available to a multitude of people and institutions via the Internet” (Hennig-Thurau, Gwinner, Walsh , & Gremle, 2004,p. 39). eWOM may be less personal in that it is not face-to-face (or maybe just personal in a different way than in the past), but it is more powerful because it is immediate, has a significant reach, is credible by being in print, and is accessible by others (Hennig-Thurau et al., 2004, p. 42). In terms of immediacy of eWOM branding, microblogging can occur very near the purchase decision or even during the purchase process (Barton, 2006). Thus, microblogging has significant implications for the success of advertisers, businesses, and products as a new eWOM communications, and understanding the ramifications of microblogging is critical for the stakeholders.
Davis and Khazanchi (2008) evaluated the impact of eWOM attributes and factors on e-commerce sales using real-world data from a multiproduct retail e-commerce firm. The researchers validated a conceptual model of eWOM and its impact on sales. Their research showed that the interactions among eWOM postings, product category, volume of postings, and product were statistically significant in explaining changes in product sales. Cheung, Lee, &Rabjohn (2008) examined the extent to which people
were willing to accept and adopt online consumer reviews and the factors that encouraged adoption. The research findings reported comprehensiveness and relevance to be the most effective components of online postings.
Park & Lee (2009) reported negative eWOM had a greater effect than positive eWOM. Related to eWOM communication is sentiment analysis or opinion mining, Zhang, Yu, & Meng (2007) stated that opinion mining required the retrieval of relevant documents and then ranking those documents according to expressed opinions about a query topic. Certainly, though, one could be interested in aspects other than a ranked list. Liu, Hu & Cheng (2005) developed an application for analyzing and comparing consumer opinions for a set of competing products.Wijaya & Bressan (2008) leveraged the PageRank algorithm to measure movies based on user reviews. Their results compared favourably with the actual box office rankings. Lee, Jeong, & S. Lee (2008) presented a survey of the various techniques for opinion mining. Focusing on blogs, Conrad, Leidner, & Schilder (2008) developed methods for detecting the authority of those making opinions.
III. PROPOSED SYSTEM
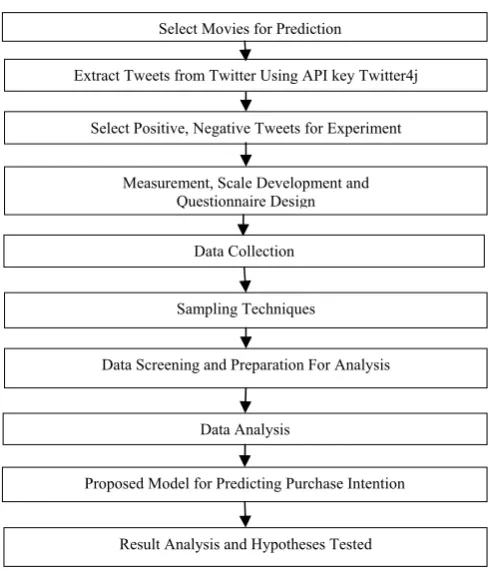
Fig 1: Proposed system architecture eWOM sales prediction
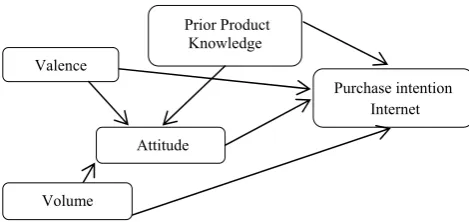
The plan was to hypothesize and test a model for finding respondents intention to purchase a product based on interpretation of the valence and volume of online reviews about the product. This model was planned to be tested for the effects of moderating variables prior product knowledge. The study gathers information only once at a single point of time and will also compare the purchase intentions. The research design chosen for this study was therefore cross-sectional and causal comparative. The flow of proposed method shows in Figure 1.
Extract Tweets from Twitter Using API key Twitter4j
Select Positive, Negative Tweets for Experiment
Measurement, Scale Development and Questionnaire Design
Data Collection
Proposed Model for Predicting Purchase Intention Data Analysis
Data Screening and Preparation For Analysis Sampling Techniques
A. Extract Tweets from Twitter Using API Key Twitter4j
We extract only filtered data from twitter i.e. data that corresponds to a particular movie before release, which will be the system input. Below Figure 2 shows the twitter data extraction method for Bollywood movies.
Request #Search Response
Response
Fig 2: Fetching data from twitter
The extracted tweets we stored in a MySQL database that were used for questionnaire design is shown in figure 1. So after downloading movie database in excel format we selected positive, negative tweets for questionnaire designing.
B. Data Collection Method Employed in This Study
In cases where a survey questionnaire was used, then it was sent along with a cover letter informing the participant about the purpose of the research with an assurance that the responses will be kept confidential. This is as suggested in literature to overcome non-response bias, (Churchill, 1995; Singer, 1978). Data collection for testing the proposed model was done using a self completion questionnaire. Two ways were used for administering the questionnaire, a web form was created, and invitations to participate were sent via emails to respondents who were randomly selected from a mailing list. The emails had a covering letter with a link to the form and a paper based version of the form.
1) Selecting the Sampling Technique and Justification for the choice
Sampling Techniques: Sample selection in a survey based research is important, as the time constraints and the nature of this study is dynamic and the entire population cannot be considered. Sampling techniques can be categorized into two heads Probability and Non-Probability Sampling.
Non-probability sampling involves selecting samples such that the possibility of being selected is known. Non-probability sampling includes convenience sampling, judgment sampling, quota sampling, snowball sampling.
Although random sampling would have been the best method to get, a representative sample of the population in this study, random sampling could not be employed for the following reasons.
1. The population size was not known.
2. The objective was to understand the decision factors that led to purchase intention of a product based on online reviews read by the consumer. This required respondents to be from a highly specific demographic profile. The respondents for this study had to be computer literate, having internet access.
Due to these reasons, convenience sampling had to be used in this phase of the study.
Sample Size: (Sekaran, 2006), discusses a pragmatic approach for selection of sample size proposed by, (Roscoe, 1969)
1) Sample sizes larger than 30 and less than 500 are appropriate for most research.
2) Where samples are to be broken down into subsamples based on gender, socioeconomic status, age then a minimum sample size of 30 for each category is necessary. In this study 67 samples were selected for the four groups leading to a total sample size of 268.
C. Measurement, Scale development & Questionnaire design
1) Measurement
Measurement is the process of describing some property of a phenomenon of interest, usually by assigning numbers in a reliable and valid way, (Zikmund & Babin, 2009). Measurement refers to careful, deliberate observations of the real world and is the essence of empirical research, (Bhattacherjee, 2012). In the previous section, various theories were discussed and a model was proposed. The variables in the model were also conceptualized. In order to create measures, there is a need for operationalization of the constructs.
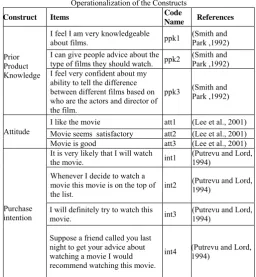
Operationalization: Most of the theoretical constructs defined in the proposed model were multidimensional and use multiple questions for measurement of the same construct, thereby increasing the reliability of the measurement. These multidimensional constructs are also called Latent Variables. The purpose of operationalization was to develop items for measuring these constructs, which have more than one underlying dimension. The constructs used in this study was operationalized using the items shown in the Table I.
TABLE I
Operationalization of the Constructs
Construct Items Code
Name References
Prior Product Knowledge
I feel I am very knowledgeable
about films. ppk1
(Smith and Park ,1992) I can give people advice about the
type of films they should watch. ppk2
(Smith and Park ,1992) I feel very confident about my
ability to tell the difference between different films based on who are the actors and director of the film.
ppk3 (Smith and Park ,1992)
Attitude
I like the movie att1 (Lee et al., 2001)
Movie seems satisfactory att2 (Lee et al., 2001)
Movie is good att3 (Lee et al., 2001)
Purchase intention
It is very likely that I will watch
the movie. int1
(Putrevu and Lord, 1994)
Whenever I decide to watch a movie this movie is on the top of the list.
int2 (Putrevu and Lord, 1994)
I will definitely try to watch this
movie. int3
(Putrevu and Lord, 1994)
Suppose a friend called you last night to get your advice about watching a movie I would recommend watching this movie.
int4 (Putrevu and Lord, 1994) Twitter
Websites
Our Computer System (Tweet Collector) Twitter
API (Twitter4j)
2) Measurement Scale
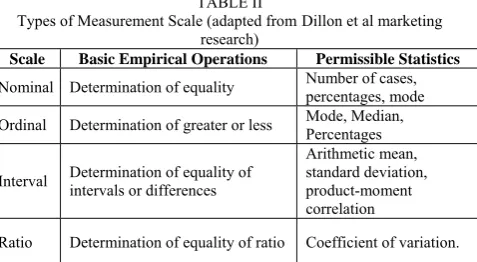
Measurement items that are a collection of items combined into a composite score and intended to reveal levels of theoretical variables not readily observable by direct means are often referred to as scales, (DeVellis, 2011). Table II gives a summary of the types of measurement scales and the operations possible on using these scales.
TABLE II
Types of Measurement Scale (adapted fromDillon et al marketing
research)
Scale Basic Empirical Operations Permissible Statistics Nominal Determination of equality Number of cases, percentages, mode
Ordinal Determination of greater or less Mode, Median, Percentages
Interval Determination of equality of intervals or differences
Arithmetic mean, standard deviation, product-moment correlation
Ratio Determination of equality of ratio Coefficient of variation.
Format for measurement (Composite scale): In this study, the underlying latent constructs prior product knowledge, Attitude and Purchase Intention are measured using a Likert scale. The Likert scale includes many scale items. Each item in the scale measures some aspect of the underlying construct. The respondent is given the operational definition of the construct and views on agreement or disagreement are sought using a five point scale ranging from strongly disagree to strongly agree. The total score for a construct was obtained by taking the mean of the numerical score assigned by an individual to each item.
3) Questionnaire design
The first part of the questionnaire had questions relating to the constructs used in the proposed model. The second part of the questionnaire collects demographic information, and the variables were age, gender, education level. As it is a known fact that respondents are reluctant to enter correct age. Age of the respondents was captured using categorical ranges to increase the response, although this procedure is not statistically appropriate leading to lowered variability. The gender of the respondent was captured using a nominal variable. The educational level of the respondent was captured using a categorical variable. A paper version of the questionnaire was created.A covering letter accompanied the questionnaire.
4) Pre-Test and Pilot Test
The instrument was administered to part time study of different people‘s who are selected on a random basis to understand whether the measuring instrument captures all the constructions that were found in previous studies. A factor analysis and reliability test on the samples obtained once the pilot study has confirmed that the instrument was without any problem. A pilot survey is a small-scale survey carried out prior to the final survey which confirms that there are no possible problems, (Browne, 2006). A pilot study has done on individuals who were computer literate, had access to the internet and used social media websites.
5) Questionnaire Administration
Paper based survey forms were designed. There were four treatments valence negative and volume low, valence negative and volume high, valence positive and volume low, valence positive and volume high. Four types of questionnaire forms were made and administered.
D. Data Screening and Preparation for Analysis
Data screening for out of range values, missing data, outliers, and checks for normality was done prior to proceeding with statistical analysis.
1) Missing Data
Missing values occur when to the respondent intentionally does not answer some questions either because of complexity of the item or the length of the questionnaire or in some cases omission error. Missing values may also occur due to data entry errors. These types of missing values are random in nature. The other possibility is that the respondent did not want to respond to the question and the questionnaire did not have appropriate answer choices. The reason for not answering can also be due to social desirability issues, if the questions were sensitive. Such missing values are non-random.
Randomness of missing data: Depending on the pattern
of the missing data, the following categories have been identified, (Rubin, 1976). Missing Completely at Random (MCAR), Missing at Random (MAR) and Not Missing at Random (NMAR).
The Pearson’s correlation between the variables after replacing all the valid data by one and missing values by zero and if found to be statistically significant at the 0.05 level for all variable pairs it indicates that the missing variables are completely at random. However, if the correlation coefficients are significant only for some pairs of variables it indicates that the data is missing at random. Second steps taken to deal with missing data:(Olinsky et al., 2003), suggested that if the percentage of missing data was less than 5% then any simple mechanism for identification and correction was acceptable. (Kline, 1998), recommends three ways to manage missing data deletion; imputation with estimates or to model the missing data as a distribution and estimate them.
In this study percentage of missing data was less than 5% and list wise deletion was carried out.
2) Test for Normality
Most of the analysis requires data to follow a normal distribution. Non-normal data can lead to low standard errors thus giving false significant parameter estimates, (West et al., 1995).Skewness effect test of mean and kurtosis effects variance and covariance. Non-normality was checked by inspecting the Skewness and Kurtosis of the univariate distribution. Skewness greater than three and kurtosis greater than ten are potential problems,(Kline, 2005).
3) Outliers
strongly disagree to strongly agree. Literature reveals different views about outliers. One view is that outliers are valid observations and should be considered in the analysis. Another view is that the presence of outliers will have adverse impact on analysis.
4) Multicollinearity
Multicollinearity was checked by using bivariate correlation between the various items. It was found that the correlation values between variables did not exceed 0.8 recommended by (Hair et al, 2006). If Variance Inflation Factor (VIF) for all the variables is found to be less than 5 it indicates that multicollinearity is absent.
5) Validity and Reliability
Validity: Validity ensures that the concept that is intended to be measured is indeed being measured. Validity ensures that a certain set of questions, which were meant to measure a concept, is correctly measuring it.
Content Validity: Validity is the indicator as to whether the questions actually measure the construct as it is required to be measured. Many of the constructs used in the research were borrowed from previous research after conducting extensive literature review. Therefore, content validity is assumed present. The reason behind using many constructs from previous research was to avoid possible measurement errors as establishing validity was not the primary focus of the research. A pre-test and pilot test was also performed which ensured validity of the constructs.
Face Validity: All the questionnaires used in this study were studied by a panel of experts to ascertain face validity, and comments received from them led to minor changes in the questionnaire, which led to greater clarity of the questions. The list of items, which were self-developed for the study, was submitted to the guide for assessing content validity. All these recommended changes were made to the questionnaire.
Construct Validity: Construct validity is concerned with determining whether the instrument measures what it is actually intended to measure, (Churchill, 1995).The measures of validity refer to developing correct and adequate operational measures for the concept being tested, (Malhotra, 1996). (Campbell & Fiske, 1959) proposed convergent and discriminant validity. In this part of the study construct validity was examined by finding convergent and discriminant validity. Convergent validity was examined to find whether the items of the same construct are correlated and discriminant validity was used for finding whether the items of a construct do not correlate on other constructs. The convergent and discriminant validity was established by performing factor analysis on the data. For adequate convergent validity, it is expected that items belonging to a common construct should exhibit factor loading of 0.60 or higher on a single factor (called same-factor loading), while for discriminant validity, these items should have factor loading of 0.30 or less on all other factors, (cross-factor loading) (Bhattacherjee, 2012).
Standardised factor loading of all the items were greater than the recommended value of 0.5, (Byrne, 2001)
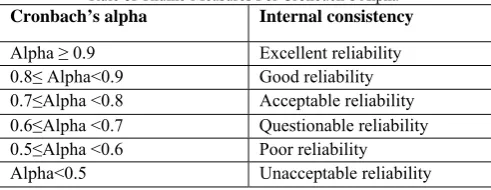
Reliability: Reliability of a measure indicates the extent to which it is without bias and hence ensures consistent measurement across time and across various items in the instrument, (Sekaran, 2006). To ensure reliability, several methods have been suggested; test-retest reliability to ensure stability of the measure over time, parallel form reliability, and internal consistency of measures. In this study, item reliability and scale reliability were examined. Inter-item Consistency Reliability: Reliability as a measure is established to ensure stability and consistency of the measure. One of the most often used measures for scale reliability is Cronbach’s alpha. The values of Cronbach’s alpha were proposed by (George & Mallery, 2003) and shown in Table III is a commonly accepted rule of thumb measure for internal consistency.
TABLE III
Rule of Thumb Measures For Cronbach’s Alpha Cronbach’s alpha Internal consistency
Alpha ≥ 0.9 Excellent reliability
0.8≤ Alpha<0.9 Good reliability
0.7≤Alpha <0.8 Acceptable reliability
0.6≤Alpha <0.7 Questionable reliability
0.5≤Alpha <0.6 Poor reliability
Alpha<0.5 Unacceptable reliability
The nearer the Alpha is to one, the greater is the internal consistency. However, a high value of Cronbach’s alpha of more than 0.9 may indicate redundancy amongst the items in the scale, (Streiner, 2003). Literature demonstrates that there are varied views on the values of Cronbach’s alpha. (Hair et al., 2006), suggest that Cronbach’s alpha greater than 0.6 is should be considered acceptable in exploratory research.
E. Data Analysis
In this study, data was collected using the triangulation method. The analysis of this data would involve univariate analysis, both descriptive and inferential, bivariate analysis method using pearson’s correlation and multivariate method, which includes exploratory factor analysis, linear regression. In the current study, the devised plan was to perform: 1.Descriptive Analysis
2.Model Development
F. Proposed Model for Predicting Purchase Intention
According to File et al. (1994) not only the valence but also
the volume of post-purchase WOM can be affected by management efforts. These authors cited evidence that the measured impacts of complaints management processes, service recovery programmes and unconditional service guarantees on the post-purchase of WOM is clear evidence that management can influence the frequency and direction of WOM.
Fig.3: The Hypothesized model for product sales based on online reviews (Predicting purchase intention)
Table IV
Conceptual Definition of the constructs in the study Research
Variables Code Name
Conceptual Definition Reference
Valence VAL Valence measures the nature of the
WOM message and whether it is positive or negative
(Liu, 2006)
Volume VOL The number of reviews provided to a
consumer. (Duan et al., 2005)
Prior Product knowledge
PPK It measures the degree of familiarity
and expertise a consumer has on a specified product.
(Park and Lessig, 1981)
Attitude ATT It measures a consumer attitude
towards a brand and the category of products it represents.
(Ajzen, 1989)
Purchase Intention
PI It measures the degree to which a
consumer means to buy, or at least try, a specified product in the future.
(Jamieson and Bass, 2001)
1) Valence
From a marketing perspective, WOM can be either positive or negative. Positive WOM occurs when good news testimonials and endorsements about the product, service or brand are uttered. Negative WOM is the mirror image.
2) Volume
The volume of reviews and the effect it has on sales have been tested in several markets. Thus, more reviews have high probability in increasing the perceived usefulness than fewer reviews and as a result to increase in total the usefulness of the contribution (Constant et al. 1996).
3) Prior Product Knowledge
In past studies prior product knowledge used to be examined under the spectrum of familiarity (Park and Lessig, 1981), expertise (Brucks, 1985) and experience (Marks and Olson 1981), considered to influence all the stages of the consumers decision process (Bettman and Park, 1980).
For this study the dimension of the self-assessed knowledge has been chosen for the following reasons. According to Park and Lessig (1981) self-assessed knowledge is an indicator of objective knowledge as well as a self-confidence indicator. Additionally, Meeds (2004) has found that subjective knowledge offers a better insight to the attitudinal evaluations than the other types of knowledge.
4) Attitude
An attitude is an individual's disposition to respond favourably or unfavourably to an object, person, institution, or event, or to any other discriminable aspect of the individual's world, (Ajzen, 1989).
Since this study is using one sided arguments for both positively and negatively valence reviews, the following hypotheses can be made:
H1a: Positive online reviews will have a positive relationship with attitude toward the product.
H1b: Negative online reviews will have a negative relationship with attitude towards the product.
H2: The effect of online reviews on attitude is correlated with the volume of online reviews read by the consumer. H3: Prior product knowledge will have a direct effect on attitude.
5) Purchase Intention
Strong beliefs are held by consumers for various products and brands. These beliefs were generated by various factors like advertisement, previous experience, WOM, prior knowledge etc. As per the above mentioned factors, various hypotheses can be developed as follows:
H4a: positive online review bears a positive impact and relationship with the customer's behaviour towards the product
H4b: negative online review posseses a negative impact on the customer’s attitude for the product
H5: The effect of online reviews on purchase intention is correlated with the volume of online reviews read by the consumer.
H6: Prior product knowledge will have a direct effect on purchase intention.
H7: Prior product Knowledge will have an indirect positive effect on purchase intention through attitude.
H8: Attitude will have a direct positive effect on Purchase Intentions.
IV. EXPERIMENTAL RESULTS
As the primary objective of our survey study was to find factors responsible for purchase intention we used the product as a Hindi movie (Singham Returns) and extracted tweets about the movie from twitter using an API. In this study used a sentiment analysis tool to identify positive and negative tweets and used it as a treatment to four experimental groups. The four experimental groups were then subjected to a series of questions to understand their attitude towards the product and intention to purchase the product. The results of the study are presented here.
A. Demographic Profile of the Respondents
Females and males constitute 28.4% and 71.6% of the sample. India being a male dominated society, there appears to be a male bias even in the current survey.
B. Data Screening and Preparation for Analysis
Data screening for out of range values, missing data, outliers, checks for normality and multicollinearity was done prior to proceeding with statistical analysis.
Valence
Purchase intention Internet
Attitude
Volume
Missing Data: The missing values in the data set were less than 2 percent. A list wise deletion approach was used. Outliers: Multivariate outliers were detected using Mahalanobis D2. There were 19 outliers with the probability
of D2 less than 0.001. None of these outliers had a Cook’s
distance greater than 1. (Stevens, 1984), reported that not all outliers need to be deleted. They found that only outliers with Cook’s distance greater than 1 were influential and worthy of further investigation to examine if they can be deleted. The Mahalanobis D2 and Cook’s distance for all
cases are reported in this study, all the outliers had a Cook’s distance less than 1 and therefore none of the outliers were deleted.
Normality: Skewness effects, test of means and kurtosis effects, variance and covariance. Non-normality was checked by inspecting the Skewness and Kurtosis of the univariate distribution. Skewness greater than three and kurtosis greater than ten are potential problems, (Kline, 2005; West et al., 1995). The skewness and kurtosis values of all the items in the scale were examined and reported in this study.
C. Multicollinearity
The correlation matrix for the independent variables was calculated and is shown in Table V. The correlation between the variables does not exceed 0.8, the cut-off prescribed by (Hair et al., 1998; Cooper & Schindler, 2003; Sekaran, 2006). The data meets the cut-off prescribed in literature for correlation coefficients, tolerance and VIF. Therefore, it was reasonable to assume that the data was not multicollinear.
Table V
Correlation between the Constructs Prior Product
Knowledge
Attitude Intention
Prior Product
Knowledge 1 .151* .287**
Attitude .151* 1 .735**
Intention .287** .735** 1
Each independent variable was regressed against the other independent variables, the tolerance and VIF was calculated. The tolerance values were above 0.4 and VIF values were below 3.The data meets the cut-off prescribed in literature for correlation coefficients, tolerance and VIF. Therefore, it was reasonable to assume that the data was not multicollinear.
C. Construct Validity and Reliability
Construct Validity and reliability was established by performing Factor anlalysis and by finding cronbachs alpha. Factor analysis helps establish discriminant validity and cronbachs alpha was used as a measure of reliability.
1) Exploratory Factor Analysis
An Exploratory Factor Analysis (EFA) was done to determine distinct constructs. EFA revealed three different factors having Eigen values greater than 1 (as per Kaiser’s criterion) which accounted for 54.14% of the total variance. The factor loading of each item was greater than 0.5. The Kaiser-Meyer-Olkin (KMO) measure of sampling adequacy was 0.877, which is well above the recommended 0.6 or higher, (Sharma, 1996), indicating good factorability and Bartlett’s test for sphericity was significant. The principal
axis factoring method, with varimax rotation was used. The three distinct factors obtained after factor analysis.
The following underlying themes were identified as factors. The following underlying themes were identified as factors. Factor 1 Attitude
Factor 2 Purchase Intention Factor 3 Prior Product Knowledge
2) Reliability of the Constructs
The reliability of the constructs was established using Cronbach’s alpha.
Table VI Summary of the Reliability Measures
Construct Cronbach’s alpha No of items
Attitude .881 3
Purchase Intention .838 4
Prior Product
Knowledge .695 3
Cronbach's alpha is one of the most popular methods of measuring internal consistency of the scales. Cronbach’s alpha for the constructs in the study are shown in Table VI. A Cronbach’s alpha greater than 0.7 is considered to be a good indicator of internal reliability in case of exploratory research a Cronbach’s alpha of 0.6 is also acceptable, (Hair et al., 2006).
D.Result
Descriptive statistics of all the 12 items used in the study is as shown in Table VII. Ten items have mean above the middle value of the 5-point Likert scale that was used.
Table VII
Descriptive Statistics of The 12 Items Used In This Study
No. Questions Mean Deviation Std. Variance
1
What is the overall attitude of these reviews toward the movie
3.20 1.304 1.701
2 Please indicate the number of reviews you have read 4.29 1.536 2.361
3 I like the movie 3.16 1.093 1.194
4 Movie seems satisfactory 3.28 1.073 1.151
5 Movie is good 3.24 1.174 1.378
6 It is very likely that I will watch the movie 3.17 1.019 1.039
7
Whenever I decide to watch a movie this movie is on the top of the list
2.58 1.101 1.212
8 I will definitely try to watch this movie 3.08 1.061 1.126
9
Suppose a friend called you last night to get your advice about watching a movie I would recommend watching this movie
2.99 1.114 1.242
10 I feel I am very knowledgeable about films. 3.41 1.001 1.002
11
I can give people advice about the type of films they should watch.
3.50 1.005 1.009
12
I feel very confident about my ability to tell the difference between different films based on who are the actors and director of the film.
Table VIII
Results of Two Ways ANCOVA for Attitude
The ANCOVA results are presented in Table VIII. The covariate Prior product Knowledge, is not significantly related to Attitude, F(1,263) = 3.061, p > .05. The main
effect of valence on Attitude, after controlling for the effect of Prior product knowledge is significant, F (1,263) =
55.801 p < .001. The main effect of volume is not
significant, F (1,263) = 1.155, p >.05 and the interaction of
the valance and the volume is also insignificant F (1,263)
= .352, p > .05.
Valence of reviews is highly significant and partial eta squared is .187 indicating that most of the contribution towards attitude towards the product is from this variable. Valence is a major predictor.
Volume of reviews is statistically not as significant as significance level is above standard cut off .05. Volume of online reviews does not make a difference in attitude towards the product. The statistical interaction between valence and volume is not significant.Hypothesis H1a and H1b are the one which are supported and Hypothesis H2 and H3 were not supported
Hypothesis Testing for Purchase Intention:
Table IX
Results of Two Ways ANCOVA for Purchase Intention
The ANCOVA results are presented in Table IX .The covariate Prior product Knowledge, is significantly related to Purchase Intention, F(1,262) = 18.663, p < .001. The
main effect of valence on Purchase Intention, after controlling for the effect of Prior product knowledge and Attitude is significant, F (1,262) = 4.216 p < .001. The main
effect of Attitude on Purchase Intention is significant, F
(1,262) = 252.947 p < .001. The main effect of volume is
not significant, F (1,262) = 1.426, p >.05 and the interaction
of the volume and the valence is also insignificant F (1,
262) = .012, p > .05.
Hypothesis H4a, H4b , H6 and H8 are supported and Hypothesis H5 and H7 are not supported.
Effect of online reviews on attitude and intention among different experimental groups
The ANOVA results presented in Table X indicates that the effect of online reviews on attitude towards the product among different experimental groups is significant, F(3,264) =20.703, p < .001.
Table X
Results of ANOVA for Attitude Among Groups
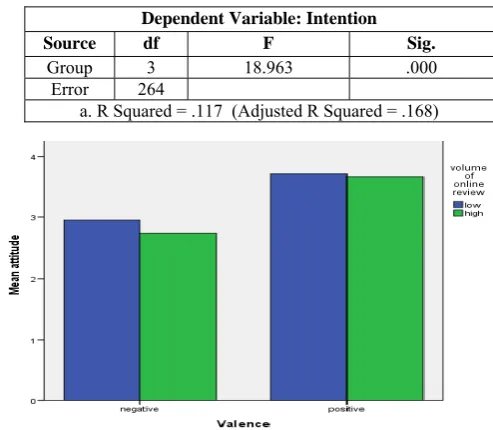
The ANOVA results presented in Table XI indicates that the effect of online reviews on intention to purchase the product among different experimental groups is significant, F(3,264) =18.963, p < .001.
Table XI
Results of ANOVA for Purchase Intention Among Groups
Fig 4: The effect of Valence and Volume on attitude towards the product
In the chart Figure 4 we find that groups subjected to negative valence treatment had a negative impact on attitude as the mean value of response is less than the neutral value 3. Higher the volume of the negative valence reviews lower is the attitude.
Fig 5: The effect of Valence and Volume on purchase intention Dependent Variable: Attitude
Source df F Sig.
Prior product knowledge 1 3.061 .081
Valence 1 55.801 .000
Volume 1 1.155 .284
Valence * Volume 1 .352 .553
Error 263
a. R Squared = .200 (Adjusted R Squared = .188)
Dependent Variable: Purchase Intention
Source df F Sig.
Prior product knowledge 1 18.663 .000
Attitude 1 252.947 .000
Valence 1 4.216 .041
Volume 1 1.426 .234
Valence * Volume 1 .012 .913
Error 262 a. R Squared = .609 (Adjusted R Squared = .602)
Dependent Variable: Attitude
Source df F Sig.
Group 3 20.703 .000
Error 264
a. R Squared = .190 (Adjusted R Squared = .181)
Dependent Variable: Intention
Source df F Sig.
Group 3 18.963 .000
Error 264
In the chart Figure 5 we find that negative valence creates a negative impact on purchase intention of the product. The groups which were treated with negative valence tweets had a intention less than the neutral value 3 indicating that valence of the tweets had a role in purchase intention.
An Automatic Linear Modelling (ALM) technique using attitude as the dependent variable and valence, volume and prior product knowledge as independent gave the results which are presented in Table XII and Table XIII.
Table XII
ALM Generated Table Showing the Significance and Importance of Each Predictor for the Target Attitude
From Table XII it was found that the predictor valence contributes statistically significant amount to the target attitude whereas prior product knowledge is not a statistically significant predictor of attitude. The predictor volume of online reviews does not contribute to predicting attitude towards the product.
Table XIII
ALM Generated Table Indicating The Regression Weights of the Predictors of Attitude.
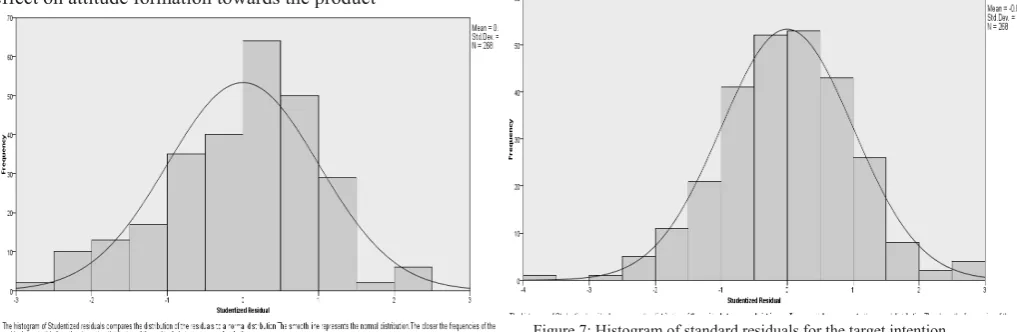
From Table XIII it was found that the importance of negative valence reviews as a predictor of attitude was the highest and negative valence reviews had a significant effect on attitude formation towards the product
Fig 6: Histogram of standard residuals for the target attitude
Figure 6 shows that the residual is normally distributed (although slightly left skewed) which indicate that there is no normality violation.
Table XIV
ALM Generated Table Showing the Significance and Importance of Each Predictor For The Target Intention
From Table XIV it can be concluded that the predictor attitude contributes statistically significant amount to the target intention .The variables prior product knowledge and valence also contribute significantly to predict purchase intention.
Table XV
ALM Generated Table Indicating the Regression Weights of the Predictors of Purchase Intention
From Table XV it can be concluded that the importance of attitude as a predictor of attitude was the highest. Both prior product knowledge and negative valence reviews had a significant effect on attitude formation towards the product. Volume of reviews had no role in predicting purchase intention.
Figure 7: Histogram of standard residuals for the target intention
Table XVI Hypotheses Tested
Hypothesis H1a. Positive online review bears a positive impact and
relationship with the customer's behaviour towards the product.
Supported
H1b. Negative online review posseses a negative impact on the customers attitude for the product
Supported
H2. The effect of online reviews on attitude is correlated
with the volume of online reviews read by the consumer.
Not Supported
H3. Prior product knowledge will have a direct effect on
attitude.
Not Supported H4a. Positive online reviews will have a positive
relationship with purchase intention of the product.
Supported
H4b. Negative online reviews will have a negative relationship with purchase intention towards the product.
Supported
H5. The effect of online reviews on purchase intention is
correlated with the volume of online reviews read by the consumer.
Not Supported
H6. Prior product knowledge will have a direct effect on
purchase intention.
Supported
H7. Prior product Knowledge will have an indirect
positive effect on purchase intention through attitude.
Not Supported
H8. Attitude will have a direct positive effect on
Purchase Intentions. Supported
V. CONCLUSION
The objective of the research was to understand the effect of valence and volume of online reviews using sentiment analysis on attitude and purchase intention of a product. The study used an experimental design which involved 268 subjects. Around 93% of the subjects were below the age of 25 and were active users of social media sites. The product that selected for this study was a movie. These subjects were divided into four groups and administered different treatments. The first group was subjected to 3 negative valence tweets about the product, second group was subjected to 6 negative valence tweets about the product, the third group was subjected to 3 positive valence tweets and the fourth group was subjected to 6 positive valence tweets. All the four groups were then administered a questionnaire with an intention to understand their attitude and intention to watch a movie.
After data preparation and cleaning analysis was performed using ANOVA, ANCOVA and Multiple regression. It was found that valence had a direct effect on both attitude and intention towards the product. The covariate prior product knowledge on attitude was found to be non-significant. Valence of the review, attitude towards the product and prior product knowledge was found to significantly predict purchase intention of the product.
This study contributes to existing literature by investigating the effect of electronic word of mouth by using sentiment analysis to predict attitude towards the product and intention to view the movie. The study also found a significant difference in the relationship between the latent constructs across gender, age, income level, education level. These findings can be of useful to marketers to target specific marketing by customising the marketing campaign, focusing on the factors that were found to be strong influencers leading to usage of internet banking for the each target audience. Marketing
professionals can devise their communication strategy, according to gender, age, income level and education, based on the findings.
VI. SCOPE FOR FUTURE WORK
The research study and literature reviews for this research has identified several gaps and therefore avenues exist to extend this work. Including geo-spatial information in the sentiment analysis may help marketers to gain insights about the reasons for the success or failure of the product and design or alter the product to suit the tastes of the local population.
Besides the scope for extending, the work in this project has ample scope for research in related areas, which were not investigated in this project and elsewhere and therefore provide fertile ground for research.
Extant literature reveals a paucity of studies on the effect of sentiments on product sales. Future studies can be directed towards finding other factors that act as drivers and impediments for prediction of product success and using it to predict the expected sale.
REFERENCES
[1] Sitaram Asur¸,Bernardo A. Huberman, “Predicting the Future With
Social Media ,” in IEEE International Conference on Web Intelligence and Intelligent Agent Technology, vol.01, pp.492-499, 2010.
[2] Ahluwalia, Rohini, Robert E. Burnkrant, and H. Rao
Unnava,“Consumer Response to Negative Publicity: The Moderating Role of Commitment,” Journal of Marketing Research, pp.203-214, 2000.
[3] Ajzen, “Attitude structure and behaviour, Attitude structure and
function,”pp.241-274,1989.
[4] Alba, Joseph W.,Wesley Hutchinson, “Dimensions of Consumer
Expertise ,” Journal of Consumer Research, pp.411-54,1987.
[5] Allen, J. F., Perrault,“Analyzing intention in utterances ,”Artificial
intelligence, pp.143-178,1980.
[6] Amblee, Bui, “The Impact of Electronic-Word-of-Mouth on Digital
Microproducts: An Empirical Investigation of Amazon Shorts,” 15th European Conference on Information Systems, St Gallen, Switzerland,2007.
[7] Alvarez, L. S., Martin, A. M. D. ,Casielles, R. V. ,“Relationship
Marketing and Information and Communication Technologies: Analysis of Retail Travel Agencies ,” Journal of Travel Research ,pp.453,2007.
[8] Archak, N., Ghose, A.,Ipeirotis P.,“Deriving the pricing power of
product features by mining consumer reviews,” Management
Science, pp.1485-1509,2011.
[9] Arndt, J.A.,“Role of product-related conversations in the diffusion of
a new product,” Journal of marketing Research, vol.4,no.3,
pp.291-295,1967.
[10] Awad, N. F. and Zhang, J. (2006),“A Framework for Evaluating
Organizational Involvement in Online Ratings Communities,” 1st Midwest United States Association for Information Systems Conference , Grand Rapids, Michigan,2006.
[11] Bettman, James R., C. Whan Park , “Effects of Prior Knowledge and
Experience and Phase of the Choice Process on Consumer Decision Processes: A Protocol Analysis,” Journal of Consumer Research, pp.141-54,1980.
[12] Bhattacherjee, A., “Social Science Research: principles, methods,
and practices,”2012.
[13] Bickman, L., Rog, D. J.,Hedrick, T. E.“Applied research design: a
practical approach. Handbook of applied social research methods,”
[14] Browne, K., “Introducing sociology for AS level. Polity,” 2006.
[15] Brucks, Merrie , “The Effect of Product Class Knowledge on
Information Search Behavior,” Journal of Consumer Research, pp.1-16,1985.
[16] Buttle, F. A.,“Word of Mouth: Understanding and Managing Referral
Marketing,” Journal of Strategic Marketing,vol.06,no.3,pp.241-54,1998.
[17] Byrne, B. M.,“Structural equation modeling with AMOS: Basic
concepts, applications and programming,”Multivariate application series, Lawrence Erlbaum,2001.
[18] Campbell, D.T and Fiske, D.W., “Convergent and Discriminant
Validation by the Multi-trait, Multi method Matrix,” Psychological Bulletin, pp. 81-105,1959.
[19] Chen, P. Y., Wu, S. Y., Yoon, J. The impact of online
recommendations and consumer feedback on sales. ICIS 2004 Proceedings, vol.58, 2004.
[20] Cheung, C. M., Lee, M. K., Rabjohn, N., “The impact of electronic
word-of-mouth: The adoption of online opinions in online customer communities.” Internet Research, pp.229-247, 2008.
[21] Chevalier, J. A.,Mayzlin, “The effect of word of mouth on sales:
Online bookreviews. Journal of marketing research,”
pp.345-354,2006.
[22] Churchill,“Marketing research methodological foundations,” The
Dryden Press. Orlando, USA, 1995.
[23] Creswell, “Research Design Qualitative, Quantitative, and Mixed
Methods Approaches,” Handbook of mixed methods in social & behavioral research, pp.209-240, 2003.
[24] Clemons,Gao, G. and Hitt,“When Online Reviews Meet Hyper
differentiation:A Study of the Craft Beer Industry,” Journal of Management Information Systems vol.23,pp.149-171,2006.
[25] Conrad, Leidner, Schilder, “Professional credibility: authority on the
web,” In Proceedings of the 2nd ACM workshop on Information credibility on the web,pp.85-88,2008.
[26] Constant, Sproull, L Kiesler,“The Kindness of Strangers: The
Usefulness of Electronic Weak Ties for Technical Advice,” Organization Science, pp.119-135,1996.
[27] Davis,“An Empirical Study of Online Word of Mouth as a Predictor
for Multi‐product Category e‐Commerce Sales. Electronic Markets,
vol.18, pp.130-141, 2008.
[28] DeVellis,“ Scale development: Theory and applications,”Sage
Publications,vol.26, 2011.
[29] Dillon,Madden,Firtle,“Essentials of marketing research,”Homewood,
IL: Irwin,1993.
[30] Duan, W.,Whinston, “The dynamics of online word-of-mouth and
product sales An empirical investigation of the movie industry.Journal of retailing,pp.233-242,2008.
[31] Flynn, Leisa, R. and Goldsmith, “A Short, Reliable Measure of
Subjective Knowledge, Journal of Business Research,” vol.46 , pp.57-66, 1999.
[32] George, Mallery,“Using SPSS for Windows step by step: a simple
guide and reference,”2003.
[33] Godes, D.Mayzlin, “Using Online Conversations to Study
Word-of-mouth Communication,” Marketing Science,” pp.545-60,2004.
[34] Hair, J. F., Anderson, R. E., Tatham, R. L.,Black,“Multivariate
analysis,” Englewood: Prentice Hall International,1998.
[35] Hernandez, Stolfo, “Real-world data is dirty: Data cleansing and the
merge/purge problem. Communication of the ACM, vol.2,pp.23-34,1998.
[36] Herr,Kardes, F.Kim,“Effects of Word-of-Mouth and
Product-Attribute Information on Persuasion: An Accessibility-Diagnosticity
Perspective,” Journal of Consumer Research, vol. 17, pp.454-462,1991.
[37] Kline,“The new psychometrics: Science, psychology and
measurement,”1998.
[38] Little, R. J., & Rubin,”Statistical analysis with missing data,” New
York: Wiley,vol. 539,1987.
[39] Liu, B.,Cheng, J. ,“Opinion observer: analyzing and comparing
opinions on the web. In Proceedings of the 14th international conference on World Wide Web ,pp.342-351,2005.
[40] Meeds , “Cognitive and Attitudinal Effects of Technical Advertising
Copying: the Roles of Gender, Self-assessed and Objective Consumer Knowledge,” International Journal of Advertising,pp.309-335,2004.
[41] Olinsky, A., Chen, S., Harlow, L. ,“The comparative efficacy of
imputation methods for missing data in structural equation modelling,”European Journal of Operational Research, pp.53-79,2003.
[42] Park, C Lee, “Information direction, website reputation and eWOM
effect:A moderating role of product type.,” Journal of Business Research, pp.61-67,2009
[43] Park,V. Parker Lessig,“Familiarity and Its Impact on Consumer
Decision Biases and Heuristics,” Journal of Consumer Research, vol.8, pp.223-30,1981.
[44] Petty, R.E. Cacioppo, Schumann, D., “Central and peripheral routes
to advertising effectiveness: the moderating role of involvement,” Journal of Consumer Research, pp.135-146, 1983.
[45] Rao, Akshay and Kent B. Monroe, “The Moderating Effect of Prior
Knowledge on Cue Utilization in Product Evaluations,” Journal of Consumer Research,pp.253-64,1988.
[46] Roscoe, “Fundamental research statistics for the behavioral
sciences,” New York: Holt, Rinehart and Winston, pp.239, 1969.
[47] Saunders, Thornhill,“Research methods for business students,” 2000.
[48] Sekaran, “Research methods for business,”John Wiley & Sons, 2006.
[49] Simančík ,“A CCG-based system for valence shifting for sentiment
analysis,” Research in Computing Science, vol.41,pp.99-108,2009.
[50] Singer, E. , “Informed consent: Consequences for response rate and
response quality in social surveys”, American Sociological Review, 144-162,1978.
[51] West, S. G., Finch, Curran,“Structural equation models with
nonnormal variables: Problems and remedies,1995.
[52] Wijaya,Bressan,“A random walk on the red carpet: rating movies
with user reviews and pagerank,” In Proceedings of the 17th ACM conference on Information and knowledge management ,pp.951-960,2008.
[53] Zhang, X., Dellarocas, C. and Awad N.F. “Estimating
Word-of-Mouth for Movies: The Impact of Online Movie Reviews on Box Office Performance,” Paper presented at the 2004 Workshop on Information Systems and Economics (WISE 2004), College Park, MD, 2004.
[54] Zikmund,Babin, “Essentials of Marketing Research (Book Only),”
South-Western Pubublication,2009.
[55] Twitter,“Twitter is an online social networking service websites,”
https://twitter.com.
[56] Twitter development, “Twitter Application Management: Create and