_____________________________________________________________________________________________________ *Corresponding author: E-mail: [email protected];
www.sciencedomain.org
Long Term Clinical Course of Hemodynamic Stable
Pulmonary Embolism
Babak Tamizifar
1*, Arash Beiki
1and Elham Raoofi
11
Department of Internal Medicine, Alzahra Hospital, Isfahan University of Medical Sciences, Isfahan, Iran.
Authors’ contributions
This work was carried out in collaboration between all authors. Author BT designed the study. Author AB wrote the protocol and wrote the first draft of the manuscript. Authors AB and ER managed the literature searches. Authors BT and AB took care of the analyses of the materials. Author AB did the clinical follow-up while authors BT and ER supervised the study. All authors read and approved the final manuscript.
Article Information
DOI: 10.9734/BJMMR/2016/28236 Editor(s): (1) Crispim Cerutti Junior, Department of Social Medicine, Federal University of Espirito Santo, Brazil. Reviewers: (1) Saptarshi Biswas, Allegheny Health Network,Pennsylvania, USA. (2)André Eduardo Gomes, UNICAMP, Campinas State University, São Paulo, Brazil. Complete Peer review History:http://www.sciencedomain.org/review-history/16657
Received 10th July 2016 Accepted 9th October 2016 Published 25th October 2016
ABSTRACT
This study aimed to review the mortality rate of pulmonary embolism (PTE) during one year follow up, incidence of hemorrhagic complications and other causes of death.
This prospective cohort study was conducted on 245 patients with confirmed diagnosis of pulmonary embolism divided in two groups of survived and died in a tertiary center hospital in Isfahan from Jan 2011 to March 2015.
In addition to the use of the patients’ records for evaluating some clinical variables, parameters and radiologic findings, interviews with patients were recorded in a check list. Patients were followed for at least one year after the occurrence of pulmonary embolism if death did not occur. Data were analyzed using SPSS software version 13.
After at least one year follow-up, 145 cases (59.2%) were alive and 100 (40.8%) had died. Age older than 67 years, congestive heart failure، ,malignancy, ،trauma, anemia and the evidence of involvement of the pulmonary artery branches in CT angiography were independently associated to mortality (P<0.05). Also, the most common cause of death was cancer in 35% of the patients, while only in 3% it was PTE.
Keywords: Pulmonary embolism; mortality rate; causes.
1. INTRODUCTION
Pulmonary embolism refers to the occlusion of the pulmonary artery or one of its’ branches due to thrombosis, air, fat or tumor which is originated from somewhere in the body [1]. Pulmonary embolism is a potentially fatal condition and figures as an important form of cardiovascular disease, together with acute myocardial infarction and cerebrovascular disease. Despite improvements in treatment of venous thromboembolism (VTE), especially pulmonary embolism (PTE), it is an important cause of mortality and morbidity in the western world [2].
In hemodynamically stable patients, the mortality rate is from 2 to 6% and it can be up to 30% in cases with hemodynamic instability or shock [3]. Unfortunately, 25% of patients die within the first year after diagnosis, but most of these deaths are more associated with underlying conditions such as cancer and chronic heart diseases than with pulmonary embolism [3,4].
As the patient survives from an episode of pulmonary embolism, several thrombotic and non-thrombotic conditions can interfere with his/her evolution. Bleeding and episodes of recurrent pulmonary embolism are common and chronic obstruction of pulmonary artery may lead to a chronic thromboembolic disease [4]. Long-term treatment with vitamin k antagonists is very effective in preventing pulmonary embolism but also increases the risk of major bleeding. Despite the risk of bleeding, the guidelines recommend
that, due to the high risk of recurrence, a long period of anticoagulant therapy should be
done in patients with idiopathic venous thromboembolism (VTE) [5]. In fact, even if we protect patients with VTE against a second episode of VTE during anticoagulant therapy, it is likely to have 3-6% of recurrence in the first 3-6 months [1,5].
In this study, we have reviewed the mortality rate of pulmonary embolism at one year follow up, the incidence of hemorrhagic complications and some other causes of death.
2. MATERIALS AND METHODS
2.1 Implementation Methods
This prospective cohort study was conducted in Al-Zahra hospital, which is the only tertiary
referral center of health care services in Isfahan, from January 2011 to March 2015. PTE diagnosis was performed by a hospital physician based on clinical criteria and on the basis of risk factors, clinical signs and symptoms and angiographic imaging techniques such as computed tomography (CT-Angiography) or ventilation-perfusion scans.
2.2 Collecting Data and Variables
In this study, clinical variables, parameters and radiologic findings were obtained using records of hospitalized patients. The data obtained from the records were complemented by interviews with patients either as face to face or by phone. Data were collected and registered in a check list. Clinical data including age, sex, hypertension, diabetes, smoking (currently), history of ischemic heart disease, history of stroke and risk factors for embolism were recorded for provoked or unprovoked episodes, acute bleeding during treatment and cause of death. Vital signs were recorded at each visit. Patients with unstable hemodynamic conditions or shock (systolic blood pressure less than 90 mm Hg) and patients who had died within the first 24 hours were excluded from the study.
Provoked pulmonary embolism is defined as those episodes associated with risk factors, like active or treated cancer, immobility (due to neurological complications, lower extremity fractures, major surgery or hospitalization in ICU) pregnancy after the first week or oral contraception with estrogen during the past three months.
2.3 Treatment Course
Patients were treated with low molecular weight heparin and warfarin or by inferior vena cava (IVC) filters.
2.4 Follow Up
The main outcomes of interest were in-hospital mortality, aggravation of the patient's condition during hospitalization and length of hospitalization. Patients were followed after discharge in the outpatient clinic and they were informed that in case of severe symptoms, such as dyspnea they should proceed to the emergency room. In case of absence to the clinic appointment, patients were contacted by phone. Patients were followed for at least one year after the occurrence of pulmonary embolism or until death.
2.5 Statistical Analysis
Results were expressed as means ± standard deviations for normal distributions. Variables were compared according to the main outcome, i.e., death or survival. Comparisons were also made regarding the categories of unprovoked or provoked pulmonary embolism. Categorical and continuous variables were compared by Chi-Square and ”Student” t test, respectively. Kaplan-Meier statistic was used to measure the mortality and the recurrence rates of patients of both groups. Contributing factors to the patients’ prognosis were identified using univariate and multivariate Cox-proportional hazard models. In univariate analysis, variables with p- value <0.1 were entered in the model of multivariate analysis. The p-value of <0.05 was considered significant. Analyses of all cases were conducted using SPSS software version 13(SPSS, Inc, Chicago, IL, USA).
3. RESULTS
From January 2013 to March 2015, 245 patients with confirmed diagnosis of pulmonary embolism and stable hemodynamic status referred to Al-Zahra hospital as a tertiary referral center were included to follow-up.
The mean age of the patients was 57.73 ± 18.21 years. One-hundred and thirty-nine cases (56.7%) were males and 106 (43.3%) were females. After at least one year follow-up, 145 cases (59.2%) were alive and 100 (40.8%) individuals had died.
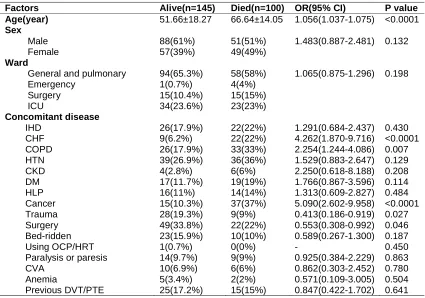
Demographic characteristics of the alive and the dead showed that the mean age of the dead patients was significantly higher than the one for alive patients (OR (95% CI): 1.056(1.037-1.075), p-value<0.0001). When plotted in a ROC curve, an age higher than 67 had 60.82% sensitivity
and 79.02% specificity for the prediction of an episode of pulmonary embolism. It has been shown that also the history of diseases such as chronic heart failure (CHF), chronic obstructive pulmonary disease (COPD), cancer and trauma were significantly associated to mortality (p-value<0.05).
Characteristics of the ward, patients’ house location and gender had no significant role in death (P value>0.05). On the other hand, neither unprovoked nor provoked pulmonary embolism was statistically associated to the death (Table 1). After at least one year follow-up, 145 (59.2%) patients were alive and 100 (40.8%) had died. The prevalence of recognized risk factors for PTE were: recent surgery - 35.2%, obesity - 30%, immobility - 13.5%, previous history of deep venous thrombosis (DVT) / PTE - 20.3% and active malignancy - 21%. Among the comorbidities, hypertension was observed in 30%, chronic lung disease in 24%, ischemic heart disease in 19.6%, diabetes in 14.7%, heart failure in 12.7% and neurologic disorders in 6.5%.
The most common symptoms at referring time were shortness of breath in 73%, chest pain in 56%, cough in 43% and palpitations in 27%. The most common clinical signs found at the clinical examination were tachycardia in 75% and tachypnea in 49%.
The location of pulmonary embolism identified by CT was central pulmonary artery in 26% of the cases, segmental arteries in 57%, sub-segmental arteries in 6% and multiple in 11% of the cases. Echocardiographic findings were available in 94% of the patients, revealing right ventricular (RV) dysfunction (9%), increased tricuspid regurgitation (21%) and RV dilatation and RV hyperkinesia (14%).
Table 2 presents the comparison between demographic characteristics and risk factors related to the patient survival outcome.
congestive heart failure (Beta: 1.79, p = 0.048), malignancy (Beta: 2.74, p= 0.003),،trauma, (Beta: 2.52, p= 0.018) and a CT angiography revealing embolism of both lungs (Beta: 1.71, p= 0.035) (comparing the embolism in both lungs and in the left or the right side alone). These variables were independently able to predict mortality (Table 3) The values described in Table 4 were used to calculate the score of each patient. Among the low risk patients, mortality risk was 32%, but, as showed in Table 3, it was 36.8% and 69% in the patients at moderate and high risk, respectively. (Fig. 1).
On the other hand chronic lung disease (p = 0.061.), chronic kidney disease (p = 0.84.), chronic liver disease (p = 0.08.) or neurological diseases were not effective in the patients’ mortality prediction.
3.1 Mortality
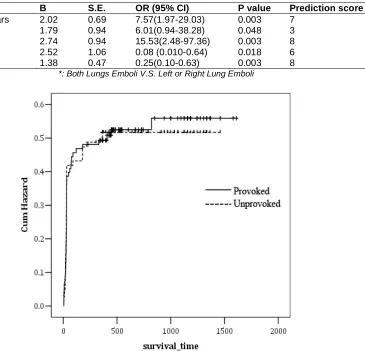
During follow-up, surviving patients were followed by a median of 730 days (interquartile range – IR: 455-1155), while patients who died were followed by a median of 28 days (IR: 20-30). A significant difference was found between the two groups in the mean duration of life (p value<0.001). The analysis of Kaplan-Meier survival between the two groups showed that 54% of dead patients and 53.1% of alive patients had provoked embolism and that patients with predisposing factors had lower life expectancy [HR: 1.01(0.68 - 1.49)]. As a consequence, the Hazard Ratio in patients with predisposing factors was slightly higher than the one in the patients without these factors, despite having not achieved significant difference when tested by the Log-rank test (p-value=0.965) (Fig. 2).
Table 1. Demographic and clinical characteristics
Variable n Percentage Variable n Percentage
Age> 65 years 98 40% CTANGIO results
Male gender 139 56.7% 1) Diagnosis PE
Previous disease - Both Lung Emboli 128 52.2%
IHD 48 19.6% - LT Lung Emboli 44 18%
CHF 31 12.7% - RL Lung Emboli 66 26.9%
COPD 56 24.1% 2) Site of emboli
HTN 75 30.6% - Main pulmonary artery 65 26.5%
CKD 10 4.1% - Segmental branch 127 51.8%
DM 36 14.7% - Sub segmental 17 6.9% HLP 30 12.2% - Combined sites 27 11% Trauma 37 15.1% Provoked 138 56.3%
Surgery 71 29% Clinical course
Bed rest 33 13.5% Fatal PTE 3 1.2%
OCP/HRT 1 0.4% Non-Fatal PTE 6 2.4%
Paralysis 23 9.4% Non-Fatal DVT 2 0.8%
CVA 16 6.5% Bleed severe
Anemia 7 2.9% Fatal bleeding 3 1.2%
Previous DVT/PTE 40 16.3% Major bleeding 15 6.1%
Clinical relevant bleeding 13 5.3%
Cause of death(n=100)
Cancer 35 35% Sepsis 19 19% Heart or respiratory failure 28 28% Arterial cardiovascular
complication
8 8%
PTE 3 3%
Bleeding 7 7%
Definition of abbreviations: Previous disease: IHD= ischemic heart disease, CHF= Congestive Heart Failure, COPD= Chronic Obstructive Pulmonary Disease, HTN= Hypertension, CKD= Chronic Kidney Disease, DM= Diabetes Mellitus, HLP= hyperlipidemia, OCP= Oral Contraceptive Pills, HRT= Hormone Replacement Therapy,
CVA= Cerebrovascular Accident; Thrombus type: PTE= Pulmonary Thromboembolism, DVT= Deep Vein Thrombosis, VTE= Venous Thromboembolism; Provoked: Including at least OCP/HRT or CVA or Cancer or
Table 2. Comparison between some demographic characteristics and risk factors based on the patients’ survival
Factors Alive(n=145) Died(n=100) OR(95% CI) P value
Age(year) 51.66±18.27 66.64±14.05 1.056(1.037-1.075) <0.0001
Sex
Male 88(61%) 51(51%) 1.483(0.887-2.481) 0.132 Female 57(39%) 49(49%)
Ward
General and pulmonary 94(65.3%) 58(58%) 1.065(0.875-1.296) 0.198 Emergency 1(0.7%) 4(4%)
Surgery 15(10.4%) 15(15%) ICU 34(23.6%) 23(23%)
Concomitant disease
IHD 26(17.9%) 22(22%) 1.291(0.684-2.437) 0.430 CHF 9(6.2%) 22(22%) 4.262(1.870-9.716) <0.0001 COPD 26(17.9%) 33(33%) 2.254(1.244-4.086) 0.007 HTN 39(26.9%) 36(36%) 1.529(0.883-2.647) 0.129 CKD 4(2.8%) 6(6%) 2.250(0.618-8.188) 0.208 DM 17(11.7%) 19(19%) 1.766(0.867-3.596) 0.114 HLP 16(11%) 14(14%) 1.313(0.609-2.827) 0.484 Cancer 15(10.3%) 37(37%) 5.090(2.602-9.958) <0.0001 Trauma 28(19.3%) 9(9%) 0.413(0.186-0.919) 0.027 Surgery 49(33.8%) 22(22%) 0.553(0.308-0.992) 0.046 Bed-ridden 23(15.9%) 10(10%) 0.589(0.267-1.300) 0.187 Using OCP/HRT 1(0.7%) 0(0%) - 0.450 Paralysis or paresis 14(9.7%) 9(9%) 0.925(0.384-2.229) 0.863 CVA 10(6.9%) 6(6%) 0.862(0.303-2.452) 0.780 Anemia 5(3.4%) 2(2%) 0.571(0.109-3.005) 0.504 Previous DVT/PTE 25(17.2%) 15(15%) 0.847(0.422-1.702) 0.641
Table 3. Multivariate logistic regression analysis
Variables B S.E. OR (95% CI) P value Prediction score
Age> 67 years 2.02 0.69 7.57(1.97-29.03) 0.003 7 CHF 1.79 0.94 6.01(0.94-38.28) 0.048 3 Cancer 2.74 0.94 15.53(2.48-97.36) 0.003 8 Trauma 2.52 1.06 0.08 (0.010-0.64) 0.018 6 CTANGIO* 1.38 0.47 0.25(0.10-0.63) 0.003 8
*: Both Lungs Emboli V.S. Left or Right Lung Emboli
Fig. 2. Chart cumulative Hazard ratio according to the etiology of pulmonary embolism in patients
Table 4. Death risk prediction model
Death risk stratification
Points Mortality
Low risk 0 to 6 32.1% Moderate risk 7 to 13 36.8% High risk 14 or higher 69% The presence of hemorrhage among the survived patients was reported only in 18 cases (12.4%). The sites of bleeding were the gastrointestinal tract in 44.4% and epistaxis in 22.2%. Among the deceased patients, it was reported only in 13 cases (13%), being gastrointestinal in 61.5% and muscular in 15.4% (p-value>0.05).
The most common causes of death were cancer (35%), followed by cardiac or pulmonary failure (28%) and sepsis (10%). Only 3% of all deaths
were related to recurrent pulmonary embolism (Table 1).
4. DISCUSSION
percentage of deaths in our study were due to causes such as cancer (35%) (whether as an identified cause of the embolism or as a diagnosis after the pulmonary embolism). In this study, we could not determine the different types of cancer, but, in a study conducted by UHM-JS et al. [9], the most common types of cancer related to embolic episodes were: lung cancer (33%), cancers of liver and bile ducts system (14%), colorectal cancer (8%) and hematological cancer (8%). In the same study, the rate of mortality by cancer in patients with pulmonary embolism was about 20% (95% CI, 7.5-37) (3).
Although a clear relation has not been mentioned in different studies so far between arterial cardiovascular diseases and venous thromboembolism, an association of these two diseases is suggested in several epidemiological studies [10]. In a study by KLOK (3), the rate of death from cardiovascular causes of the arterial system was about 14% (95% CI, 7.0-24). As mentioned above, the mortality by the same cause in this study was much higher (about 28%). Consequently, it would be desirable more detailed studies on the relationship between the pathogenesis of thrombosis in the arterial and in the venous system to have better information about their resulting mortality.
In the present study, like in other studies [11,12, 13], the mortality rate of pulmonary embolism was higher in provoked than in unprovoked episodes (3). In all patients with pulmonary embolism, the risk of death was higher than the
mortality rate of the general population, i.e, adjusted hazard ratio (aHR) = 2.9 (95% CI:
2.1-3.8) for provoked and HR = 1.4 (95% CI: 1.1-1.8) for unprovoked. However, in some epidemiological studies of patients with pulmonary embolism, the death due to cardiovascular diseases of the arterial system in provoked PTE was similar to that in unprovoked PTE [9,14,5]. The reason for such a discrepancy is the higher death rate of cancer in provoked PTE, even those cancer cases diagnosed after the diagnosis of PTE itself (3,16).
The one-year mortality rate was about 47%, while it was about 50% for a 4-year period in other studies [1,16].
5. CONCLUSION
Due to the high mortality rate at the one year follow-up among the hemodynamically stable PTE patients, multifunctional measures are
necessary in collaboration with other medical teams during hospitalization and after the treatment to reduce the factors affecting death.
CONSENT AND ETHICAL APPROVAL
This study protocol and all research tools including the patients informed consent was confirmed by ethical committee of our Isfahan University of Medical sciences.
ACKNOWLEDGEMENT
This research is supported by grant No. 393776 from Research Deputy of Isfahan university of medical sciences.
COMPETING INTERESTS
Authors have declared that no competing interests exist.
REFERENCES
1. Den Exter PL, Van der Hulle T, Lankeit M, Huisman MV, Klok FA. Long-term clinical course of acute pulmonary embolism. Blood Rev. 2013;27(4):185-92.
DOI: 10.1016/j.blre.2013.06.003 Epub 2013 Jun 20.
2. Biere-Rafi S, et al. Statin treatment and the risk of recurrent pulmonary embolism. Eur Heart J. 2013;34(24):1800-6.
DOI: 10.1093/eurheartj/eht046 Epub 2013 Feb 8.
3. Sanchez O, Trinquart L, Caille V, Couturaud F, Pacouret G. Prognostic factors for pulmonary embolism: The prep study, a prospective multicenter cohort study. Am J Respir Crit Care Med. 2010; 181(2):168-73.
DOI: 10.1164/rccm.200906-0970OC Epub 2009 Nov 12y.
4. Klok FA, Zondag W, van Kralingen KW, van Dijk AP, Tamsma JT, Heyning FH, Vliegen HW, Huisman MV. Patient outcomes after acute pulmonary embolism. A pooled survival analysis of different adverse events. Am J Respir Crit Care Med. 2010;181(5):501-6.
DOI: 10.1164/rccm.200907-1141OC Epub 2009 Dec 3.
5. Huisman MV, Klok FA. Diagnostic management of clinically suspected acute pulmonary embolism. J Thromb Haemost. 2009;Suppl1:312-7.
6. Klok FA, Cohn DM, Middeldorp S, Scharloo M. Quality of life after pulmonary embolism: Validation of the PEmb-QoL Questionnaire. J Thromb Haemost. 2010;8(3):523-32.
DOI:10.1111/j.1538-7836.2009.03726.x Epub 2009 Dec 15.
7. Klok FA, Mos IC, van Kralingen KW, Vahl JE, Huisman MV. Chronic pulmonary embolism and pulmonary hypertension. Semin Respir Crit Care Med. 2012; 33(2):199-204.
DOI: 10.1055/s-0032-1311800 Epub 2012 May 30.
8. Jiménez D, De Miguel-Díez J, Guijarro R, Trujillo-Santos J. Trends in the management and outcomes of acute pulmonary embolism: Analysis from the RIETE registry. J Am Coll Cardiol. 2016; 19;67(2):162-70.
DOI: 10.1016/j.jacc.2015.10.060
9. Uhm JS, Jung HO, Kim CJ, Kim TH. Comparison of clinical and imaging characteristics and outcomes between provoked and unprovoked acute pulmonary embolism in Koreans. J Korean Med Sci. 2012;27(11):1347-53.
DOI:10.3346/jkms.2012.27.11.1347 Epub 2012 Oct 30.
10. Huang W, Goldberg RJ, Anderson FA, Cohen AT, Spencer FA. Occurrence and predictors of recurrence after a first episode of acute venous thromboembolism: Population-based worcester venous thromboembolism study. J Thromb Thrombolysis. 2016;41(3):525-38.
DOI: 10.1007/s11239-015-1301-8
11. Goldhaber SZ, Visani L, De Rosa M. Acute pulmonary embolism: clinical outcomes in
the International Cooperative Pulmonary Embolism Registry (ICOPER). Lancet. 1999;353:1386.
12. Cho YH, Sung K, Kim WS, Jeong DS, Lee YT, Park PW, Kim DK. Management of acute massive pulmonary embolism: Is surgical embolectomy inferior to thrombolysis. Int J Cardiol. 2016;203:579-83.
DOI: 10.1016/j.ijcard.2015.10.223 Epub 2015 Oct 31.
13. Stein PD, Sostman HD, Hull RD, et al. Diagnosis of pulmonary embolism in the coronary care unit. Am. J. Cardiol. 2009; 103(6):881–6.
14. Alotaibi GS, Wu C, Senthilselvan A, McMurtry MS. Secular trends in incidence and mortality of acute venous thromboembolism: The AB-VTE population based study. Am J Med; 2016.
PII: S0002-9343(16)30175-9 DOI: 10.1016/j.amjmed.2016.01.041 15. Prandoni P, Noventa F, Ghirarduzzi A,
Pengo V, Bernardi E, Pesavento R, Iotti M. The risk of recurrent venous thromboembolism after discontinuing anticoagulation in patients with acute proximal deep vein thrombosis or pulmonary embolism. A prospective cohort study in 1,626 patients. Haematologica. 2007;92(2):199-205.
16. Martinez C, Cohen AT, Bamber L, Rietbrock S. Epidemiology of first and recurrent venous thromboembolism: A population-based cohort study in patients without active cancer. Thromb Haemost. 2014;112(2):255-63.
DOI: 10.1160/TH13-09-0793. Epub 2014 Apr 3.
_________________________________________________________________________________
© 2016 Tamizifar et al.; This is an Open Access article distributed under the terms of the Creative Commons Attribution License (http://creativecommons.org/licenses/by/4.0), which permits unrestricted use, distribution, and reproduction in any medium, provided the original work is properly cited.
Peer-review history: