Air Quality Assessment along the Highway Due To
Vehicular Emissions and Validation of Air Quality
Monitored Data with the CALINE4 Model
B. M. Prakash
1, M. Mahadevaswamy
2, S. Mahesh
3, Sharadhini. R. Siddhanti
4Environmental Officer, Karnataka State Pollution Control Board, Chamarajanagara, Karnataka, India1
Professor,Dept. of Environmental Engineering, S. J. College of Engineering, KarnatakaMysuru, India2
Professor,Dept. of Environmental Engineering, S. J. College of Engineering, KarnatakaMysuru, India3
Dept. of Environmental Engineering, S. J. College of Engineering, KarnatakaMysuru, India4
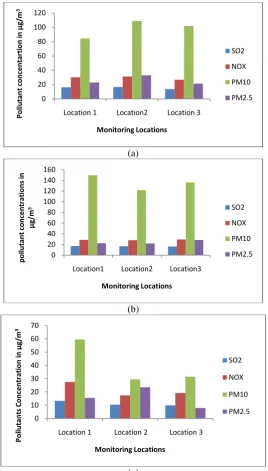
ABSTRACT: Rapid urbanization has lead to increase in the vehicular emissions into the atmosphere and deteriorating the ambient air quality. This paper focuses on the effects of industrial as well as vehicular emissions along the highway passing through the industrial area of Mysore city, India. Results of windrose plots indicate that, wind directions gradually changed from North-East to South-West from December, 2014 to July, 2015. During winter, wind predominantly blows towards the residential layouts in the outskirts of Mysuru City, however, during pre-monsoon and monsoon period wind blows away from the residential layout. During the study period results of ambient air quality monitored data for SO2, NOX and PM2.5 were found to be well below the NAAQ Standards. PM10 concentration was exceeding the NAAQ Standards at Location 2 during winter and pre-monsoon seasons found to be 140 µg/m³ and 165 µg/m³, respectively. During pre-monsoon, winter and monsoon period the vehicular traffic count along the highway found to be 26,526, 24,491 and 24,441, respectively. CALINE4 Model, marginally over-predicts the PM10 concentrations with the monitored data and under-predicts the NOX concentration. Sensitivity analysis of the CALINE4 Model showed, when wind velocity is less than 2 m/sec PM10 concentration was found to be 169 µg/m³ which is greater than the NAAQ Standards.
KEYWORDS:Ambient air quality, Vehicular emissions, CALINE4
I. INTRODUCTION
compiled to evaluate the emissions performance of various classes of vehicles. Raslan Alenezi et al. (2012) have conducted continues ambient air quality monitoring for Non-methane Hydrocarbons, CH4, CO, CO2, SO2, NO2 and PM10 over a period of one year at Al Jahar, Kuwait. The effects of seasonal variations in pollutant concentration levels were analyzed. Results of ambient air quality analysis showed higher concentrations during winter, this may be due to poor dispersion and shallow inversion layer except for CO2, O3 and PM10. Jie Lin et al. (2006) have proposed a cell-based time-dependent approach to capture road traffic and roadside pollution modeling. The results have comparable peak CO estimates from field monitored data when compared with CALINE4 estimates and showed clear impact on roadside pollutant concentrations due to traffic heterogeneity. Rajni Dhyani et al. (2014) have carried out environmental impact assessment for a highway corridor in Delhi city, India and used CALINE 4 model for the prediction of CO concentration. The results predicted by the model are found to be in line with the monitored data.
Baijayanta et al. (2008) have studied the automobile pollution using modified CALINE 4 model with correction factor by considering CO as a principle pollutant at Kolkata, India. They proposed to construct a flyover which later shown the decrease in CO concentration. From the above it is observed that, globally most of the major towns/cities are experiencing the air pollution issues due to heavy vehicular emissions. Hence, in the present study an attempt has been made to monitor the ambient air quality status along the highway passing through the industrial area of Mysuru city and also to validate the ambient air quality monitored data with the CALINE4, an air quality dispersion model.
II. METHODOLOGY
Mysore district is one of the tourist destination, in Karnataka, India, which is a fastest growing metropolitan city with a total vehicle population around 6.5 lakh and the growth of vehicles is approximately 4 % annually. Major industrial areas are located in north-western part of Mysore, within a radius of 7 km from the city centre and the industrial area is well connected by State highway and broad ring roads. In the present study, ambient air quality monitored locations along the highway passing through the industrial area of Mysore City is shown in Figure 1. The field study include: selection of monitoring stations, road geometry, road type and mixing zone width which were collected by direct field observation.
Fig 1 Selected stretch of highway along with monitoring Locations Vehicular traffic studies
Meteorological data
Various atmospheric factors influence the dispersion of air pollutants includes: wind velocity and its direction, temperature, mean mixing depth, atmospheric pressure, rainfall, heating effects and nature of terrain. These data have been collected from Indian Meteorological Department, Naganahalli, Mysore district, India and hourly data was collected from the website www.wunderground.com and used in the present study. The wind data have been used to plot windrose diagrams which represents the magnitude and directions of wind prevailing in the study area.
III.AIR QUALITY MODELING USING CALINE 4
Air pollution models are numerical tools used to describe the casual relationship between emissions, meteorology, atmospheric concentration, deposition and other factors. Air pollutant dispersion models play an important role due to their capability to assess the relative importance of the relevant processes. There are large number of models like ISCST3, General Finite Line Source Model, Delhi Finite Line Source Model, AERMOD, MOBILE, CALINE 3 and CALINE 4 models are available for the estimation of pollutants present at a certain site depending upon the available parameters and weather conditions. CALINE4 model is a fourth-generation line source air quality dispersion model developed by the California Department of Transportation (Caltrans) USA, which offers several advantages over the other previous models such as: General Finite Line Source Model, Delhi Finite Line Source Model, ISCST 3 and CALINE 3 and have been used by many researchers to predict the ambient air quality pollutant concentrations due to vehicular emissions along the roads/ highways under Indian climatic conditions. In the present study, CALINE4 has been use to predict the pollutant concentration..
IV.EXPERIMENTAL RESULTS
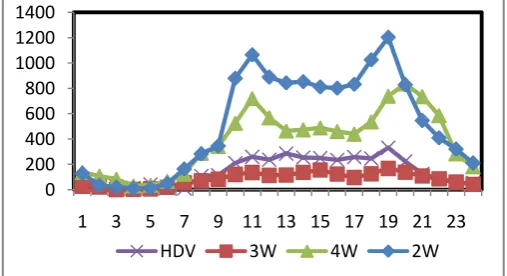
Meteorological parameters plays a vital role on the dispersion of air pollutants which changes from season to season. The plot of hourly traffic variation along the highway corridor is shown in Figure 2. The peak traffic flow were observed during 10:00-12:00 (morning peak hours) and 17:00-20:00 (evening peak hours). The Heavy duty vehicles were found to be maximum during morning hours, which may be due to supply of raw materials to the industries located on one side of the highway. 3 wheelers were distributed maximum during morning hours. The study involves preparation of detailed emission inventory with estimation of emissions from line source in the study area by using Atomotive Reasearch association of India (ARAI) developed emission factors for vehicular emissions in India.
Fig 2 Hourly traffic variation along the study area, Mysore
An emission inventory is a database that lists the sources and the amount of air pollutants discharged into the atmosphere during a given time period. It is useful in determining the significant sources of air pollutants and to establish emission trends over time, target regulatory actions, and estimate air quality through computer dispersion modeling. Emission Inventory depends upon location, elevation, frequency and duration of emission, etc. and it provides the information about the status of air pollution in the urban fringes. In the present study, emission inventory
0 200 400 600 800 1000 1200 1400
1 3 5 7 9 11 13 15 17 19 21 23
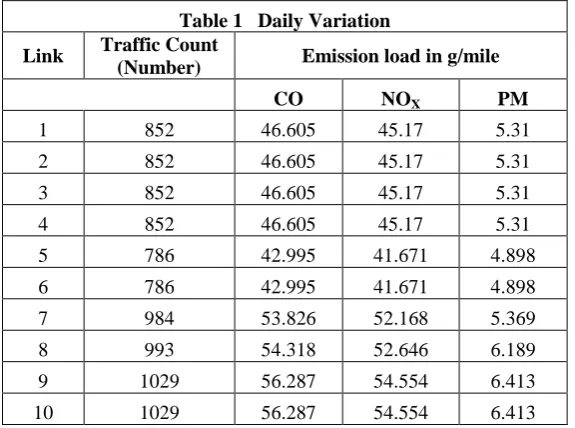
has been prepared for CO, NOX and PM10 based on the emission factors published by ARAI report (2008). The daily and hourly variations in emissions were eastimated at each link identified along the study area and Table 1 shows the average daily traffic volume and corresponding emissions in g/mile. From the Table 1 it is observed that, as the traffic volume increases the emission load also increases and load of particulate matter was found to be least when compared with the CO and NOX load in the study area.
Table 1 Daily Variation
Link Traffic Count
(Number) Emission load in g/mile
CO NOX PM
1 852 46.605 45.17 5.31
2 852 46.605 45.17 5.31
3 852 46.605 45.17 5.31
4 852 46.605 45.17 5.31
5 786 42.995 41.671 4.898
6 786 42.995 41.671 4.898
7 984 53.826 52.168 5.369
8 993 54.318 52.646 6.189
9 1029 56.287 54.554 6.413
10 1029 56.287 54.554 6.413
Field monitoring
(a)
(b)
(c)
Fig 3 Plots for pollutants concentration at different locations in the study area during (a) winter, (b) pre- monsoon and (c) monsoon season.
Model results
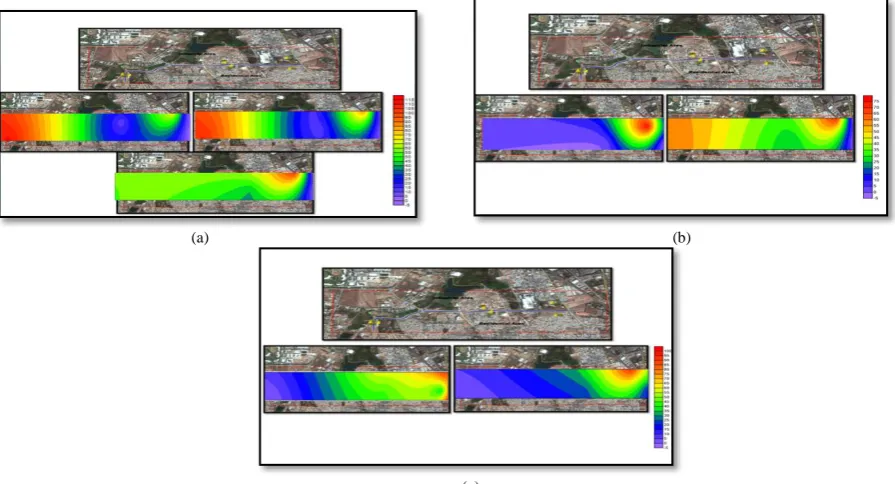
Present study, mainly focused on the applicability of CALINE4 an air dispersion model for seasonal, daily and hourly variations of pollutant concentrations such as, SPM and NOX. Isopleth plots were developed for the study period i.e., from December, 2014 to July, 2015 for PM10 concentration over the selected stretch of highway from both line source (Vehicular emissions) and point source (Industrial emissions), which shows the influence of the wind direction on the dispersion of pollutants and to which direction the pollutants disperse in different seasons of the study
0 20 40 60 80 100 120
Location 1 Location2 Location 3
P ol lut ant conce nt arti on in µg /m 3 Monitoring Locations SO2 NOX PM10 PM2.5 0 20 40 60 80 100 120 140 160
Location1 Location2 Location3
pol lut ant conce nt rat ions in µ g/m 3 Monitoring Locations SO2 NOX PM10 PM2.5 0 10 20 30 40 50 60 70
Location 1 Location 2 Location 3
period in the study area is as shown in Figure 4 (a), (b) and (c) . From Figure 4 (a), it is observed that, pollutant concentration during winter season show higher values, which may due to wind direction that blew towards South-West direction and there by the pollutants from the vehicular and industrial emissions were dispersed towards Location 3 which is being nearer to Sheshadripuram College. During pre- monsoon season, the wind direction was towards Northern part of the study area. Figure 4 (b) shows the dispersion of pollutant concentration from vehicular source towards the industrial sector and higher concentration was found to be near the J.K. Industry, which was due to the point source emission from a rubber tyre industry. During monsoon season, the pollutant concentration was comparatively lower along the identified stretch of highway. Further, it can be observed that, pollutant concentration was mainly due to industrial source and gradually disperse towards Northern part of the study area as the prevailing wind blew from West-South-West direction towards the North-East direction as shown in Figure 4 (c).
(a) (b)
(c)
Fig 4 CALINE4 predicted PM10 concentration along with point source PM10 concentration during (a) winter, (b) pre-
monsoon and (c) monsoon season.
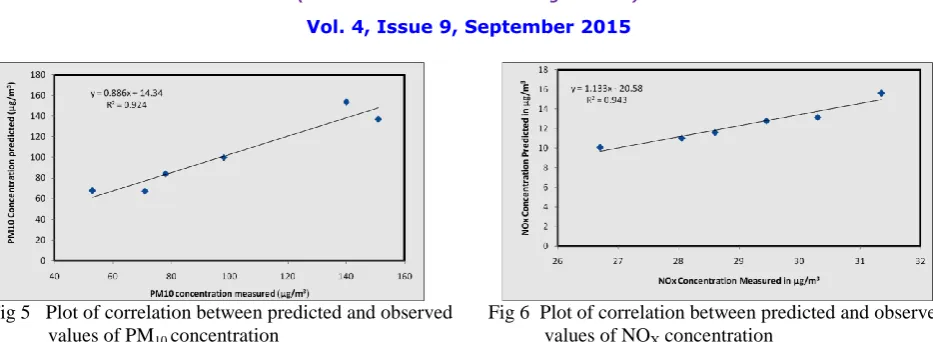
Predicted results for SPM from the CALINE4 model were marginally over-predicted than the actual results. Whereas for NOX, the model predicted results were marginally under-predicted when compared with the actual field data. Plot for PM10 and NOX observed versus predicted concentration has been shown in Figures 5 and 6. It is observed that, predicted concentration from CALINE4 was found to be 151 µg/m³ and the actual field monitored data for the same conditions was found to be 140 µg/m³ which infers that, the model results were satisfactory. The plot for monitored versus predicted concentration of PM10 and NOX gives the R2 values of 0.924 and 0.943, respectively. The equations relating to the predicted with observed values are given in eqns. (1) and (2).
y = 0.886 x + 14.34 (1)
y = 1.133 x – 20.58 (2)
Fig 5 Plot of correlation between predicted and observed Fig 6 Plot of correlation between predicted and observed
values of PM10 concentration values of NOX concentration
Further, CALINE4 model has been run for three seasons, i.e., winter, pre-monsoon and monsoon season, respectively, at ambient temperatures ranging from 9 ˚C to 32 ˚C under different atmospheric stability class from 1 to 7. The monitored wind velocities during the study period was ranging from 1 m/s to 5.28 m/s. From the monitored data, it was observed that, the PM10 concentration when the wind speed was less than 2.5 m/s was found to be exceeding the permissible limits (100 µg/m3) i.e. 141 µg/m3 at Location 2 and pollutant concentration were less (34 µg/m3) when the wind speed was 5.28 m/s during monsoon season at Location 1. From the above discussion, it can be inferred that, the CALINE4 model prediction depends on the meteorological parameters such as: ambient temperature, atmospheric stability class and wind velocity.
V. CONCLUSION
Air quality monitoring was carried out along the selected stretch of Mysore-Bangalore highway at three locations for three different seasons i.e., Winter, Pre-monsoon and Monsoon season. The windrose plots clearly indicates that, the wind direction was gradually changed from North-East to West-South-West direction during the study period (i.e., from December, 2014 to June, 2015). During winter, wind predominantly blew from North-East direction, which indicated that, pollutant dispersion was towards the Mysore city limits (Residential layouts) however, in other two seasons the wind direction was towards Northern direction indicating the pollutants were transporting away from the Residential layout. SO2, NOX and PM2.5 were observed to be within the permissible limits of NAAQ Standards. PM10 concentration was exceeding the permissible limits of NAAQ Standards (100 µg/m³) at Location 2 during winter as well as pre-monsoon i.e., 140 µg/m³ and 165 µg/m³. This may be due to the nature of terrain (gentle valley condition) and low temperature (11˚ C). Maximum PM10 concentration was found to be 165 µg/m³ during pre-monsoon at Location 2 (near V-LEAD), which may be due to receptors located near to the roadway as well as due to the peak traffic flow of 26,526 was observed. However, during winter and monsoon season peak traffic flow of 24,491 and 24,441, respectively, was noticed. The isopleth plots were developed using CALINE4 Model showed, the vehicular emissions contribution have significant impact on ambient air quality. Results of CALINE4 Model for PM10 concentration was found to be marginally over-predicted when compared with the monitored data during the study period (i.e., from December, 2015 to July, 2015). NOX prediction from the CALINE4 Model was found to be under-predicted when compared with the monitored data. This may be due to the presence of atmospheric nitrogen in the ambient air which also contributes to the field monitored NOX concentration. Sensitivity analysis of the CALINE4 model when wind velocity < 2 m/s showed, the PM10 concentration was found to be 169 µg/m³ which is greater than the NAAQ Standards.
REFERENCES
1. Alenezi, R., Al-Anzi, B., Abusam, A. and Ashfaque, A. “Seasonal Influence on the Ambient Air Quality in Al Jahar City for Year 2010”, Journal of Environmental Protection, 3, pp 1711-1718, 2012.
2. Attri, S. D., Singh, S., Mukhopadhyay and Bhatnagar, A. K. “Atlas of hourly mixing height and assimilative capacity of atmosphere in India”,
3. Awasthi, S., Khare, M. and Gargava, P. “General plume dispersion model (GPDM) for point source emission”, Environmental Modeling and Assessment, 11, pp 267-276, 2006.
4. Baranka, G. “Modeling of Air Pollutants of Highway Roads in Hungary”, Highway and Urban Environment, 17, pp 79-86, 2010.
5. Barman, S. C., Kumar, N., Singh, R., Kisku, G. C., Khan, A. H., Kidwai, M. M., Murthy, R. C., Negi, M. P. S., Pandey, P., Verma, A. K., Jain,
G. and Bhargava, S. K. “Assessment of urban air pollution and it’s probable health impact”, Journal of Environmental Biology, 31, pp 913-920, 2010.
6. Cook, R., Isakov, V., Touma, J. S., Benjey, W., Thurman, J., Kinnee, E. and Ensley, D. “Resolving Local-Scale Emissions for Modeling Air
Quality near Roadways”, Journal of the Air & Waste Management Association, 58, pp 451-561, 2008.
7. Dhyani, R., Gulia, S., Sharma, N. and Singh, A. “Air quality impact assessment of a highway corridor through vehicular pollution modeling”,
International Journal of Renewable Energy and Environmental Engineering, 2, pp 2348-0157, 2014.
8. Dreher, D. R. and Harley, R. A. “A Fuel-Based Inventory for Heavy-Duty Diesel Truck Emissions”, Journal of the Air & Waste Management
Association, 48, pp 352-358, 1998.
9. Dubey, B., Pal, A. K. and Singh, G. “Assessment of vehicular pollution in dhanbad city using CALINE 4 model”, Earth and Environmental
Sciences, 3, pp 156-164, 2013.
10. Ghose, K. M., Paul, R. and Banerjee, S. K. “Assessment of the impacts of vehicular emissions on urban air quality and its management in Indian context: the case of Kolkata (Calcutta)”, Environmental Science and Policy, 7, pp 345-351, 2004.
11. Gibson, M. D., Kundu, S. and Satish, M. “Dispersion model evaluation of PM2.5, NOX and SO2 from point and major line sources in Nova
Scotia, Canada using AERMOD Gaussian plume air dispersion model”, Atmospheric Pollution Research, 4, pp 157-167, 2013.
12. Goyal, P., Jaiswal, N., Kumar, A., Dadoo, J. K. and Dwaraknath, M. “Air quality impact assessment of NO2 and PM due to diesel vehicles in
Delhi”, Transportation Research, Part D, 15, pp 298-303, 2010.
13. Goyal, P. and Kumar, A. “Air Quality Prediction of PM10 through an Analytical Dispersion Model for Delhi”, Aerosol and Air Quality Research, 14, pp 1487-1499, 2014.
14. Guihua Wang, G., Bai, S. and Joan., M. J. “ Identifying contributions of on-road motor vehicles to urban air pollution using travel demand
model data”, Transportation Research Part D, 14, pp 168-179, 2009.
15. Gupta, N. C., Qutebha, M. T. and Sambi, S. S. “Prediction of spatial concentration distribution of Carbon monoxide on urban street in Delhi: A
comparative study”, Journal of Environmental Research And Development, 5, pp 566-573, 2011.
16. Konar, T S. and Chakrabarthy, S. “ Applicability of Caline4 model for NOX in Kolkata Roadway”, Civil Environmental Engineering, pp 1-4,
2012.
17. Lin, J. and Ge, Y. E. “Impacts of traffic heterogeneity on roadside air pollution concentration”, Transportation Research Part D, 11, pp
166-170, 2006.
18. Majumdar, B. K., Dutta, A., Chakraabarty, S. and Ray, S. “Correction Factors of CALINE4: A case study of Automobile pollution in Kolkata”,
Indian Journal of air Pollution Control, 8, pp 1-7, 2008.
19. Makra, L., Ionel, I.,Csepe, Z., Matyasovszky, I., Lontis, N. and Popescu, F. “Application of CALINE4 for modeling dispersion of roadside CO
and NO2 emissions in Szeged, Hungary”, Asociatia Generala a Inginerilor din Romania, pp 85-90, 2013.
20. Nagendra, S. M. S., Venugopal, K. and Jones, L. S. “assessment of air quality near traffic intersections in Bangalore city using air quality indices, Transportation Research Part D, 11, pp 167-176., 2007.
21. Samaranayake, S., Glaser, S., Holstius, D., Monteil, J., Tracton, K., Seto, E. and Bayen, A. “Real-Time Estimation of Pollution Emissions and
Dispersion from Highway Traffic”, Computer-Aided Civil and Infrastructure Engineering”, 29, pp 546-558, 2014.
22. Sharma, N., Gulia, S., Dhyani, R. and Singh, A. “Performance evalution of CALINE 4 dispersion model for an urban highway corridor in
Delhi”, Journal of Scientific & Industrial Research, 72, pp 521-530, 2013.
23. Sharma, N., Singh, A., Dhyani, R. and Gaur, S. “Emission reduction from MRTS projects – A case study of Delhi metro”, Atmospheric Pollution Research, 5, pp 721-728, 2014.
24. Shukla, V., Dalal, P. and Chaudhry, D. “Impact of vehicular exhaust on ambient air quality of Rohtak city, India”, Journal of Environmental
Biology, 31, pp 929-932, 2010.
25. Zhang, K. and Batterman, S. “Near-road air pollutant concentrations of CO and PM2.5: A comparison of MOBILE6.2/CALINE4 and