ABSTRACT
CAMPBELL, CAROLINE LLOYD. The Effects of Food Structure and Texture on Oral Processing and Satiation. (Under the direction of Dr. E. Allen Foegeding.)
Food texture plays a key role in regulating human eating patterns. Dynamic sensory perception and individual preferences for specific tastes and textures have been reported to influence the speed and trajectory of food consumption, feelings of satiation and satiety, and overall food intake. The aim of this project was to 1. develop and characterize a model food system representing a spectrum of real food textures, 2. develop a method to track tongue movement in vivo during oral processing, 3. characterize and compare the oral processing patterns of a range of food textures, and 4. determine the impact of food texture upon
satiation, satiety, and ad libitum food intake. An iso-caloric, whey protein-based model food system was developed to spanned a wide spectrum of food textures and characterized via rheological profiling and a trained sensory panel. A tongue tracking methodology was developed, calibrated, and validated by modifying a magnetic jaw tracking system to follow the movement of a magnetic proxy glued to a subject’s tongue. Oral processing behaviors were characterized by recording muscle activity and jaw and tongue movements while 12 subjects consumed four whey protein model foods as well as three protein-fruit purees with or without oat particulates. A human clinical trial (n = 24) was also conducted to evaluate the impact of the texture of a pre-lunch snack upon subsequent reported satiation and satiety and ad libitum intake.
intermediate, and firm solid gels. The tongue tracking method was developed by exchanging a traditional jaw-tracking magnet for a small circular magnet that was glued to the tongue; the method and MATLAB analysis software was calibrated in silico and ex vivo to account for inconsistencies imposed by tongue rotation. The tongue tracking equipment and
developed software demonstrated accuracy within 0.2-4 mm for movements with limited tongue rotation within a practical oral processing space but requires additional modifications to reduce error to acceptable levels. Measurement accuracy decreased with increasing magnitudes of translational and rotational movements.
The Effects of Food Structure and Texture on Oral Processing and Satiation
by
Caroline Lloyd Campbell
A dissertation submitted to the Graduate Faculty of North Carolina State University
in partial fulfillment of the requirements for the degree of
Doctor of Philosophy
Food Science Raleigh, North Carolina
2017
APPROVED BY:
d
Dr. E. Allen Foegeding Dr. Christopher Vinyard
Committee Chair
________________________________
Dr. MaryAnne Drake Dr. Gregory Essick
BIOGRAPHY
Caroline Campbell was born and raised in Moscow, Idaho. Though Idaho is widely renowned for its superior potatoes, Moscow and the surrounding region was, until recently, the pea and lentil capitol of the world. Growing up, Caroline’s life revolved around
competitive swimming and she won a number of state championships. She spent four years as a Vandal-Cougar hybrid, pursuing her B.S. in Food Science in the University of
Idaho/Washington State University Bi-State School of Food Science. Caroline graduated with her B.S. in Food Science in 2011. She then took a year off to study abroad in Chile and to complete two internships at Cargill and Smucker’s exploring the subtleties of modified starches and coffee flavorings.
Though Caroline enjoyed a happy twenty-two years in Idaho, the lure of her
ACKNOWLEDGMENTS
I would like to thank the following people for their invaluable contributions to my Ph.D. research and experience at NC State:
• Dr. Foegeding for your intelligence, creativity, exuberance, and never-faltering support. Our lab group became my surrogate family in Raleigh; the annual lake parties were a pretty great perk too.
• Dr. Drake, Dr. Vinyard, Dr. Essick, and Dr. Gillan for serving on my committee and expanding and challenging my appreciation of multidisciplinary research.
• Paige Luck for her endless patience and daily emotional and psychological support. Our successes wouldn’t be possible without your watchful eye and attention to detail. Also, thank you for letting me repeatedly glue a magnet to your tongue (even though it was your idea…)
• Davisco Foods International, Inc for their generous donation of whey protein isolate. • My many loyal subjects, for both oral processing and satiety research studies. Thank
you for eating whey protein gels and pretending to like it.
• Alton, Janet, and Christopher Campbell for their unwavering support from afar. And for their seemingly genuine interest in the excruciating details of how and why people eat what they eat.
TABLE OF CONTENTS
LIST OF TABLES ... viii
LIST OF FIGURES ... x
CHAPTER 1: DESIGNING FOODS FOR SATIETY: THE ROLES OF FOOD STRUCTURE AND ORAL PROCESSING IN SATIATION AND SATIETY (LITERATURE REVIEW) ... 1
ABSTRACT ... 2
1. INTRODUCTION ... 2
2. BUILDING FOOD STRUCTURE ... 3
3. FOOD STRUCTURE AND ORAL PROCESSING ... 3
3.1 Effects of food structure on eating rate and duration ... 4
3.2 Effects of food structural/textural attributes upon oral processing ... 5
3.3 Effects of structure on dynamic oral processing and sensory perception ... 5
4. SATIATION AND SATIETY ... 5
4.1 Indicators of satiation and satiety ... 6
4.2 Effects of macromolecules on satiation/satiety ... 6
4.3 Approaches to food texture modification for satiety studies ... 7
4.3.1. Adding an ingredient to thicken fluids and semisolids ... 7
4.3.2. Grinding or homogenizing food ... 8
4.3.3. Increasing food volume ... 8
4.4 Effects of food structure upon satiety and satiation ... 8
5. DESIGNING FOODS FOR SATIATION AND SATIETY ... 9
6. FUTURE OUTLOOK ... 10
7. ACKNOWLEDGEMENTS ... 10
8. REFERENCES ... 10
CHAPTER 2: AN ISO-PROTEIN MODEL FOOD SYSTEM FOR EVALUATING FOOD TEXTURE EFFECTS ... 14
1. ABSTRACT ... 15
2. PRACTICAL APPLICATIONS ... 15
3. INTRODUCTION ... 15
4. MATERIALS AND METHODS ... 16
4.1 Sample preparation ... 16
4.2 Turbidity ... 17
4.3 Rheological analysis ... 17
4.3.1. Small strain oscillatory testing ... 17
4.3.2. Creep and recovery ... 17
4.3.3. Large strain uniaxial compression ... 18
4.4 Descriptive sensory analysis ... 18
4.5 Statistical analysis ... 20
5.1 Rheological characterization of model structures ... 20
5.2 Sensory characterization of model structures ... 22
5.3 Correlations among sensory properties ... 23
5.4 Correlations between rheological and sensory properties ... 24
6. DISCUSSION ... 24
7. CONCLUSIONS ... 26
8. ETHICAL STATEMENTS ... 27
9. ACKNOWLEDGEMENTS ... 27
10. REFERENCES ... 27
CHAPTER 3: A COMPARISON OF THE LUBRICATION BEHAVIOR OF WHEY PROTEIN FOODS USING TRIBOLOGY IN LINEAR AND ELLIPTICAL MOVEMENT ... 30
3.1 ABSTRACT ... 31
3.2 INTRODUCTION ... 32
3.3 MATERIALSANDMETHODS ... 34
3.3.1 Sample preparation ... 34
3.3.2 Rheological characterization ... 36
3.3.3 Tribology ... 36
3.3.4 Chew and spit sample collection ... 38
3.4 RESULTSANDDISCUSSION ... 38
3.4.1 Rheological characterization ... 38
3.4.2 Comparison of linear and elliptical tribology ... 39
3.5 CONCLUSIONS ... 45
3.6 ACKNOWLEDGMENTS ... 46
3.7 REFERENCES ... 47
CHAPTER 4: DEVELOPMENT OF A NOVEL METHOD TO QUANTIFY TONGUE MOVEMENT DURING ORAL PROCESSING OF FLUID AND SEMISOLID FOODS ... 50
4.1 ABSTRACT ... 51
4.2 INTRODUCTION ... 53
4.3 MATERIALSANDMETHODS ... 55
4.3.1 Equipment adaptation ... 55
4.3.2 Method calibration and validation ... 57
4.3.3 In vivo oral processing procedures ... 60
4.3.4 Statistical Analysis ... 64
4.4 RESULTS ... 64
4.4.1 Method calibration ... 64
4.4.2 Method validation ... 65
4.4.3 In vivo testing ... 71
4.5 DISCUSSION ... 75
4.7 REFERENCES ... 79
CHAPTER 5: ORAL PROCESSING PATTERNS OF SEMISOLID FRUIT PUREES WITH ADDED FAT OR OAT PARTICULATES ... 82
5.1 ABSTRACT ... 83
5.2 INTRODUCTION ... 84
5.3 MATERIALANDMETHODS ... 86
5.3.1 Materials ... 86
5.3.2 Temporal check all that apply (TCATA) sensory evaluation ... 86
5.3.3 Oral Processing ... 87
5.3.4 Data Collection ... 89
5.3.5 Data Analysis ... 90
5.3.6 Statistical Analysis ... 91
5.4 RESULTS ... 92
5.4.1 TCATA sensory evaluation of protein-fruit purees ... 92
5.4.2 Differences in oral processing patterns among protein-fruit purees ... 92
5.4.3 Oral processing variability among subjects ... 97
5.4.4 Subject segmentation by eating behavior ... 98
5.5 DISCUSSION ... 101
5.6 CONCLUSIONS ... 103
5.7 ACKNOWLEDGEMENTS ... 104
5.8 REFERENCES ... 105
CHAPTER 6: PHYSIOLOGICAL EATING PATTERNS OF FLUID, SEMISOLID, AND SOLID FOODS ... 107
6.1 ABSTRACT ... 108
6.2 INTRODUCTION ... 109
6.3 MATERIALSANDMETHODS ... 112
6.3.1 Test Foods ... 112
6.3.2 Oral Processing ... 113
6.3.3 Data Collection ... 115
6.3.4 Data Analysis ... 116
6.3.5 Statistical Analysis ... 117
6.4 RESULTS ... 117
6.4.1 Differences in muscle activity and jaw and tongue movements among test food textures ... 117
6.4.2 Relative differences in oral processing patterns across test food textures ... 121
6.4.3 Variability among individual subject eating patterns ... 122
6.5 DISCUSSION ... 126
6.6 CONCLUSIONS ... 129
CHAPTER 7: TEXTURAL VARIATION OF A PRE-MEAL PROTEIN SNACK DOES NOT SIGNIFICANTLY IMPACT APPETITE RATINGS OR AD LIBITUM
INTAKE ... 134
7.1 ABSTRACT ... 135
7.2 INTRODUCTION ... 136
7.3 MATERIALSANDMETHODS ... 138
7.3.1 Participants ... 138
7.3.2 Experimental Design ... 140
7.3.3 Test foods ... 142
7.3.4 Questionnaire ... 145
7.3.5 Data analysis ... 145
7.4 RESULTS ... 146
7.4.1 Hedonic liking of preload test foods ... 146
7.4.2 Changes in appetite ratings following preload and ad libitum meals ... 147
7.4.3 Impact of preload texture on ad libitum intake ... 149
7.5 DISCUSSION ... 151
7.6 CONCLUSIONS ... 156
7.7 REFERENCES ... 157
CHAPTER 8: EXECUTIVE SUMMARY AND FUTURE OUTLOOK ... 162
RESEARCHIMPLICATIONS ... 163
RECOMMENDATIONSFORFUTURESTUDY ... 164
APPENDICES ... 166
APPENDIXA:STATISTICAL HIERARCHICAL CLUSTERING OF SUBJECTS FOR ORAL PROCESSING PARAMETERS OF PROTEIN-FRUIT PUREES ... 167
LIST OF TABLES
CHAPTER 1: Designing foods for satiety: The roles of food structure and oral processing in satiation and satiety (Literature Review)
Table 1.1. Oral processing studies organized by food texture ... 4 Table 1.2. Studies evaluating the effects of food texture on satiation and satiety ... 7 CHAPTER 2: An iso-protein model food system for evaluating food texture effects
Table 2.1. Formulation of WPI-based model structures ... 17 Table 2.2. Descriptive analysis terms used in evaluation of sensory texture ... 19 Table 2.3. Rheological parameters from creep recovery and uniaxial compression testing ... 22
Table 2.4. Descriptive sensory analysis ratings of WPI model structures ... 22 Table 2.5. Selected significant Pearson correlation coefficients among sensory parameters across all model foods ... 23 CHAPTER 3: A comparison of the lubrication behavior of whey protein foods using
tribology in linear and elliptical movement
Table 3.1 Formulation of WPI-based model structures ... 36 CHAPTER 4: Development of a novel method to quantify tongue movement during oral processing of fluid and semisolid foods
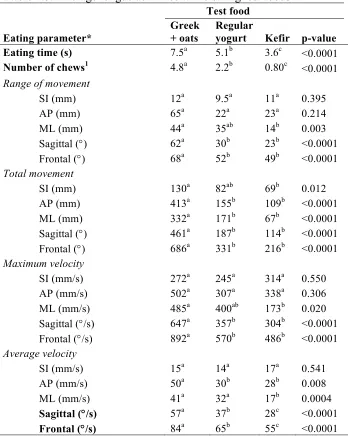
Table 4.1. Slopes used to correct for magnet rotation during translational movements ... 65 Table 4.2. Average recorded movements and root-mean-square deviations (RMSD) for movements of known distance in three dimensional space. All data in millimeters ... 67 Table 4.3. Average recorded rotations and root-mean-square deviations (RMSD) for rotations of known distance in three dimensional space. All data in degrees ... 68 Table 4.4. Root-mean-square deviations (RMSD) of three dimensional movements as impacted by magnet rotation ... 69 Table 4.5. Average tongue activities while eating test foods ... 74 CHAPTER 5: Oral processing patterns of semisolid fruit purees with added fat or oat
particulates
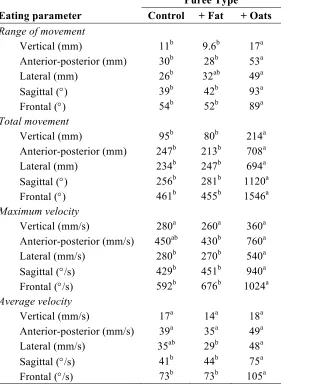
Table 5.1. Facial jaw-muscle activity parameters during consumption of protein-fruit purees ... 93 Table 5.2. Average jaw movements during consumption of protein-fruit purees ... 94 Table 5.3. Average tongue movements during consumption of protein-fruit purees ... 95 CHAPTER 6: Physiological eating patterns of fluid, semisolid, and solid foods
Table 6.3. Average jaw movements during consumption of test foods ... 119
Table 6.4. Average tongue movements during consumption of test foods ... 120
CHAPTER 7: Textural variation of a pre-meal protein snack does not significantly impact appetite ratings or ad libitum intake Table 7.1. Participant characteristics ... 140
Table 7.2. Whey protein preload formulation ... 143
Table 7.3. Nutritional composition of whey protein preloads ... 143
Table 7.4. Oral processing parameters of whey protein preloads1 ... 144
Table 7.5. Nutritional composition of ad libitum lunch and dessert ... 144
Table 7.6. Changes in appetite ratings from baseline after preload and ad libitum lunch and dessert ... 149
Table 7.7. Ad libitum intakes and standard errors following test food preloads ... 150
LIST OF FIGURES
CHAPTER 1: Designing foods for satiety: The roles of food structure and oral processing in satiation and satiety (Literature Review)
Figure 1.1. The relationships among food structure, oral processing, sensory perception, and satiation and satiety ... 9 CHAPTER 2: An iso-protein model food system for evaluating food texture effects
Figure 2.1. WPI-based model structures ... 20 Figure 2.2. Small strain oscillatory frequency sweeps of WPI model structures ... 21 Figure 2.3. Creep recovery curves for WPI model foods ... 21 Figure 2.4. Stress-strain curves of solid gel samples from uniaxial compression testing . 22 Figure 2.5. Relationships between scaled instrumental fracture stress and sensory
parameters for soft solid model foods ... 24 Figure 2.6. Relationships between maximum mechanical stiffness (1/Jmax) and sensory
ratings across the spectrum of model foods ... 24 Figure 2.7. Food structure breakdown scheme based upon WPI model structures:
relationships between initial food structure and oral processing, sensory perception, and consumption time ... 26 CHAPTER 3: A comparison of the lubrication behavior of whey protein foods using
tribology in linear and elliptical movement
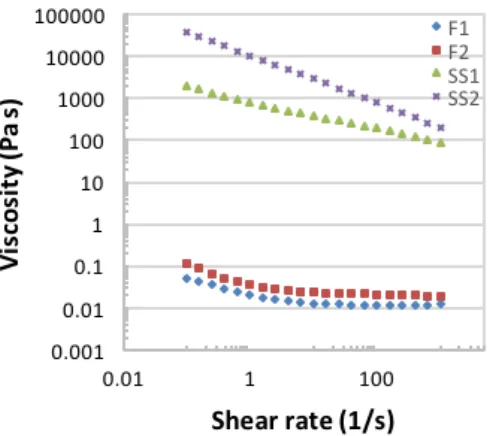
Figure 3.1. WPI model food viscosity as a function of shear rate ... 39 Figure 3.2. Frictional coefficients of WPI model foods evaluated in original form (a/b) or following oral processing (c/d; n = 4) across a range of sliding speeds in linear and
elliptical movement ... 42 Figure 3.3. Coefficient of friction of WPI model foods (without oral processing) as a function of the friction parameter (viscosity x speed / load) across a range of linear and elliptical sliding speeds ... 45 CHAPTER 4: Development of a novel method to quantify tongue movement during oral processing of fluid and semisolid foods
Figure 4.1. Rectangular jaw magnet (left) and circular tongue magnet (right) used in oral processing data collection ... 57 Figure 4.2. Coordinate axes of tongue movement in translational (x, y, z) and rotational (Rs, Ff) dimensions ... 57
Figure 4.3. An example image from the finite element model demonstrating the magnetic field strength of the virtual tongue tracking magnet (black dot). The magnetic field
directions within the magnetic field generated by the headgear (b). Data was recorded and sent to a computer during movement and subsequently analyzed to determine accuracy of equipment and data analysis methodology ... 60 Figure 4.5. A subject during an experimental oral processing session connected to the JT-3D jaw tracking headgear to measure jaw or tongue movement and electromyography (EMG) electrodes to measure jaw-muscle activity. Inset: the tongue tracking magnet glued to the tip a subject’s tongue ... 61 Figure 4.6. Root-mean-square deviations (RMSD) of SI, AP and ML magnet movements measured with 0, 25, 50, or 75 degrees of sagittal (a, c, e) or frontal (b, d, f) magnet
rotation ... 70 Figure 4.7. 3-D (a) and rotational (b) tongue movement data recordings for a single consumption replicate of a Greek yogurt with added oats ... 72 CHAPTER 5: Oral processing patterns of semisolid fruit purees with added fat or oat
particulates
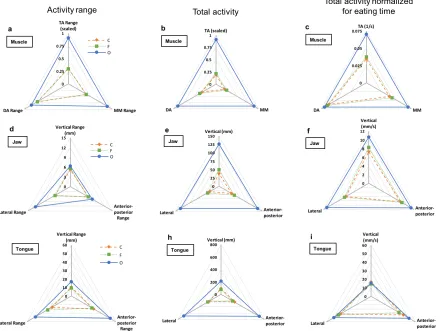
Figure 5.1. TCATA sensory profiles of control (a), added fat (b), and added oats (c) protein-fruit puree ... 92 Figure 5.2. Activity ranges, total activities, and total activities normalized for eating time for muscle (a, b, c), jaw (d, e, f), and tongue* (g. h, i). ... 97 Figure 5.3. Distribution of eating times (a), total lateral jaw movement (b), and total lateral tongue movement (c) of 12 subjects eating three protein-fruit purees. ... 98 Figure 5.4. Dendogram hierarchical clustering of 12 subjects for each puree type based on 13 eating parameters (time, chews, and muscle/jaw/tongue activities). ... 100 Figure 5.5. Three dimensional jaw (a) and tongue (b) movements in real time of two subjects consuming a protein-fruit puree with added oats. ... 100 CHAPTER 6: Physiological eating patterns of fluid, semisolid, and solid foods
Figure 6.1. Activity ranges, total activities, and total activities normalized for eating time for muscle (a, b, c), jaw (d, e, f), and tongue (g, h, i). ... 122 Figure 6.2. Variation in eating time (a), number of chews (b), and total lateral jaw (c) and tongue (d) movements of 12 subjects eating fluid (F), semisolid (SS) and soft gel (G1) and firm gel (G2) whey protein model foods. ... 123 Figure 6.3. Three dimensional jaw (a, b, c, d) and tongue (e, f, g, h) movements in real time of fast and slow-eating subjects consuming four whey protein-based model food textures. Note the differences in axis ranges. ... 125 Figure 6.4. A model of oral processing phases and behaviors for fluid, semisolid, and soft solid foods ... 128 CHAPTER 7: Textural variation of a pre-meal protein snack does not significantly impact appetite ratings or ad libitum intake
CHAPTER 1:
Designing foods for satiety: The roles of food structure and
oral processing in satiation and satiety
(Literature Review)
Designingfoodsforsatiety: Therolesof foodstructureandoral processingin satiation andsatiety
CarolineL.Campbell,TyB.Wagoner,E.AllenFoegeding*
DepartmentofFood,BioprocessingandNutritionSciences,Box7624,NorthCarolinaStateUniversity,Raleigh,NC,27695-7624,UnitedStates
ARTICLE INFO
Articlehistory:
Received6January2016 Receivedinrevisedform26July2016 Accepted30August2016 Availableonlinexxx
Keywords: Foodstructure Texture Oralprocessing Satiation Satiety
ABSTRACT
Food consumption is determined by a range of factors that contribute to satiation, which ends a meal, and satiety,whichdeterminestimebetweenmeals.Foodstructureandtexturecontributetosatiationand satiety;however,theprecisemechanismsarenotfullyestablished.Thetimerequiredfororalprocessing hasbeenshowntoinfluencesatiation/satiety,buttherolesofphysiologicalelementsoforalprocessing, such as muscle activity, jaw movement, and tongue movement, remain to be established. Relationships among food structure, texture, oral processing, and satiation/satiety are discussed in reference to designing foods to maximize the contribution of food structure to satiation/satiety.
ã2016ElsevierLtd.Allrightsreserved.
Contents
1. Introduction . . . 00
2. Buildingfoodstructure ...00
3. Foodstructureandoralprocessing...00
3.1. Effectsoffoodstructureoneatingrateandduration...00
3.2. Effectsoffoodstructural/texturalattributesuponoralprocessing ...00
3.3. Effects of structure on dynamic oral processing and sensory perception . . . 00
4. Satiation and satiety . . . 00
4.1. Indicatorsofsatiationandsatiety ...00
4.2. Effectsofmacromoleculesonsatiation/satiety...00
4.3. Approachestofoodtexturemodificationforsatietystudies ...00
4.3.1. Addinganingredienttothickenfluidsandsemisolids ...00
4.3.2. Grinding or homogenizing food . . . 00
4.3.3. Increasing food volume . . . 00
4.4. Effectsoffoodstructureuponsatietyandsatiation...00
5. Designingfoodsforsatiationandsatiety ...00
6. Futureoutlook ...00
Acknowledgments . . . 00
References . . . 00
1.Introduction
Agrowingworldpopulationcombinedwithglobalclimatic changeshasurgedsocietytocriticallyevaluatethe
agriculture-foodcontinuum.Therelativelynewconceptof“foodsecurity”isa primaryconsiderationinordertofeed9billionpeopleby2050 (Godfrayet al.,2010).Ideally,this wouldbeaccomplishedby sustainableincreasesinagriculturalproductionwithfoodsthat supplytheidealamountofnutrients!preventingtheproblemsof insufficientnutrientsandalsoinhibitingtheoverconsumptionof nutrients. Thelatter is animmediate problemmanifested in obesityratesof36%intheUSand13%globally(Weight-Control
*Correspondingauthor.
E-mailaddress:[email protected](E.A.Foegeding).
http://dx.doi.org/10.1016/j.foostr.2016.08.002
2213-3291/ã2016ElsevierLtd.Allrightsreserved.
FoodStructurexxx(2016)xxx–xxx
GModel
FOOSTR55No.ofPages12
Pleasecitethisarticleinpressas:C.L.Campbell,etal.,Designingfoodsforsatiety:Therolesoffoodstructureandoralprocessinginsatiation and satiety, food structure (2016),http://dx.doi.org/10.1016/j.foostr.2016.08.002
ContentslistsavailableatScienceDirect
Food Structure
CHAPTER 2:
An iso-protein model food system for evaluating
food texture effects
AN ISO-PROTEIN MODEL FOOD SYSTEM FOR EVALUATING FOOD TEXTURE EFFECTS
CAROLINE L. CAMPBELL, CHRISTOPHER R. DAUBERT, MARYANNE DRAKE and E. ALLEN FOEGEDING1
Department of Food, Bioprocessing and Nutrition Sciences, North Carolina State University, 100 Schaub Hall, Campus Box 7624, Raleigh, NC 27695-7624
KEYWORDS
Whey protein, oral processing, model foods, sensory, texture
1Corresponding author.
TEL: 919-513-2244; FAX: 919-513-8023;
EMAIL: [email protected]
Received for Publication November 17, 2015 Accepted for Publication February 9, 2016 Published online Article Accepted on February 18, 2016
doi:10.1111/jtxs.12182
ABSTRACT
Perceptions of food quality, acceptability and satiety are often driven by food texture. It is hypothesized that food texture alters satiety by adjusting eating rate and enjoyment; however, few studies have evaluated wide ranges of food textures with standardized nutritional compositions. The goal of this study was to formulate and characterize a set of isocaloric, macronutrient-matched model foods with varying textures. Six distinct food textures were produced by varying the extent and type of aggregation of 11% whey protein isolate solutions. Textures were grouped into fluid-like (fluid, thin and thick semisolids) and solid-fluid-like (three soft solid gels) based on rheological and sensory properties. Increasing sample mechanical stiffness coincided with increasing cohesiveness in fluid-like textures and decreasing cohesiveness in solid textures; total oral manipulations increased with increasing stiffness. Trends in sensory cohesiveness reflected that solid textures are fractured with the molars while fluid-like textures are manipulated by tongue and jaw movements. These model foods demonstrated properties in the range of commercial food products. They are applicable to investigating structural mechanisms responsible for texture and satiety. A scheme was developed that outlines structural breakdown and coinciding perception of textural properties during oral processing.
PRACTICAL APPLICATIONS
Understanding the multidisciplinary relationships among food structure, texture, sensory perception, satiety and nutrient availability are fundamental in the formulation of healthy and enjoyable food products. However, the selection of products to evaluate the role of food structure upon texture and health is often difficult due to variations in macronutrients, total calories, and sample volume. This research provides a nutritionally standardized model food system that spans a textural spectrum of fluids, semisolids, and soft solids. The basic model foods presented here can be used to establish fundamental relationships between food structure and physiological outcomes. Additionally, these model foods can easily be reformulated to represent more complex structures (e.g., mixed gels, emulsions) or to evaluate the effects of added flavor or color.
INTRODUCTION
Food texture is a major consideration in the design of food products, as it impacts perceptions of quality and is a key driver of food consumption patterns (Szczesniak 1990). Knowledge of how food structure determines texture can be used to guide reformulation of products (such as fat, sugar
or salt reduction), to target products for specific market seg-ments (e.g., elderly, vegan, gluten-free), or to develop textures for consumers with particular likes and dislikes (e.g., culture-specific preferences). Additionally, food structure and texture impact digestion efficiency and nutrient availability (Macierzankaet al. 2012) and the perception of satiation and
Journal of Texture Studies47(2016) 377–391VC2016 Wiley Periodicals, Inc. 377
CHAPTER 3:
A comparison of the lubrication behavior of whey protein
foods using tribology in linear and elliptical movement
Caroline L. Campbell, E. Allen Foegeding, Fred van de Velde
3.1ABSTRACT
Lubrication is an important factor in the sensory evaluation of food products. Tribology provides a theoretical framework and instrumental methods for evaluating frictional properties between two moving surfaces and the lubrication behavior of products between these surfaces. Relating frictional measurements to sensory properties detected during oral processing requires careful and pertinent choices in surface materials and testing conditions. The aims of this study were to investigate 1. differences in lubrication behavior of a range of food textures and 2. the differences between linear and elliptical movement and added saliva to understand the contribution of food structure to friction. Six whey protein model food samples, ranging in texture from fluid to semisolid to soft solid, were analyzed using a pin on disk tribometer to determine the coefficient of friction across a range of sliding speeds. The samples were analyzed in their initial form and post-oral processing (n = 4) in both linear and elliptical movements. Elliptical movement slightly decreased coefficients of friction and extended the shape of the friction curve. Increases in test food viscosity
3.2INTRODUCTION
Food oral processing is the sum of processes involved from placement of a portion of food in the mouth until swallowing. However, oral processing is highly dynamic and difficult to measure in vivo. Tribology – the study of friction between two interacting surfaces and the lubrication of products in between these surfaces – is common in the fields of mechanical engineering and material science. Within the last decade, tribology has been applied to food products (Malone et al. 2003; Stokes et al. 2013). Of particular interest is the use of tribology to correlate instrumentally-measured frictional properties with human sensory evaluation (Chen and Stokes 2012; Prakash et al. 2013). Because texture stems from molecules and mesostructures, tribology can provide a link to understand how food structure and frictional properties throughout oral processing contribute to perceptual parameters, such as creaminess and smoothness, and how they contribute to food preference.
van Vliet et al. (2009) classifies foods into four physical forms: fluids, semisolids, soft solids, and hard solids, based upon their rheological and sensory properties. These initial food textures determine the approach and/or extent of oral processing required to prepare a bolus suitable for swallowing. Incorporation of saliva alters food viscosity (via
dilution/mixing and enzymatic activity), affects emulsion droplet aggregation, initiates nutrient digestion, and knits food particles together for safe swallowing (Foegeding et al. 2015; Stokes et al. 2013). Shear rates within the mouth are estimated to vary between 10-100 s-1 (Shama and Sherman 1973), while oral and tongue speeds have been estimated to be between 10-200 mm/s during eating and 5 mm/s during swallowing (Gao et al. 2013; Hiiemae and Palmer 1999; Malone et al. 2003; Prinz et al. 2007; Steele and Van Lieshout 2009). Oral processing is also estimated to apply loads between 0.01 and 90 N (Miller and Watkin 1996; Sasaki et al. 2011); additionally, tongue pressure may be as important as applied load (Hori et al. 2015). Variations in tribological shear rates and applied loads shows that coefficients of friction decrease with increasing speed and pressure (Malone et al. 2003; Moore 1975; Prinz et al. 2007) and are impacted by the addition and type of saliva (e.g. stimulated v. unstimulated) (Bongaerts et al. 2007; Prinz et al. 2007). Correcting for variations in sample viscosity also impacts the COF v. speed curve: when viscosity is accounted for, COF curves have been demonstrated to collapse into a master Stribeck curve (Bongaerts et al. 2007; de Vicente et al. 2005, 2006; Myant et al. 2010).
during oral processing, including the lips, teeth, tongue, cheeks, upper palate, and mix with saliva (Chen and Stokes 2012; Foster et al. 2011). The polymer polydimethylsiloxane
(PDMS) is considered a representative, reproducible, and readily available substitute for oral tissue (Bongaerts et al. 2007; Dresselhuis et al. 2007). Although it is smoother, less wettable, of higher elasticity, and has different effects on emulsion coalescence when compared to pig’s tongue, PDMS is the closest biological model to a human tongue (Dresselhuis et al. 2007).
Most tribological studies on foods to date rely upon linear or rolling rotary
movements. However, recent studies showed that the actual movement of the tongue is more elliptical than linear (Maksimovic-Damjanovic et al. 2014). The goal of this study was two-fold: 1. to compare the effects of food texture on friction and 2. to compare the frictional factors obtained from linear and elliptical movement patterns of pin on disk tribology, with and without the addition of saliva. All measurements were conducted under relevant oral processing conditions (speed and contact pressures) using a PDMS-silicone tribopair.
3.3MATERIALS AND METHODS 3.3.1 Sample preparation
Whey protein isolate (WPI) (BiPRO, 93.2% protein, dry basis, nitrogen x 6.38) was acquired from Davisco Foods International, Inc (Le Sueur, MN, USA). Protein content was 69.2% β-lactoglobulin, 30.8% α-lactalbumin, and negligible bovine serum albumin or glycomacropeptide based upon total peak area in reverse phase HPLC analysis as by
plasma atomic emission spectroscopy and found to contain 0.06% P, 0.77% K, 0.08% Ca, 0.04% Mg, 1.31% S and 0.69% Na. Additional materials for solution formulation included food-grade sodium hydroxide and hydrochloric acid (Sigma-Aldrich, St. Louis, MO, USA), deionized water, and Food Lion (store) brand imitation vanilla flavor and Harris Teeter (store) brand iodide-free NaCl purchased locally (Raleigh, NC, USA).
The WPI model foods used were formulated and characterized previously by
Table 3.1 Formulation of WPI-based model structures
Sample pH
NaCl (mM) Vanilla flavor (%) Heat time (min)
Thin fluid (F1) 6.9 - 1.5 0
Thick fluid (F2) 6.9 - 1.5 5
Thin semisolid (SS1) 6.9 - 1.5 15 Thick semisolid (SS2) 6.4 - 1.5 30
Soft solid (G1) 6.1 - 2.0 30
Firm solid (G3) 6.1 30 3.0 30
3.3.2 Rheological characterization
Viscosity profiles of the fluid and semisolid model foods were determined using a rheometer (MCR 302, Anton Paar, Graz, Austria) at 20°C. The fluids (F1, F2) were
evaluated using a cup and bob attachment (bob diam: 26.659 mm; cup diam: 28.940 mm) and the semisolids (SS1, SS2) were evaluated using a cone and plate attachment (cone diam: 49.94 mm; angle: 0.994°; truncation: 100µm). Viscosities across a range of shear rates were
determined in triplicate via a logarithmic shear rate ramp performed using an up ramp (0.01-200 s-1) followed by a down ramp (200-0.01 s-1) with 10 measurements per decade. The up/down ramp was performed twice per replicate.
3.3.3 Tribology
Tribology measurements were conducted using a pin on disk Bruker UMT TriboLab (Billerica, MA) in a reciprocating drive configuration using a one dimensional force
PDMS:cross-linker 10:1; resulting in an elastic modulus of 3.5 MPa (van Stee et al., 2017). The PDMS probes were prepared in a sand blasted mold to increase the roughness of the surface. The typical size of the asperities was 5 to 10 µm (Dresselhuis et al., 2007; van Stee et al., 2017). The elastic modulus of the silicon rubber was 0.7 MPa (van Stee et al. 2017). Materials were placed between the tribo-pair with a constant load of 0.5 N, which corresponded to a contact pressure of around 45 kPa (van Stee et al. 2017). The frictional coefficient at varying
oscillatory speeds was measured in both linear and elliptical motions. For both motions, the bottom drive oscillated 25 mm with an amplitude of 12.5 mm at increasing oscillatory frequencies of 0.1-2.0 Hz (average speed 7-140 mm/s) for linear movements or 0.25-0.75 Hz (average 7-56 mm/s at most linear segment of oscillation) for elliptical movements
(consistent elliptical motions could not be maintained at frequencies greater than 0.75 Hz) (van Stee et al. 2017). To achieve an elliptical motion, the top probe was also oscillated a total distance of 6 mm perpendicular to the bottom surface. Each sliding speed was maintained for 10 oscillation cycles and the coefficient of friction (COF; friction force divided by load) was reported as the average of these 10 cycles. Measurements were conducted in triplicate at 20°C; a new PDMS probe and silicon rubber bottom surface were used for each sample and cleaned with ethanol and water prior to testing.
curve. To calculate the friction parameter, the viscosity vs. shear rate data from the rheometer was converted into viscosity vs. speed data using the dimensions of the rheometer geometry. The infinite viscosity of each model food was extrapolated from this curve. Because shear in the tribological contact space is very high, the infinite viscosity was determined to be the most relevant representation for calculation of the friction parameter.
3.3.4 Chew and spit sample collection
Four subjects (23-31 yrs) exhibiting healthy dentition participated in chew and spit experiments. Prior to sample collection, panelists refrained from eating or drinking (except water) for 2 hours. Panelists were instructed to first rinse their mouth with water. For saliva collection, subjects spit 5 ml of saliva (natural salivation) in a small plastic cup and again rinsed their mouth with water. For chew and spit collection, each subject orally processed a 5 g aliquot of the model food, and expectorated the sample into a clean sample cup with a lid. Oral processing was standardized among panelists to ensure test foods were adequately processed for tribology testing: fluids (F1, F2) were swished in the mouth 1-2 times,
semisolids (SS1, SS2) were swished in the mouth with the tongue 6 times, and the soft solids (G1, G3) were chewed 40 times.
3.4RESULTS AND DISCUSSION
3.4.1 Rheological characterization
viscosity of SS2 was one magnitude larger than that of SS1 at low shear rates; however, SS2 exhibited more extensive shear thinning and SS1 and SS2 had similar viscosities at high shear rates. These results are in line with viscoelastic characterization of these model foods published by Campbell et al. (2016).
Figure 3.1. WPI model food viscosity as a function of shear rate
3.4.2 Comparison of linear and elliptical tribology
correlated negatively with the viscosity of the test food. As shown in Figure 3.2a and 3.2b, the COF across a range of sliding speeds decreased on the order of SS2 < SS1 < F2 < F1. Within the range of speeds measured, all curves remained in the mixed regime and only F1 and F2 encompassed both the boundary and mixed regimes during elliptical analysis, consistent with van Stee et al. (2017). For test foods measured as is (no chew and spit), the COF of linear movements (0.38-0.68) were significantly higher (statistics not shown) than elliptical movement (0.31-0.62) at the same sliding speeds.
Figure 3.2. Frictional coefficients of WPI model foods evaluated in original form (a/b) or following oral processing (c/d; n = 4) across a range of sliding speeds in linear and elliptical movement
Connecting lines do not indicate continuous data but are provided to guide the eye.
The COF of saliva was consistently lower than the model foods at low sliding speeds and higher at high sliding speeds; oral processing occurs at low tongue speeds of
exhibited lower COF values than stimulated saliva. Because the saliva harvested in the present study was unstimulated, the COF of stimulated saliva may be closer to that of chewed and spat samples. Chew and spit observations provide a comparison to experiments
conducted by Selway and Stokes (2014) in which COF values increased following addition of custards of varying fat contents to a tribometer pre-coated with salivary films. Though model foods in the present study were orally processed and thereby mixed with saliva, losses in lubrication (increases in COF values) for chewed and spat WPI foods are similar to those observed in Selway and Stokes (2014).
Lower COF values for fluids and semisolids post-oral processing are likely due to easier and more extensive dissolution and mixing with saliva. Kokini (1987) suggested that slipperiness is related to the inverse of the sum of viscous and frictional forces. Because the model foods had identical protein concentrations and contained no particulates, the
texture/viscosity should be the driving factor for differences in lubrication (Liu et al. 2016). Research to date shows that low COF values correlate with increased sensory ratings of slipperiness, smoothness, and creaminess (Chojnicka-Paszun and de Jongh, 2014; Sonne et al. 2014), thus one could hypothesize that these WPI fluids and semisolids may be perceived as more smooth and/or creamy than their gelled WPI counterparts.
Food viscosity impacts perceptions of smoothness, slipperiness, and creaminess (Chojnicka-Paszun and de Jongh, 2014). As shown in Figure 3.3, correction for sample viscosity shifted the COF vs. speed curves to the right with increasing viscosity. This
demonstrated that correction for sample viscosity collapses COF plots into a master Stribeck curve that encompasses the boundary, mixed, and hydrodynamic regimes (Bongaerts et al. 2007; Chojnicka et al. 2008; Myant et al. 2010; de Vicente et al. 2006). The incomplete Stribeck curve shown in the current study may be due to the inclusion of semisolid textures in addition to fluids. Alternatively, Liu et al. (2016) showed that frictional behavior of starch dispersions and emulsions shifted to the right and/or changed in shape with changes in composition but didn’t collapse into a master curve to encompass all regimes of the Stribeck curve. For the present model foods, horizontal curve separations along the x-axis
Figure 3.3. Coefficient of friction of WPI model foods (without oral processing) as a function of the friction parameter (viscosity x speed / load) across a range of linear and elliptical sliding speeds
Lines do not imply continuous data and are provided to guide the eye.
3.5CONCLUSIONS
This study provides an initial look at elliptical tribology as well as an analysis of frictional behavior in model foods differing only in physical properties. Frictional behaviors of model foods were better differentiated in their original form than after oral processing and incorporation of saliva. With the exception of the firmest WPI gel, the coefficient of friction curves of model foods converged into almost identical curves after mixing with saliva.
processing. Though elliptical tribology provides a contrast to linear and rotary tribology, these movements need to be compared across a wider range of sample types (particle type and size, fat content, and others) and correlated with sensory parameters (smoothness, slipperiness, mouthfeel etc.) in order to better understand how different in vitro movements relate to in vivo oral processing and sensory perception.
3.6ACKNOWLEDGMENTS
3.7 REFERENCES
BARRANGOU, L.M., DAUBERT, C.R., FOEGEDING, E.A. 2006. Textural properties of agarose gels. I. Rheological and fracture properties. Food Hydrocoll. 20, 184–195.
BONGAERTS, J.H.H., ROSSETTI, D., STOKES, J.R. 2007. The lubricating properties of human whole saliva. Tribol. Lett. 27, 277–287.
CAMPBELL, C.L., DAUBERT, C.R., DRAKE, M., FOEGEDING, E.A. 2016. An iso-protein model food system for evaluating food texture effects. J. Texture Stud. 47, 377–391. CHEN, J. and STOKES, J.R. 2012. Rheology and tribology: two distinctive regimes of food texture sensation. Trends Food Sci. Technol. 25, 4–12.
CHOJNICKA, A., DE JONG, S., DE KRUIF, C.G., VISSCHERS, R.W. 2008. Lubrication properties of protein aggregate dispersions in a soft contact. J. Agric. Food Chem. 56, 1274– 1282.
CHOJNICKA-PASZUN, A. and DE JONGH, H.H.J. 2014. Friction properties of oral surface analogs and their interaction with polysaccharide/MCC particle dispersions. Food Res. Int. 62, 1020–1028.
CHOJNICKA-PASZUN, A., DE JONGH, H.H.J., DE KRUIF, C.G. 2012. Sensory perception and lubrication properties of milk: influence of fat content. Int. Dairy J. 26, 15– 22.
DE WIJK, R.A. and PRINZ, J.F. 2006. Mechanisms underlying the role of friction in oral texture. J. Texture Stud. 37, 413–427.
DE VICENTE, J., STOKES, J.R., SPIKES, H.A. 2005. The frictional properties of Newtonian fluids in rolling–sliding soft-EHL contact. Tribol. Lett. 20, 273–286. DE VICENTE, J., STOKES, J.R., SPIKES, H.A. 2006. Soft lubrication of model hydrocolloids. Food Hydrocoll. 20, 483–491.
DRESSELHUIS, D.M., KLOK, H.J., STUART M.A.C., DE VRIES, R.J., VAN AKEN, G.A., DE HOOG, E.H.A. 2007. Tribology of o/w emulsions under mouth-like conditions: determinants of friction. Food Biophys. 2, 158–171.
FOSTER, K.D., GRIGOR, J.M.V., CHEONG, J.N., YOO, M.J.Y., BRONLUND, J.E., MORGENSTERN, M.P. 2011. The role of oral processing in dynamic sensory perception. J. Food Sci. 76, R49–R61.
GAO, Z., TANIWAKI, M., SHIMADA, H., ISHIHARA, S., NAKAUMA, M., FUNAMI, T., KOHYAMA, K. 2013. Ultrasound analysis of the effects of food bolus volume on tongue movement at the initiation of swallowing. J. Texture Stud. 44, 387–396.
HIIEMAE, K.M. and PALMER, J.B. 1999. Food transport and bolus formation during complete feeding sequences on foods of different initial consistency. Dysphagia 14, 31–42. HORI, K., HAYASHI, H., YOKOYAMA, S., ONO, T., ISHIHARA, S., MAGARA, J., TANIGUCHI, H., FUNAMI, T., MAEDA, Y., INOUE, M. 2015. Comparison of mechanical analyses and tongue pressure analyses during squeezing and swallowing of gels. Food
Hydrocoll. 44, 145–155.
KOKINI, J.L. 1987. The physical basis of liquid food texture and texture-taste interactions. J Food Eng. 6, 51–81.
LIU, K., STIEGER, M., VAN DER LINDEN, E., VAN DE VELDE, F. 2016. Tribological properties of rice starch in liquid and semi-solid food model systems. Food Hydrocoll. 58, 184–193.
MAKSIMOVIC-DAMJANOVIC, S., BULT, J., DE WIJK, R.A., STIEGER, M. 2014. Analysis of tongue movements during eating using electromagnetic articulography. In Physics, Physiology and Psychology of Eating 3rd International Conference on Food Oral Processing. Wageningen, The Netherlands.
MALONE, M., APPELQVIST, I.A., NORTON, I. 2003. Oral behaviour of food hydrocolloids and emulsions. Part 1. Lubrication and deposition considerations. Food Hydrocoll. 17, 763–773.
MILLER, J.L. and WATKIN, K.L. 1996. The influence of bolus volume and viscosity on anterior lingual force during the oral stage of swallowing. Dysphagia 11, 117–124. MOORE, D.F. 1975. Principles and applications of tribology. Pergamon Press, Oxford, England.
PRINZ, J.F., DE WIJK, R.A., HUNTJENS, L. 2007. Load dependency of the coefficient of friction of oral mucosa. Food Hydrocoll. 21, 402–408.
SASAKI, M., ARAKAWA, T., NAKAYAMA, A., OBINATA, G., YAMAGUCHI, M. 2011. Estimation of tongue movement based on suprahyoid muscle activity. In 2011 International Symposium on Micro-NanoMechatronics and Human Science (MHS) IEEE, pp. 433–438.
SELWAY, N. and STOKES, J.R. 2014. Soft materials deformation, flow, and lubrication between compliant substrates: impact on flow behavior, mouthfeel, stability, and flavor. Annu. Rev. Food Sci. Technol. 5, 373–393.
SHAMA, F. and SHERMAN, P. 1973. Evaluation of some textural properties of foods with the Instron Universal Testing Machine. J. Texture Stud. 4, 344–352.
SONNE, A., BUSCH-STOCKFISCH, M., WEISS, J., HINRICHS, J. 2014. Improved mapping of in-mouth creaminess of semi-solid dairy products by combining rheology, particle size, and tribology data. LWT - Food Sci. Technol. 59, 342–347.
STEELE, C.M. and VAN LIESHOUT, P. 2009. Tongue movements during water
swallowing in healthy young and older adults. J. Speech Lang. Hear. Res. 52, 1255–1267. STOKES, J.R., BOEHM, M.W., BAIER, S.K. 2013. Oral processing, texture and mouthfeel: From rheology to tribology and beyond. Curr. Opin. Colloid Interface Sci. 18, 349–359. VAN AKEN, G.A. 2010. Modelling texture perception by soft epithelial surfaces. Soft Matter 6, 826-834.
VAN STEE, M-A., DE HOOG, E., VAN DE VELDE, F. Submitted 2017. Oral parameters affecting ex-vivo tribology. Biotribology. In review.
VAN VLIET, T., VAN AKEN, G.A., DE JONGH, H.H.J., HAMER, R.J. 2009. Colloidal aspects of texture perception. Adv. Colloid Interface Sci. 150, 27–40.
VARDHANABHUTI, B., COX, P.W., NORTON, I.T., FOEGEDING, E.A. 2011. Lubricating properties of human whole saliva as affected by β-lactoglobulin. Food Hydrocoll. 25, 1499–1506.
CHAPTER 4:
4.1 ABSTRACT
Tongue movements are an essential part of oral processing and food texture
perception. The aim of this study was to establish a novel adaptation of existing technology to measure tongue movement in vivo during food consumption. We adapted
three-dimensional magnetic jaw tracking equipment to measure translational and rotational tongue movements while simultaneously measuring masticatory muscle activity (via
electromyography). The system was calibrated in silico using a magnetic finite element model and modular transformation to ensure that the change in magnet size did not adversely impact measurements of translational movements and to correct for the effects of tongue rotation. Calibration data were used to generate MATLAB code for analyzing in vivo recordings. The system was validated using a test fixture that allowed for precise ex vivo linear and rotational movements within the apparatus sensor array for comparison to data collected from the measurement system. For in vivo testing, the magnet was attached to the tip of the tongue using a periodontal tissue adhesive and tongue movement was recorded while 12 subjects consumed fluid and semisolid yogurt products. For a hypothetical oral space of 48,000 mm3, the tongue tracking measurement errors were unacceptably high (1-25%). Linear measurements during tongue rotations less than 25° were accurate to 0.2-3.2
mm; measurement accuracy decreased with increasing magnet rotation and magnitude of movements. In vivo tongue tracking successfully discriminated variation in tongue activities during consumption of yogurts with and without particulates and exhibited tongue rotational ranges of 20-70°. This study is the first to adapt a 3-D magnetic jaw tracking system to
4.2 INTRODUCTION
Food oral processing is a dynamic activity that serves multiple purposes, including
preparation of food for safe swallowing, initial digestion and nutrient release, and hedonic
enjoyment. Tongue movement is an invaluable component of oral processing, particularly for
fluid and semisolid foods that require little chewing. The tongue aids in breakdown and
dissolution of food particles, development of the bolus during chewing, movement of the
bolus during transport and swallowing, and provides perceptions of texture and taste.
Understanding the trajectory of tongue movements during oral processing and its relationship
to texture perception is important in the development of new and modified food products
(e.g. fat or sugar reduction). Additionally, it can provide insights and rehabilitation
approaches for individuals with eating limitations brought on by age or medical conditions
(e.g. dentures, dysphasia) (Aslam and Vaezi, 2013; Hudson et al., 2000; Kohyama and
Mioche, 2004; Werthmann et al., 2015).
While many groups have evaluated the jaw-muscle activity and movements required to break down solid foods (Brown et al., 1998; Çakir et al., 2012; Kohyama and Mioche, 2004), few studies have attempted to monitor tongue movements during the processing of fluid and semisolids. The majority of tongue movement methodologies are found in the fields of articulography and deglutition, the study of speech and swallowing, respectively.
Lieshout (2009), Yao (2014), and Maksimovic-Damjanovic et al. (2014) utilized electromagnetic articulography to study movements during water swallowing or oral processing. Similarly, Dromey et al. (2006) adapted a magnetic jaw tracking system to measure tongue movement (rather than jaw movement) during speech; however, none of these groups have measured or accounted for tongue rotation.
To date, the most common approach to measuring tongue movement during food oral processing is to examine the compression of food and/or the tongue against the hard palate. The majority of this literature focuses on tongue movement during swallowing of samples varying in texture or final bolus consistency. Hori et al. (2006), Hayashi et al. (2013), and Yokoyama et al. (2014) all utilized a swallow scan system, consisting of a sheet of 5 to 7 pressure sensors that is attached to the upper palate. These pressure measurements have been collected during consumption of solid food samples, focusing on palate pressure at different points in the chewing cycle (Hori et al., 2006), during bolus compression and swallowing (Hayashi et al., 2013), and to examine differences in oral strategies such as squeezing or mastication (Yokoyama et al., 2014). Additional tongue tracking approaches during oral processing include ultrasonography (Gao et al 2013) and videofluorography (Taniguchi et al., 2013). Of these approaches, only videofluorography and EMA track the exact movements of different points of the tongue, while the remaining techniques use indirect measures to extrapolate the position or muscle activity of the tongue or bolus.
While videofluography and EMA can directly measure tongue movement during eating, both have significant drawbacks that can impede data collection and/or oral
requires lacing food samples with barium (Ozaki et al., 2010; Taniguchi et al., 2013), while EMA sensors are attached to wires that protrude from the mouth (Maksimovic-Damjanovic et al., 2014; Steele et al., 2012; Yao, 2014). In addition to being invasive, most tongue tracking methods are also expensive, require extensive data analysis or modeling, and no methodologies to date have separated tongue rotation from translational movements or evaluated the error imposed by tongue rotation upon measurement of translational measurements. The present study aimed to develop a less invasive method that could
accurately measure tongue movement in real time during oral processing in conjunction with masticatory muscle activity and jaw movement. In our approach, we adapt an existing magnetic jaw tracking device by affixing a magnet to the tongue rather than the jaw.
Moreover, we provide the first effort to separate linear movements in three dimensions from rotational tongue movements during oral processing.
4.3 MATERIALS AND METHODS
4.3.1 Equipment adaptation
to measure movement of a magnet attached to a single point on the tip of the tongue. A small circular neodymium magnet (4 mm diameter x 1.5 mm height; 4,022 Gauss surface field; axial magnetization; Bhmax 52 MGOe) (K&J Magnetics, Pipersville, PA) was selected to
replace the rectangular jaw magnet traditionally used for jaw tracking. This magnet was small enough that it could be easily affixed to a subject’s tongue, did not interfere with required tongue movements (e.g., folding etc.), but still exerted a magnetic field that could be sensed by the JT-3D apparatus (Figure 4.1).
Figure 4.1. Rectangular jaw magnet (left) and circular tongue magnet (right) used in oral processing data collection
Figure 4.2. Coordinate axes of tongue movement in translational (x, y, z) and rotational (Rs,
Ff) dimensions
4.3.2 Method calibration and validation
4.3.2.1. In silico
processing and the location of the JT-3D sensors remain constant. Theoretically, however, the changes in detected magnetic field can be calculated by virtually moving either the magnet or the sensors. For simplicity, the sensors were moved in virtual space and the changes in detected magnetic field strength at each sensor were calculated. Changes in the strength of the detected magnetic field are represented by changes in color in Figure 4.3. A secondary in silico modular transformation was performed by introducing different inputs (hypothetical changes in coordinate movement) into the algorithm and ensuring that the hypothetical detected output was as expected (i.e. changes in movement of input and output were identical).
4.3.2.2. Ex vivo
Figure 4.4. Calibration test fixture for tongue tracking: magnet placed in center black holder with individual movement axes and rulers (a) and moved in 3-D and rotational directions within the magnetic field generated by the headgear (b). Data was recorded and sent to a computer during movement and subsequently analyzed to determine accuracy of equipment and data analysis methodology
4.3.3 In vivo oral processing procedures
4.3.3.1. Subject recruitment
Twelve subjects (11 females and 1 male; aged 19-35 years) were recruited and screened for oral health and complete dentition (except for third molars or wisdom teeth), with class I type molar occlusion. Participants did not have a history of gum or periodontal disease and had no major dental treatments, including braces, surgery, dental extraction or restoration, for six months prior to the study. No participants exhibited pain or sound (i.e. grinding, popping, or clicking) in their temporomandibular joints during chewing. No
gave voluntary informed consent to participate. Participants attended a preliminary training session to ensure they were comfortable with the experimental setup, equipment, and test foods. Data collected during this training session included electromyographic activity of the jaw muscles and maximum jaw and tongue mobility to ensure that all subjects had
unrestricted jaw and tongue movement. No data from this session were analyzed. 4.3.3.2. Tongue movement
For tongue tracking, a dot was marked 3-4 mm from the tip of the subject’s tongue with gel paste food dye (AmeriColor, Placentia, CA) and the small circular magnet (4 mm diameter x 1.5 mm height) (K&J Magnetics, Pipersville, PA) was glued on the colored dot using a dental tissue adhesive (PeriAcryl, GluStitch Inc., Delta, BC, Canada) (Figure 4.5).
4.3.3.3. Data Collection
Subjects participated in one 60-minute session during which each sample was consumed in quadruplicate. The first duplicate recordings measured jaw movement and jaw-muscle electromyography (EMG) and the second duplicate recordings measured tongue movement and jaw-muscle EMG (muscle and jaw activities are not reported in the present study). Subjects were seated in an upright position and asked to remain still and avoid
4.3.3.4. Test foods
Test foods were purchased from a local grocery store (Harris Teeter, Raleigh, NC) and selected to represent a range of fluid and semisolid food textures (thick fluid, semisolid, thick semisolid with particulates). All samples were fermentation-based dairy foods and included: a strawberry flavored kefir beverage (K, fluid) (Lifeway, Morton Grove, IL), a smooth-style strawberry lowfat yogurt (Y, homogeneous semisolid) (Yoplait, Minneapolis, MN), and a mixed berry Greek yogurt containing ancient grains and fruit pieces (G+O, heterogeneous semisolid with particles) (Chobani, Norwich, NY). Commercial yogurts were selected in strawberry or mixed berry flavors and had similar calorie contents to minimize differences in subject sample liking.
4.3.3.5. Data processing
Both calibration and aggregate data analysis was performed in MATLAB graphical programming software (MathWorks, Natick, MA). Each ex vivo or in vivo recording was input into MATLAB and the data set was cropped first at the trigger (time 0) and at the end of the recording (for in vivo, when the digastric muscle functions returned to baseline for the final time). The digastric muscles were used as an endpoint of oral processing because they are often indicative of movements related to swallowing (Inokuchi et al., 2014; Palmer et al., 1999).
from placement of the sample in the mouth until the final swallow and are means across all subjects and replicates for each sample treatment. Tongue movements were separated into mean translational (SI, AP and ML) and rotational (sagittal and frontal) movements and reported as ranges of movement, total movement, and maximum and average tongue velocities. Jaw movements were quantified as mean range of movement, total mean movements, and maximum and average jaw velocities in SI, AP and ML dimensions.
Reported terms also include eating duration and number of chews when chewing cycles were clearly identifiable.
4.3.4 Statistical Analysis
Statistical analysis of treatment means (aggregate data) was performed using JMP 12.0 (SAS, Cary, NC). Significant differences among test samples were determined using a one-way analysis of variance (ANOVA) with Tukey’s honestly significant differences at an experiment-wise error rate of α=0.05. A repeated measures experimental design was used, with random effects included for subject and subject-by-treatment interactions.
4.4 RESULTS
4.4.1 Method calibration
processing and analysis. Ex vivo testing was then conducted to confirm that this analysis generated outputs that matched test movements in real time and space.
A finite element model generated data to show how the detected magnetic field strength changes with magnet movement in three translational directions and two rotational directions. This information was used to calculate a slope for movements in each of three dimensions (SI, AP, ML) to correct for errors in linear movement estimates due to magnet rotation. The slopes for each dimension are shown in Table 4.1. These slopes were
incorporated into a transformation matrix algorithm within a MATLAB data analysis application that served to adjust the measured positional data to actual linear movement magnitudes based on the variance in the assumed magnetic field produced by the measured magnet rotation. This MATLAB code is available for use by request.
Table 4.1. Slopes used to correct for magnet rotation during translational movements Dimension Slope (tesla/mm)
Supero-inferior (SI) 4.397 x 10⁻⁸ Antero-posterior (AP) 1.637 x 10⁻⁷ Medio-lateral (ML) 3.325 x 10⁻⁷
4.4.2 Method validation
4.4.2.1. Three dimensional movements
To test the accuracy of the MATLAB analysis code generated from in silico
predicted values (i.e., known movement distance) and observed values (MATLAB output). Table 4.2 shows the recorded output values and root-mean-square deviations (RMSD) from the known input movement. The magnitude of distances tested in each dimension were selected to encompass a greater range of movements than would be expected during oral processing. These practical tongue movement ranges started from an idealized center (i.e., comfortable resting positon) of the oral cavity and encompassed ± 20 mm (SI), ± 30 mm
(AP), and ± 40 mm (ML).
Table 4.2. Average recorded movements, root-mean-square deviations (RMSD), and percent errors for movements of known distance in three dimensional space. All data in millimeters.
Input (mm) SI
RMSD
(% error) AP
RMSD
(% error) ML
RMSD (% error)
-40 - - - - 46.8 6.9 (17%)
-30 - - 31.2 1.4 (4.6%) 33.0 3.3 (11%)
-20 19.9 0.5 (2.5%) 22.3 2.3 (11.5%) 21.9 2.2 (11%) -10 8.7 1.5 (15%) 12.6 2.6 (26%) 10.6 0.7 (7%)
10 9.9 0.2 (2%) 12.2 2.4 (24%) 11.0 1.1 (11%)
20 15.9 4.3 (21.5%) 21.2 1.3 (6.5%) 21.4 1.5 (7.5%)
30 - - 30.7 1.0 (3.3%) 32.3 2.4 (8%)
40 - - - - 45.1 5.2 (13%)
4.4.2.2. Rotational movements
As with isolated 3-D movements, the magnet was also rotated in isolated sagittal and frontal directions with no translational movement to determine the measurement accuracy for rotational movements. The magnet was rotated in 25° increments from 0-75° in sagittal and
frontal directions. Sagittal rotation indicates rotation of the tongue to the side (left or right) while frontal rotation indicates rotation forward and backward. The technician could only ensure movement within 2 degrees of the target; thus, percent errors of 8, 4, and 2% were deemed acceptable for rotations of 25, 50, and 75 degrees, respectively. As shown in Table 4.3, accuracy decreased with increasing rotation. Rotations under 50° were accurate within
Table 4.3. Average recorded rotations and root-mean-square deviations (RMSD) for rotations of known distance in three dimensional space. All data in degrees
Input Sagittal
RMSD
(% error) Frontal
RMSD (% error) 25 27.0 2.4 (9.6%) 27.0 2.8 (11.2%)
50 49.7 0.5 (1%) 47.6 4.1 (8.2%)
75 60.4 14.6 (19.5%) 57.6 17.5 (23.3%)
4.4.2.3. Effects of magnet rotation
Oral processing of fluids and semisolids require limited tongue rotation; however, consumption of solid foods may generate particles, requiring more frontal and sagittal rotation of the tongue during bolus formation and clearing of particles stuck to the teeth. Thus, RMSD values were also calculated to determine the extent to which rotational
movements impacted measured translational movements. Table 4.4 and Figure 4.6 show the effects of 25, 50, and 75-degree magnet rotation in sagittal or frontal dimensions upon RMSD values of translational movements.
As observed in translational movements without magnet rotation, RMSD values increased with increasing magnitude of movement (from the center of the sensing apparatus), regardless of the magnitude of magnet rotation. RMSD values also increased (and accuracy decreased) with increasing magnet rotation (0 < 25 < 50 < 75 degrees) in both sagittal and frontal planes. Measurements under 25-degree magnet rotation deviated less than 5 mm from the actual movement, exhibiting high accuracy (except for maximum SI and ML
rotation during lateral movements (Figure 7f): RMSD values remained constant or decreased from 30 to 40 mm of movement. Overall, accuracy appeared to decrease with increases in linear movements and magnet rotation. However, error rates incurred by 25 degree rotations within movement ranges of ± 30 mm were generally low, estimating translational movements
to within 0.2-3 mm.
Table 4.4. Root-mean-square deviations (RMSD) of three dimensional movements as impacted by magnet rotation
Sagittal Frontal 0° 25° 50° 75° 25° 50° 75°
Vertical
-20 0.5 1.1 7.1 14 2.5 6.2 16
-10 1.5 0.5 2.6 6.6 0.5 3.2 6.3
10 0.2 1.8 4.7 7.1 2.2 5.0 7.8
20 4.3 9.0 14 16 11 15 18
Anterior-posterior
-30 1.4 0.6 7.0 17 2.3 12 23
-20 2.3 1.3 2.8 10 3.2 6.0 15
-10 2.6 1.4 0.5 4.1 1.3 1.2 9.5
10 2.4 0.7 1.0 4.7 1.4 1.4 3.7
20 1.3 0.4 3.2 12 0.9 3.2 11
30 1.0 0.7 6.6 18 1.1 6.6 17
Lateral
-40 6.9 0.7 13 26 3.4 6.8 14
-30 3.3 1.3 12 21 0.3 11 21
-20 2.2 0.7 8.5 15 1.0 7.7 15
-10 0.7 0.6 4.5 6.8 0.2 3.2 6.8
10 1.1 0.4 3.1 7.3 0.3 3.4 7.2
20 1.5 0.9 6.3 15 0.5 7.3 15
30 2.4 2.9 9.9 22 1.4 7.7 22
4.4.3 In vivo testing
4.4.3.1. Raw data recordings
Figure 4.7. 3-D (a) and rotational (b) tongue movement data recordings for a single consumption event of a Greek yogurt with added oats
4.4.3.2. Differentiation of fluid and semisolid foods
were clearly segmented in all dimensions except for SI movements. G+O required
significantly more three dimensional and rotational movements than regular yogurt and kefir; however, no significant differences were observed in tongue movements between regular yogurt and kefir, except for average rotational velocities. Because additional modifications are required to increase the accuracy of the tongue tracking system, the reported