The Optimal Design for SMART Reactor Cover
Kang-Soo Kim, Tae-Wan Kim, Kyeong-Hoon J e o n g , Gyu-Mahn Lee and Keun-Bae Park
Korea Atomic Energy Research Institute, P. O. Box 105, Yusong, Taejon, Korea
ABSTRACT
The reactor pressure vessel of the nuclear power plant has been made o f carbon steel because of its high strength. Since the central cover o f SMART(System-integrated Modular Advanced ReacTor) includes many penetrations for various components, pipings and instrumentations, it is very difficult to clad on the surface of small holes after machining. If the central cover is made of stainless steel, both the corrosion problem and the cladding difficulty may be overcome and the manufacturing cost will be reduced. In this paper, the stainless steel central cover is analyzed using 2-D axisymmetric model, 3-D equivalent solid plate model and 3-D real model with holes by ANSYS and IDEAS code. The analysis results show that the stainless steel central cover meets requirements of Section III ASME Code for the design pressure loading. Also, the optimization for the reactor cover which consists of a central cover and an annulus cover was performed using ANSYS code.
INTRODUCTION
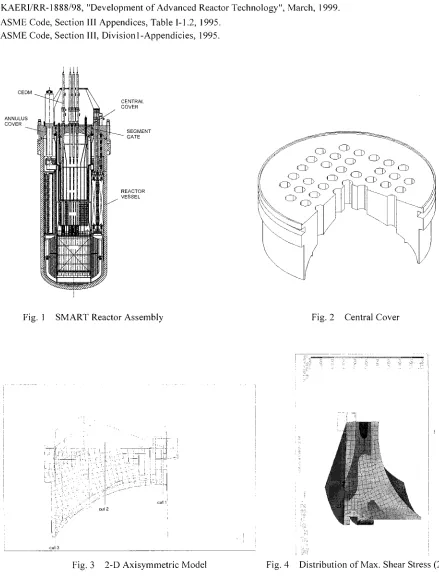
The reactor pressure vessel for the nuclear power plant has been made of carbon steel because of its high strength. Stainless steel cladding is normally applied on the coolant-contact-surface of the carbon steel pressure vessel since carbon steel is highly susceptible to the reactor environment producing corrosion. The central cover of SMART includes relatively many penetrations for various components, pipings and instrumentations (Fig.l,2). This makes it difficult to keep a conventional design of carbon steel with stainless steel cladding. If the central cover o f whole stainless steel body is adopted, both the corrosion problem and the manufacturing difficulty are to be solved and the manufacturing cost will be reduced. However, the structural integrity of the stainless steel central cover remains still unverified since yield strength of stainless steel is generally lower than that of carbon steel.
In this paper, to check whether the stainless steel central cover is to withstand the 17 MPa of the design pressure, the stainless steel central cover was analyzed by IDEAS [1] and ANSYS code [2] using a 2-D axisymmetric solid element. The procedures of analyses were made in accordance with the ASME Code [3]. Also, the central cover was modeled using 3-D equivalent solid plate and 3-D real plate with holes by IDEAS code [4-6]. Also, to get the optimal shape of the reactor cover which consists of a central cover and an annulus cover, the optimization was performed using ANSYS code.
ANALYSIS OF 2-D AXISYMMETRIC MODEL
Analysis Model and Analysis Method
The dimension of the central cover (Fig.2) is the diameter 2210 mm and the minimum thickness 353 mm. The central cover should meet the design condition of ASME Code, Section III NB3221.
P,,, < &,, , PI~ < I. 5 S,,, , Pz. + P b < 1.5 S,,
where, P,,, = general membrane stress, PL = local membrane stress, Pb = bending stress, Sm= stress intensity
The design pressure and the temperature of the central cover is 17 MPa and 150 °C, respectively. Three materials for the analysis of the central cover are considered and mechanical properties are as follows [7].
- 1 -
SMiRT 16, Washington DC, August 2001
Paper # 1028Table 1. Material Properties
Austenitic Stainless Steel
SA 240, Type 321 SA 336,Class F321
Carbon Steel
SA 508, Class 4
Yield Strength (MPa) 205 207 483
Modulus of Elasticity (MPa) 173,103 173,103 183,448
Poisson's Ratio 0.27 0.27 0.3
Stress Intensity (MPa) at 150 °C 138 138 206
The central cover was modeled and analyzed using IDEAS code. Also, IDEAS modeling INPUT was converted to ANSYS INPUT and the central cover was analyzed using ANSYS code. 2-D axisymmetric solid elements were used for modeling. The x, y, z displacements of the face contacted with the segment gate and x, z displacements of the face contacted with the torus ring were fixed in Fig. 3. The central cover with holes can be converted to the equivalent solid plate by the A-8132.4 (15) formula of the reference 8. The ligament efficiency of the central cover was as follows.
q = h / P = { h + ( 2 E t / E ) t t } / P : 0.586
Effective Young's modulus and Possion's ratio were estimated by Fig. A.8131-1 of reference [8]. These values were E* = 108,179 MPa and v , = 0.29, respectively. Also, the hoop stress of the equivalent solid plate was considered.
S p i = CY r = cY o = { h / P } { ( P - h - 2 tt) / [ h + 2 (Et / E ) tt ]} p; = 4 . 4 6 8 M P a
Analysis Results
1) Analysis Result of ANSYS
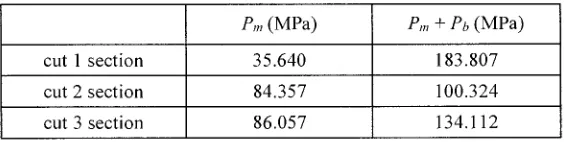
The analysis was calculated at three sections as shown in Fig. 3 and these results were as follows.
Table 2. Results of Finite Element Analysis using ANSYS
Pm (MPa) P m + Pb (MPa)
cut 1 section 35.640 183.807
cut 2 section 84.357 100.324
cut 3 section 86.057 134.112
2) Analysis Result of IDEAS
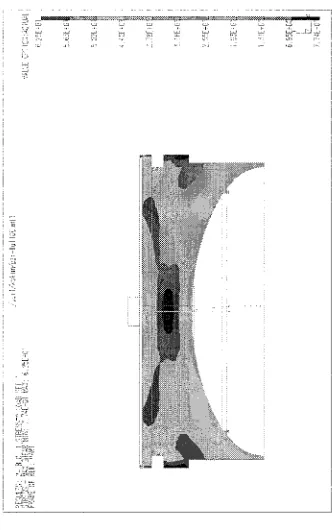
Analysis Results of IDEAS Code represented the maximum principal stress (Max. cy j ), as 105 MPa and the maximum
shear stress (z max) as 58.6 MPa. The distribution of maximum shear stress was shown in Fig. 4.
A N A L Y S I S O F
3-D
M O D E LAnalysis model of 3-D equivalent solid plate
1) Analysis model and analysis methodThe central cover was modeled using 3-D equivalent solid plate without holes. Effective Young's modulus and
applied load was 17 MPa of the internal pressure. The finite element model of 3-D equivalent solid plate was shown in Fig. 5.
2) Analysis Results
Analysis results of IDEAS code represented the maximum principal stress (Max. crz ) as 66.5 MPa and the maximum
shear stress (r,,,~,.,.) as 62.5 MPa. The distribution of maximum shear stresses was shown in Fig. 6.
Analysis model of 3-D real plate
1) Analysis model and analysis methodSince the central cover with holes is axisymmetric with respect to center line, 1/4 part o f that was only modeled. Applied loads were 17 MPa of the internal pressure and 26650 kgf of the weights of 41 CEDM (Control Element Drive
Mechanism). This analysis result was shown in Fig. 7.
2) Analysis Results
Analysis results of IDEAS code represented the maximum principal stress (Max. crl) as 143 MPa and the maximum
shear stress (r,,,ax) as 80 MPa. The distribution of maximum shear stresses was shown in Fig. 6. The weights of 41 CEDM did not affect the distribution of stress. The distribution of maximum principal stresses and maximum shear stresses were shown in Fig.7 and Fig. 8, respectively.
R E V I E W O F
2-D AND 3-D
A N A L Y S I S R E S U L T S2-D Axisymmetric Model
The highest membrane stress
(Pro
= 86.057 MPa) represented along the cut 3 section and this value was below the allowable stress intensity of the austenitic stainless steel A240 (Sin = 138 MPa). The highest a membrane stress plus a bendingstress (Pro + Pb = 183.807 MPa) represented along the cut 1 section and this value was below the allowable stress intensity of
the austenitic stainless steel A240 (1.5 S,,, = 207 MPa). Therefore, the stainless steel central cover analyzed meets the requirements of ASME code in design condition.
3-D Analysis Model
1) Analysis model of 3-D equivalent solid plate
The location of the highest principal stress in the central cover was the face contacting with the segment gate. Therefore, the high tensile steel should be used as the materials of the segment gate. Since the maximum principal stress of 2-D axisymmetric model was higher than that of 3-D equivalent solid plate model, the analysis results of 2-D axisymmetric model is more conservative. Comparing the shear stresses o f 2-D axisymmetric model (Fig. 4) with those of 3-D equivalent solid plate model (Fig. 6), those levels and the distribution of stresses were almost same. Therefore, the analysis results of 2-D axisymmetric model were more conservative.
2) 3-D real plate model
The maximum principal stresses and shear stresses of this model represented near holes and the distribution of these were very local. Also, since all values were below the yield stress of the austenitic stainless steel A204, the central cover in structural view is safe. Since the stress levels of 3-D real plate model and 3-D equivalent solid plate model were almost same, 2-D axisymmetric model and 3-D equivalent solid plate model were suitable for the estimation of the structural integrity in comparing with 3-D real plate model.
O P T I M A L D E S I G N O F R E A C T O R C O V E R
Analysis Model and Analysis Method for Optimal Design
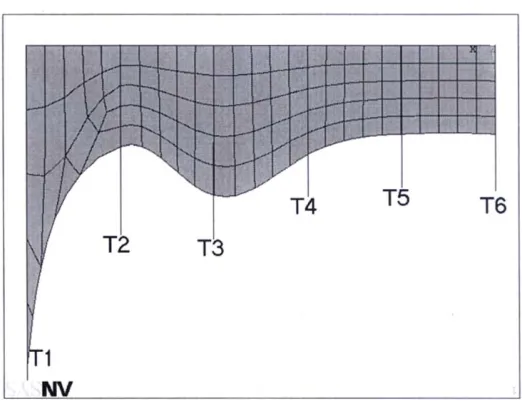
The radius of a reactor cover (a central cover and an annulus cover) is 1850 mm and thickness is 350 mm. The initial shape for the optimization is shown in Fig. 9. Also, the reactor cover was modeled using 2-D axisymmetric solid element and the equivalent solid plate (E* =108179 MPa, v* = 0.29). The optimal works were performed by ANSYS Code. Applied load was 17 MPa of the internal pressure and the model was divided into 5 sections. The design variable for the optimization is the thickness of the model and the initial thickness ofthis model is 350 mm, that is, T1 = 350, T2 = 350, T3 = 350, T4 = 350, T5 = 350. When the principal stress was selected as the state variable for the optimization, the value is restricted within 170 MPa and the maximum displacement is restricted within 3.5 mm. Also, when the stress intensity was selected as the state variable for the optimization, that value is restricted within 200 MPa and the maximum displacement is restricted within 3.5 mm. The objective function is the volume of the reactor cover, which is minimized for the optimization.
Analysis Results
Case (1) : The result of the case restricted within the principal stress: 170 MPa and maximum displacement: 3.5 mm (Fig. 10) Case (2) : The result of the case restricted within the stress intensity: 200 MPa and maximum displacement: 3.5 ram. The result values for the design variable minimized the volume of the reactor cover were as follows.
Table 3. Results of Optimal Design for Reactor Cover
Design Variable C a s e ( 1 ) ( m m ) C a s e ( 2 ) ( m m )
T1 919.42 919.18
T2 436.41 477.60
T3 436.90 392.63
T4 515.66 457.84
T5 435.07 350.00
T6 350.00 350.00
C O N C L U S I O N S
l) The analysis results of the stainless central cover met ASME Code, Section Ill, NB3221 design condition. Therefore, the structural integrity of that was verified in the preliminary design. The weights of 41 CEDM in 3-D real plate model did not almost affect the stress distribution of the central cover. 2-D axisymmetric model and 3-D equivalent solid plate model were suitable models for the estimation of the structural integrity in comparing with 3-D real plate model.
2) The shape to minimize the volume of the reactor cover was obtained using ANSYS Code and that will be reflected in the detail design.
A C K N O W L E D G E M E N T
This project has been carried out under the Nuclear R & D program by MOST.
REFERENCES
2. ANSYS, Swanson Analysis System Inc., Multi-purpose Finite Element Commercial Code, Rev.5.4 3. ASME Code, Section III, Division 1, Subsection NB, Class 1 Components, 1995.
4. K.S.Kim, K.H.Jeong, G.M.Lee, K.B.Park, "Integrity Evaluation of SMART Central Cover", Proc. of
Korean Society Autumn Meeting, Section 10, Seoul Korea, October 1999.
5. KAERI/TR-1173/98, "Preliminary Stress Analysis for SMART Central Cover", November, 1998.
6. KAERI/RR-1888/98, "Development of Advanced Reactor Technology", March, 1999.
7. ASME Code, Section III Appendices, Table I-1.2, 1995. 8. ASME Code, Section III, Divisionl-Appendicies, 1995.
C E D M ~ CENTRAL COVER
ANNULUS
COVER ~ GATESEGMENT
" !' ' ' III
t r f l i l ~ l I ; ; i I I I I//Ill/P4 R E A C T O R ESSEL
Fig. 1 SMART Reactor Assembly Fig. 2 Central Cover
.-~
i " -. .,
i . 7. ~ i
L i it~ .... , r .... ~.:::i .. . . i_t-: ".. ~_ " i ! - F T i '
' 7~-'-~ ~'-~ '-'. :: t: ~ - " - , _ L i ] i i-~ ...
- L ii% i/': ~.-' '- .~ - :- '-,-[' ",:_ -'. -::- ~7 ! ~i ~,
_'_ . ' i ; - = . . . - . - : - " , ' _ , ~ - ~ ~
i~, 7', ':. " , :7:~,-', %~'t'>'- i[
:_f." +
c u t ~ 3
Fig. 3 2-D Axisymmetric Model
< t
Fig. 4
_= =~,R- :
. 2 ,. t--,; q .... ! W
S
. . . ~}:: ... ii ~
i~iiT,,
Distribution of Max. Shear Stress (2-D)
\ . /
\
: -:z~
. . . c~
_ _ " ~ : . . . .
Fig. 5 3-D Equivalent Solid Plate Model Fig. 6 Distribution of Max. Shear Stress (3-D Equivalent Solid Plate Model)
[ :-: !
l~iiI~iil~Ji
iil~ii~ij~i~iil~iit~ii!:.iI~iiiil~ii[®iit~iil~iil~iii~ilii®iiI
li~ii
I
liiiiiiiiiii!iiiiiiiiiiiii
I!ii ii Iiiiiiii!iii~ ii ill iliii I!ii iliiiii~ !i iiiiiIii iiiiiii liiiiiiii:i!iI iii HliiilIii1!11111!!~!ill
If i'i iiIiiiiiiBi Iii iiiii~iiiiiiii liiiiliii!iI iiiiiii tiiiiiiiliiiiiiiiiiiI i I
l!iiiiiiiiliiiiii iiiiiliiii!
iiiiiiiiii~iii
iiiiiii iIiiiiiiiiiii
iiliiiiiiiiii
i~i!iiiiii~i!i!ii!!i~Iiiiii~i1iiiiiiiii~iiii~iiiii~i~iiiiiiiiiiii1iiiiiiiiiiiiiiIiiiiiiiii
iiii iiIiiiiii@iil i!ili H~iiiiiiiiiIiiiiiiiiii~iiii!iiiiiil
ii ii Iii ii iIi iii!i~!i!iiiliiil.iiiiiii
I
I~i!
ii
iiii
[~ii~ii
I~ii~iilii
t
Fig. 9 Initial Shape of Reactor Cover
T6
~
T2
T1
S ~k ii ~ a v
Fig. l 0 Result of Optimization (Case 1)