Copyright 8 1988 by the Genetics Society of America
Evolution of the Autosomal Chorion Locus in Drosophila.
I. General Organization of the Locus and Sequence Comparisons of
Genes
s15
and
s19
in Evolutionarily Distant Species
Juan Carlos Martinez-Cruzado,* Candace Swimmer,* Maryanne
G. Fenerjian”
and Fotis C. Kafatos**+
*Department of Cellular and Developmental Biology, Haruard University, Cambridge, Massachusetts 02138, and frnstitute of Molecular Biology and Biotechnology, Research Center of Crete and Department of Biology, University of Crete,
Heraklion, 71 1 10 Crete, Greece Manuscript received January 20, 1988
Accepted March 28, 1988
ABSTRACT
We have isolated clones corresponding to the autosomal chorion locus of Drosophila melanogaster, from two distantly (D. viri1i.s and D. p’mshawi) and one closely ( D . subobscura) related species. In all the species the locus is unique within the genome and encompasses the same four chorion genes and an adjacent nonchorion gene, in the same order. In all species the locus specifically amplifies in the ovary, as in D. melanogaster. We present the nucleotide sequences of DNA segments that total 8.3 kb in length and include gene s15-1 from D. subobscura, D. uirilis, and D. grimshawi as well as gene s19-1 from D. subobscura and D. p’mshawi. They show clearly nonuniform rates of divergence, both within and outside the limits of the genes. Highlighted by a background of extensive sequence divergence elsewhere in the extragenic region, highly conserved elements are observed in the 5’ flanking DNA and might represent regulatory elements.
I
N recent years, recombinant DNA methods and rapid techniques for DNA sequence analysis have greatly facilitated the study of molecular evolution. Conversely, they have helped integrate the evolu- tionary perspective in the study of eukaryotic gene structure and regulation, supporting T. DOBZHAN-SKY’S dictum “nothing in biology makes sense except
in the light of evolution.”
Our laboratory has been interested in the structure and developmental regulation of a small family of genes that are specifically amplified and expressed with temporal precision in the ovarian follicles of Drosophila melanogaster, to form the chorion or egg- shell (reviewed in KAFATOS et al. 1987). Oogenesis
has been divided by KING (1970) into 14 stages, using morphological criteria. During stages 8 to 14, the proteins of the vitelline membrane and the several chorionic layers are deposited in succession by the approximately 1000 polyploid follicular epithelial cells that surround each oocyte (MARGARITIS, KAFA-
TOS and PETRI 1980). Choriogenesis occupies the last
5 h r of this period (stages 11 to 14; DAVID and MERLE
1968).
Although a number of major and minor chorion protein components have been identified (PETRI,
WYMAN and KAFATOS 1976; WARING and MAHOWALD
1979; MARGARITIS, KAFATOS and PETRI 1980), atten- tion has largely focused on the most abundant ones, which are encoded by six single-copy genes. These genes do not detectably cross-hybridize, but at least
Genetics 119: 663-677 Uuly, 1988).
three appear to be distantly homologous at the se- quence level (WONG et al. 1985; LEVINE and SPRADLING
1985). Two chorion gene clusters have been identi- fied. Genes coding for the “early” s36 and d 8 proteins (as well as some minor chorion components) are
clustered on the X chromosome (PARKS, WAKIMOTO and SPRADLING 1986), in the region of band 7F1. T h e genes that produce the s15, s16, s18 and s19 proteins, at various overlapping “late” periods (pri- marily stages 13 and 14), are found on the third
chromosome at 66D 12- 15 (SPRADLING 198 1 ; GRIFFIN-
SHEA, THIREOS and KAFATOS 1982).
T h e quantitative demands of choriogenesis are extremely high in D. melanogaster: choriogenesis is completed in 5 hr, with the period of synthesis of any one protein substantially shorter, and the major genes are present in a single copy per genome. These demands are met by specific gene amplification at both major chorion loci, beginning several hours before choriogenesis, at stage 8 or 9 (SPRADLING and
MAHOWALD 1980; SPRADLING 198 1 ; ORR, KOMITO-
POULOU and KAFATOS 1984). T h e entire cluster of
genes in each major locus amplifies as a unit, with amplification probably beginning from a single origin and extending in either direction for 40-50 kb (SPRAD-
LING 198 1 ; OSHEIM and MILLER 1983). Amplification is biologically important, since mutations that inter- fere with it, either in cis (SPRADLING and MAHOWALD
1981) or in trans (ORR, KOMITOPOULOU and KAFATOS
664 J. C. Martinez-Cruzado et al. lead to production of insufficient protein, disruption
of chorion structure, and female sterility.
We have begun a detailed study on the structure, amplification and developmental expression of the autosomal chorion locus in four selected Drosophila species, representative of the diversity of the genus. The genes of that locus are named s15-1, s16-1,
s18-1 and s19-1 ( s l 6 ,
. .
s l 9 for convenience). Twoof the species studied belong to the subgenus Sopho- phora: D. melanogaster and D. subobscura, representing the melanogaster and obscura species groups, respec- tively. The other two species belong to the subgenus Drosophila: D. virilis and D. gnmshawi, representing the virilislrepleta radiation and the Hawaiian group of picture-winged drosophilids, respectively. Despite the lack of fossil evidence, reasonable estimates of divergence times between the two subgenera are 50- 80 million years, and between the species groups of the same subgenus approximately 20-50 million years (THROCKMORTON 1975; BEVERLEY and WILSON
1984). Thus, the four species of our sample represent at least two time points spanning a wide evolutionary period.
In the present report, we describe the isolation and preliminary characterization of the autosomal cho- rion locus in the selected species. The locus encom- passes the same four chorion genes, which are simi- larly organized, and similarly amplified and regulated in the various species. We also report and compare in detail the sequences of genes s15 and s19 and surrounding DNA, which diversify during evolution at nonuniform rates. The genes themselves show a rather high degree of sequence divergence, while short DNA elements are highly conserved in the proximal 5' flanking DNA and the 5' region of the genes. Considering the apparent conservation of chorion regulatory mechanisms, we suggest that these elements are good candidates for playing a role in the cis-regulation of the chorion genes.
MATERIALS AND METHODS
Isolation of clones: Genomic libraries were the kind gifts of M. KAMBYSELLIS, New York University (D. p h s h a w i ) , P. O'FARRELL, UCSF (D. uirilis) and M. A G U A D ~ , University of Barcelona (D. subobscura). A second D. virilis genomic library was constructed in collaboration with R. BLACKMAN at Harvard University. The libraries were screened with D.
melanogaster probes using standard procedures (MANIATIS, FRITSCH and SAMBROOK 1982; CHURCH and GILBERT 1984). For historical reasons, various conditions were used, all at reduced stringencies: D. grimhawi Tm-40" [0.6 M NaC1, 40 mM Tris (pH 7.5), 4 mM Na2-EDTA, 55'1, D. virilis Tm-43" [7% SDS, 0.5 M NaH2P04 (pH 7.2), 1 mM Na2-EDTA, 1% bovine serum albumin, 55'1, D. subobscura Tm-42' (0.9 M NaCl, 50 mM NaH2P04 5 mM Na2-EDTA, 0.1% SDS, 5 X Denhardt's solution, 100 pg/ml salmon testes DNA, 60"). The D. uirilis library was screened with a mixture of all four autosomal chorion genes, the D. grimhawi library was screened with each of the four probes separately, and the
D. subobscura library was screened with an s18 probe. The probes were cDNA clones for two of the genes (s15 and s 1 8 ) or purified fragments from genomic subclones encom- passing s19 and s16. Positive phage were purified, restric- tion mapped, and subcloned using established methods (MANIATIS, FRITSCH and SAMBROOK 1982).
Sequence analysis and alignments: Restriction frag- ments from D. subobscura and D. uirilis were cloned into M13mp18 and M13mp19. Deletions were generated using the method of DALE, MCCLURE and HOUCHINS (1985) and sequenced using the chain termination procedure (SANGER, NICKLEN and COUL~ON 1977) with [35S]thio-ATP and up to 120 cm gradient gels (BIGGEN, GIBSON and HONG 1983). Each strand was sequenced at least three times. D. p ' m h a w i
restriction fragments were subcloned into pSDL12 or 13 (LEVINSON, SILVER and SEED 1984), deletions were generated using DNase I (LAUGHON and SCOTT 1984), and the inserts were sequenced as above. The resulting data were analyzed using computer programs (STADEN 1982, 1984; PUSTELL and KAFATOS 1982, 1984).
The detailed sequence alignments of Figure 7 were begun by identifying by computer perfect matches of 2 5 nucleotides in all known species. Matches found in the same order were boxed and served as "anchors" for aligning the rest of the sequence according to empirical rules. Secondary anchor points were established in ranked order: four-species matches of four nucleotides, followed by four- way matches of three nucleotides or three-way matches of 2 5 nucleotides and, last, three-way matches of four nu- cleotides. Between anchor points the locally longest se- quence was used as initial reference, while the other se- quences were attached to either anchor point. Spaces corresponding to insertioddeletions were then inserted for final alignment, subject to the following restrictions. For each insertioddeletion it was necessary to gain a four- way match of at least two nucleotides unless the match was within one base pair of a box, or one of the following minimal matches could be established: a three-way match of two nucleotides, a two-way match of three nucleotides, a two-way match of four out of five nucleotides, or a three- way match of three out of four nucleotides. Options found to be equivalent were reviewed on a case by case basis, and decided arbitrarily. These rules gave unambiguous align- ments in moderately conserved regions. In highly divergent regions the alignments do not necessarily reflect homolo- gies, but at least are consistent and permit comparison to the highly conserved elements.
Amplification analysis: Genomic DNA was prepared from male flies or hand-dissected ovaries as described (GRIFFIN-SHEA, THIREOS and KAFATOS 1982), or with an added CsCl purification step (D. p ' m h a w i male DNA) or from purified nuclei (D. grimhawi ovaries). Prior to dissec- tion, D. subobscura and D. virilis were conditioned by growing at 25" for 2-5 days with daily transfer to fresh medium; D. grimshawi were grown at 17" for 14 days on high yeast WHEELER-CLAYTON (1965) medium. The DNA was re- stricted with EcoRI, electrophoresed in Tris-borate agarose gels and transferred to positively charged nylon membrane (Bio-Rad Zetaprobe) by the alkaline method (REED and MANN 1985). The filters were hybridized (CHURCH and GILBERT 1984) with probes labeled by nick translation (RIGBY et al. 1977). D. melanogaster and D. uirilis were probed with D. melanogaster restriction fragments corresponding to
Evolution of Chorion Locus 665
P Xb H B H BI BU Xb Xh H Xh H B l P E S B B I E P P P PX3
E
D. rnehnogosfer
9
.
r>
I I l lc_?
I 1-
NC-ORF-
" - I - I I 2 , I- - -
- - -
"P H H Xh P H X b m E B I B I a x 3 BI E H S P BI M Bn
D.wbobscuro I !
'
I l-d1 I I I I I I* "
-3
I
')
bE6-3
'T)
m P
m p E H H E H E P 811
D. v M s ' I I I l l I I I
'r"...A
cf"RT"-
L -ria - - -
P m m P BUX2 P P E
D. grhshowi I
e
c_
"I "I"I- - - --
___________
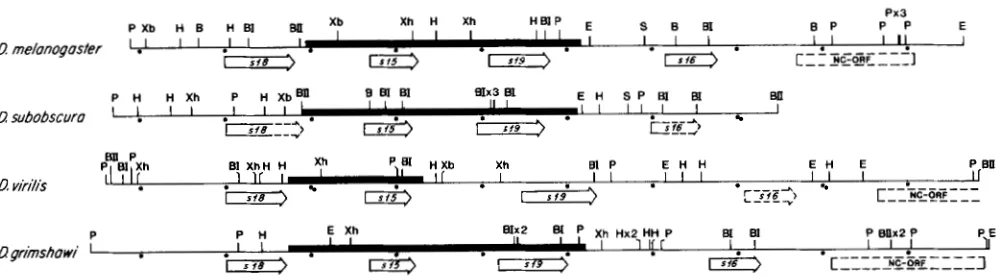
NC-ORF 3FIGURE 1.-General organization of the autosomal chorion locus in four Drosophila species. Restriction maps of cloned segments were generated by standard procedures; many sites were confirmed by sequence analysis (B = BamHI, BI = BglI, BII = BglII, E = EcoRI, H
= HindIII, S = SalI, Xh = XhoI, Xb = XbaI). Chorion genes and their transcriptional orientations are indicated by arrows: locations are shown in solid lines if established by sequence analysis, and by dashed lines if based on cross-hybridization to D. melanogaster probes. The D. virilis s26 gene was localized by hybridization of restriction fragments to ovarian RNA. The homologs of the boxed D. melanogaster NC- ORF (nonchorion open reading frame) were approximately localized by cross-hybridization; in D. subobscura the NC-ORF is not shown, but is located in a clone adjacent and to the right of the region presented here. Maps were aligned at the 5' end of the s28 gene, and distances are indicated by dots in 1 kb intervals. Sequences reported in Figure 4 or used for alignment (Figures 5-7) are indicated by thick lines.
clone corresponding to the Adh locus (SCHAEFFER, AQUADRO and ANDERSON 1987). D. p'mshuwi was probed with hom- ospecific probes: a clone of the chorion locus containing the s18 and s15 genes and a clone corresponding to an unidentified single copy DNA fragment. If probes were homospecific, hybridizations were carried out at 68", other- wise the temperature was reduced to 60".
In situ hybridization: Larval salivary gland squashes were prepared via standard procedure
(J.
K. LIM, unpublished, as modified by ENGELS et al. 1986). Homospecific probes (a 7.8-kb EcoRI fragment containing the D. grimshawi s15, s19 and s16 genes along with the NC-ORF, and a 2.6-kb PstI fragment in pUC18 containing the D. virilis s19 gene and part of the s15 gene) were labeled with biotin-I 1-dUTP (BRL, Bethesda Research Laboratories) using the BRL Nick-Translation Kit at 15" for 1 hr. Hybridization was carried out overnight at 37", with 45% deionized form- amide, 6.5% dextran sulfate, 4.25 X SSC, 0.67 mg/ml yeast tRNA, and 1.37 mg/ml sonicated salmon sperm DNA. Washes were performed in 2X SSC at 37" and at room temperature. Detection of the probe was carried out with alkaline phosphatase as per ENGELS et al. (1986), with modi- fications by R. JONES, Harvard University (unpublished data) using the BRL Bluegene Kit. For D. subobscura, the squashes were hybridized with a nick-translated probe encompassing the homospecific s15 and SI 9 genes.RESULTS
Recovery
and
preliminary characterization of theautosomal chorion gene cluster in three Drosophila
species: Genomic libraries of
D.
subobscura,D.
virilisand
D.
grimshawi in A vectors were screened underpermissive criteria for sequences homologous to the third chromosome chorion gene cluster of D . melan-
ogaster (see MATERIALS AND METHODS). After recovery
of the cross-hybridizing clones, DNA preparations were subjected to preliminary restriction analysis, to eliminate duplicates and to detect possibly overlap- ping clones that might define a contiguous chromo- somal region. After appropriate clones were thus
selected, their nature was verified by Southern anal- ysis using probes derived from
D.
melanogaster. Plas- mid subclones were constructed and restriction mapped by standard methods, and individual genes were positioned on the maps by additional Southern and Northern analysis (Figure 1).I n each of the species, the clones defined a locus consisting of four chorion genes and an adjacent highly conserved nonchorion gene. T h e latter pro- duces multiple transcripts in adult flies of both sexes, but was not otherwise characterized; hereafter it will be referred to as NC-ORF (nonchorion open reading frame). The nature of the chorion genes was deter- mined as follows:
1. All four genes produce ovarian-specific tran- scripts, during choriogenic stages. Their detailed temporal specificities are similar to those of the respective putative homologs in
D.
melanogaster (data not shown). Putatively homologous transcripts are also of similar size in all species, with transcripts of s18 and s19 slightly larger than those of genes s15 and s16.2. Cross-hybridizations with fragments from
D.
melanogaster permit identification of chorion genes
s18 and s19 in all other species. Although the se- quence divergence is greater for s15 than for the other genes, cross-hybridization is still detectable: moderate for
D.
subobscura and weak for D. p'mshawiand
D.
virilis. The s16 homolog has also been iden- tified by cross-hybridization inD.
subobscura andD.
grimshawi. I n
D.
virilis an sl6-size transcript is encoded at approximately the position indicated in Figure 1. Exact localization of that gene and confirmation of its nature as s l 6 remain to be established by sequenc- ing.666 J. C . Martinez-Cruzado et al.
FIGURE 2.-Chromosomal localization of the autosomal chorion locus. Chromosomal squashes were hybridized with homospecific chorion probes, as described in MATERIALS ASD METHODS: biotinylated (Dg = D. grimhuwi and Dv = D. uin'lis or tritiated (Ds = D. subobscuru). Arrows indicate the unique chorion locus in each chromosomal complement, T marks the telomere (beyond the top edge of
the picture in Ds), and arrowheads label landmarks of each chromosome: the distal breakpoints of the chromosome 5 a and d inversions in Dg (CARSOS and STALKER 1968). the prominent 24A puff of chromosomej in Ds (MOLT(), DEFRUTOS and MART~SEZ-SEBASTIAS 1987), the weak point at 3 1 F and the characteristic thickening in 39D of chromosome 3 in Dv (GUBESKO and EVGES'EV 1984).
the identities and orientations of all the genes have comparative picture of the locus has emerged (Figure been established unambiguously by sequence analy- 1).
sis. Definitive sequences of genes s15 and s19 are In
D.
melanogmter, the autosomal chorion cluster presented below; finalized sequences of the remain- contains the four chorion genes in tandem orienta- ing genes will be presented elsewhere. tion, in the 5' to 3' order s18, s15, s19 and s16. TheseEvolution of Chorion Locus 667
of s18 to the end of s l 6 (WOSG et al. 1985; D. KING,
personal communication). T h e corresponding genes are also clustered in a remarkably similar manner in the other species: the genes are found in the same order, with approximately the same spacing, and in the same tandem orientation, within approximately 5.5 and 6.3 kb in D . subobscura and D . grimshawi,
respectively. T h e unidentified NC-ORF gene is lo- cated downstream of s16 in all species.
Genomic blot hybridizations suggested that in all species the chorion genes are single-copy. This was confirmed for
D.
grimshawi by reconstruction South- ern analyses comparing known amounts of plasmid and genomic DNA (data not shown). Furthermore,in situ hybridizations to squashes of salivary gland chromosomes showed
that,
in
each species, only
asingle chromosomal locus detectably hybridizes with DNA from these genes (Figure 2). Most interestingly, in every case the locus is found in homologous chromosomal arms, corresponding to the ancestral chromosomal element
D
(MCLLER 1940; LOUKAS andKAFATOS 1986): in 3L of D . melanogaster, in chromo-
someJ of D . subobscura (at 26A), in chromosome 3 of
D.
virilis (at 34D-E) and in chromosome 5 ofD.
grimshawi (approximately halfway between the distal breakpoints of inversions a and d).In summary, during an evolutionary span of 50- 80 million years, the autosomal chorion cluster has remained intact and within the same chromosomal arm of Drosophila.
Autosomal chorion genes are amplified in four
Drosophila species: In D. melanogaster the chorion locus differentially amplifies in the ovarian follicle cells during late oogenesis (SPRADLING and MAHOW-
ALD 1980; SPRADLING 1981; ORR, KOMITOPOULOU and
KAFATOS 1984). Figure 3 demonstrates that ovarian-
specific amplification of the chorion genes occurs in the other three species as well. High molecular weight DNA was prepared from either male flies or total ovaries from all four species. T h e DNA was digested with EcoRI, transferred to a nylon membrane, and blot-hybridized with mixed probes corresponding to a single copy control gene as well as the chorion locus. Autoradiography revealed that in every species the band that corresponds to the chorion locus is substantially enriched in ovarian DNA, relative to the control gene (Figure 3). Thus, it appears that chorion gene amplification is an ancient feature in the genus
Drosophila, and that its ovarian specificity has re- mained unchanged throughout the evolution of the genus.
Sequence analysis of genes s15 and s19: As a first step in the detailed characterization of evolution in this locus, we have sequenced the region encompass- ing genes s15 and s19 in
D.
subobscura andD.
grim-shawi, and s15 in D . virilis (3.2, 3.5 and 1.6 kb, respectively). The nature of the sequenced genes was
Dm
Ds
Dv
D g
d
ov
d
ov
d ov
d
ov
rye-
I
1
c h e -
, ’(see-
-
v
:
+
rye-
c h e C d
!
Adhe“
c h * H
FIGURE 3.-Amplification of the autosomal chorion locus in four Drosophila species. High molecular weight DNA was isolated from males ( 6 ) or ovaries (OV) from D. melanogaster (Dm), D. s~606scura (Ds), D. uin‘lir (Dv) or D. gn’mshawi (Dg). DNA was digested with EcoRI and blot hybridized as described in the text. Male DNA lanes received at least twice as much DNA as ovary lanes. In addition to chorion (ch), the hybridizations used probes for detecting single-copy unamplified sequences: YO? (ry), alcohol dehydrogenase (Adh), and an unidentified single copy DNA fragment ( x ) .
established unambiguously by comparison with the complete sequence of the D . melanogaster locus (LEV-
I N E and SPRADLINC 1985; WONG et al. 1985; D. KING,
personal communication). T h e s15 and s l 9 sequences are presented in Figure 4, together with the land- marks of each gene and its conceptual translation into protein. In all species, including D . melanogaster, each gene is interrupted by a single short intron (68 to 99 bp) within the signal peptide encoding region, and shows short untranslated regions at the two ends,
5‘ (44-70 bp) and 3‘ (70-102 bp through the poly- adenylation signal). T h e coding regions are compa- rable in length in all species (102 to 12 1 codons for
s15; 173-196 for s 1 9 ) .
Interspecies sequence comparisons: Initial inter- species comparisons at the nucleotide level were performed by the matrix plotting method of PUSTELL
and KAFATOS (1982, 1984). Figure 5 shows typical
results. In such matrices, prominent diagonals indi- cate homology, and small lateral displacements in the diagonals correspond to insertions or deletions. Re- peats appear as additional off-diagonal matches; in chorion, many of these correspond to simple peptides which are repeated both within and between genes (WONC et al. 1985). Figure 5 includes “low magnifi- cation” matrices that compare the entire sequenced region in relatively closely related (Figure 5a; D .
melanogaster vs.
D.
subobscura) and relatively distant species (Figure 5b;D.
melanogaster vs.D.
grimhawi).668 J. C. Martinez-Cruzado et al.
D g//inshaw/'
2709 CCA ATE AAT GTT GGA CTC CGT CGT GTC TCC AGC ATT GGA CAG CAG TCC GGT GAT GGT GCC GCT GCT PRO I L E ASH VAL GLY LEU ARG ARC VAL S I R SER I L E GLY GLN GLN SER GLY ASP GLY ALA ALA ALA1
AAGCAATGM ACATCAAMC TTCMCAACT TTTTGTCATT TTTTGGGTCT TTGCMATTG CTGMGAACT TTCAGCTTCG GCT TCG GCT GCT GCT TCC GGT GGC GAC AAT GGC CCC GTT GAG ATC ATT GCT GGT GGT GCT CCC CGT
2175
ALA SER ALA ALA ALA SER GLY GLY ASP ASN GLY PRO VAL GLU I L E E L I ALA GLY GLY ALA PRO ARG
111
"
TGATTTTGTA TGGCTGAACA AGCTGCATGC A M G M T G A T ATTTATGGCT TGTGGGCAAA CTGTCAAGAG A C G C T T M A T 2811
TAT GGC TCC AGC CAG M T CTG CGC CCA ATC CTC CTA AAC TC? GGT T I C CAT GGC GGA CTC AAT GAC
TAATGTTGTC ATAATTTGTA GAAGTATTGC MAGAGCTTT TTAAAGACTT GTAGTTTTTA GTTTGTTCAT TTCTATATAT
161 TYR GLY SER SER GLN ASN LEU ARC PRO I L E LEU LEU ASN SER GLY TYR H I S GLY GLY LEU ASN ASP
290J
AGICMACTG TGAACTTCM ATAAATATAC MCAACCTTT GTCMCTMT AGTAAATCGA TATTGCTITT GMGTATTGA ASH ILE GLY ARC ILE ALA GLN ILE VAL GLY GLY GLY ARC SER LEU GLY GLY HIS LEU GLY GLY H I S
241 AAC ATC GGC CGC ATC GCA CAA ATT GTC GGC GGT CGC AGG TCC CTT GGT GGA CAC CTT GGT GGA CAT
ATTTGMTCC AAGTCGAATC TATCGATAAT GTATCTTAGT TATTTTGATT AAGTGCTGGT CGTCCTGTAC GCTCATGAAT CTT GGT GGA CAC CTT GGT CGA CGC ATT GGT GGA AAC TAT GGT GGC CGT TAT ATT CGT CCC CGT TTT
121 2913
LEU GLY GLY H I S LEU GLY GLY ARC I L E GLY GLY ASN TYR GLY GLY ARG TYR I L E ARC PRO ARC PHE
401
TTATTTGAAG CATATTCGGT CTCAMAATG CACTGGCAAC AGCTCCATTT GTGACTGCTC GATTGAGTGT TACTCGTTGG 3039 481
AATGTGAGTA TAATTTCAAG TCCAAGAATT CCAMTACAT TGCAATAAAT TGGGGCTACA AATGGCGTGT GTTTCGTTTC
561
1105
CCC GTC GAG T I C TCG AAG GTG ATT CTG CCC GTC CGT GCT GCT GCT CCA GTT GCC AAG CTG TAT I T A GCGGATTCAT TGAGAACTCA CGAAGTGCTC GTICTTATTA TTATTATATT ATTTTTATAT ATATTTTTTG TTGTGTTTAG PRO VAL GLU TYR SER LYS VAL I L E LEU PRO VAL ARG ALA ALA ALA PRO VAL ALA LY.5 LEU TYR I L E
641
TATGTGTCGA ACCCAAGTCG AGGGGCGGGT TTTGGCCTGG ACATTATCAG TGGCCAGMA CAACGAAACA TCGCGTAACC CCC CAG AAC AAC TAT GGC AGC C I A GTT GGC T I C T M AMGTA CCCTTTGAGT ACTTTGCTCT CTCCCAATCT
7 7 ,
ACT GTC CAG CCT GCT GGC GCC ACT CTC CTG TAT CCA GGC CAG AAC AGC TAT CGT CGC ATT TCG TCG THR VAL GLN PRO ALA GLY ALA THR LEU LEU TYR PRO GLY GLN ASN SER TYR ARG ARC I L E SER SER
ill1
PRO GLN ASN ASN TYR GLY SER GLN VAL GLY TYR -"
CAGCGATTTT ATAATTGCTC GAGACACAAC AACAAMCTA CMCTGCGAG TACATMTAA CMGTTTCTC TTATGTACTT
8-31
. "
CTGAAAACAA TAACATGGAA GAGTTCGTTG TGCAAACAGC GCCAATAAAA TTTTGAAAAC AAAAAGAAAA CAAAACAAAA
3243
-
-
GGCAATTATG AAATATATCA CTGACATAGA M T T A M C A A CATGGTAAAT ACATAGATGT ACACAGGTAT GTATATATAT 3323
TATTGTATTG ATATTAAGAG GCTTTGGTGG GTTTAGATAA GTGGTTCCGG CCACCGCCAG TTGTTGTTCG TCAATGTTTG
881
ATACACMAT
P K 1
AIACATATTA ATATATGGAG G G E MGTATCCCGTC TAATTTTGCA r a r * u A G C G AACGTTGCTG
-
r)
GCTGTTGTCG GTTGTCTGTG TTGGCAGCTG CAGCTGCTTT GTTTTGATTG CAACTCGATG TGGTTGGCAA TGCAGAGCGT
1403
."
GCAAGTAAAT CATAGTTTGA TTGATTACCA CAACCAACM AACTAAATAT TCAAC ATG AAG TTC CTG GTAAGTAATC
1038
D
v/>i/.s
MET LYS PHE LEU
CTGGCACTAT TCACTGCTTG ACAGGCATAC TAATCCTGTG GGTTTTTATT TTGTTACTTG CAG ATT GCT TTT GTC
"
I L E ALA PRE VAL 1
I l l 3 ACCAACAAAA CTATAAAAAC ATAAACAATT TTTTGTCATT TTCTCTTTGG GTTTTTTTGG AGTCCTACGA AAAAGTTGIIL GCC ATC GCC TTC TTC GCC TGC GTT AGC GCT GGT GGA TAT GGC AAC ATT GGT CTG GGT GGT TAT GGA
ALA I L K ALA PHE PHE ALA CYS VAL SER ALA GLY GLY TYR GLY ASN I L E GLY LEU GLY GLY TYR GLY 81
11J9
CTG GGT AAT GTT GGC T I C C T T CAG AAC CAT CGC CGT GGC TAT GGA CGC AGA CCT AT7 CTG ATC TCC 161
LEU GLY ASN VAL GLY TYR LEU GLN ASN H I S GLY GLY GLY TYR GLY ARC ARG PRO ILE LEU ILE SER TATAATTTCT TTTlTATTGG ACTATTCCAC AATATGCTTA TATTCTGTAG ATAGCTTACA TtiATTTGACT TTGATCIRTC
1215
AAG TCT TCG AAC CCC AGT GCT GCT GCT GCC GCC GCT GCT GCC TCC TCT GGT GTC UT TCC GGT CTA AATGAATGCA TTTTAGCATA AAAZTTTCAT AGGGAAATTA TGCLCGTAGA GTCTATTTTC TTCTGTATAT TTATGCTAIA LYS SER SER ASH PRO SER ALA ALA ALA ALA ALA ALA ALA ALA SER SER GLY VAL ASN SER GLY LEU
1311
321
AACATATTCC ATAAGIAATT ATTTATGTTA AGTCTTTCTT CTTTCTATAT GTTTTCTTGT TCGCAAALTT C A T i I i T T T C T I C AAC CAG CGT GGC GTC ATC GGA T I C GAG CTT GAT GGT GGC ATC CTT GGT GGT CAC GGT TAT GGC
TYR ASN GLN ARG GLY VAL I L E GLY TYR GLU LEU ASP GLY GLY I L E LEU GLY GLY H I S GLY GLY TYR
TGTTCGTGTG AGTCTCGAGC AGGCCATGTT TACAGCTGCA AGTCCAGTTC ATGACTGG1.7 TTATTACATT TTAtiCfCTAb
401 13Jl
GLY GLY GLY LEU GLY TYR ---
GGC GGA GGT CTC GGC TAT TAA TTCA GCCACCTCCA ATTGAACGAA ATGACAATTT GTTCAATGGA CCAGCAACAG 481
CTMTGAAGA AMAGAAGCT GTTGCCAAAG CTGTGACTAA ATAAMACCG CTGAATGCCG CGGAGCATGT TGAACAAAM TCGTGGATTC ATTGAGAACT CACGAAGTGC TTAATTTGTT TTTCGCGCTG TGTGTCGALC TTGTtiTCGGA CTGGGTCGG6
1452
-
5611512
ATTCTACCTC TTGTCTTTTG TCTACTGGGC AGCTAGAAAA TGTGAcATAC TTTTGAGCGT GGGCCTTAAA TGGTCTGAGC CTTTTTGCCC TGGCATTATC AAAACTGTGA AAACAATGGA AAACATCGCG TAACCGAACG ATTTTATART T t i T T G W l i G
TGGAATTACC GGGTGCCTCC ATGTCAAGGA GTTGAGCTCG CATMAACTA TGCAGCTTTC AATTTGCAAA TAGATTATAA ACACGACAAC GAAATACGAG CCAAGTACAT AATATGTGGC CAATAATTGT TGTCTTITGT LCTGGTTAGA AWATGAAAI
1612 121
AGAATTGTTC ATAGCAGCAA ITTGAGAIGG ATAAGTTTTT AGGTACAAAG MCAATCAGT CAGGCTACAA TTCAGTGTCC ATCGCTGCCA TAGIZAATTAT TATTATATGG TATATAGtiTT ACTTAAAGTG TTTATTTGGb cAGTG-AAAIArcI'L
1692 801
TTCTTTGCAG CTGTTTAATT GAGTTCAATT AATGGCAAAG CATAATTCAG TTTTACTTTG ATATTITGGG TATATATAT1
2 4 1
GAACGTGCAA TTTGTGTGTG TACAAAAAAT AGTATAATAT ATTAATTTAA ACCTCGGGLT ACAAAIGACG CGCLCTC'OX
-
641
-
1112 8 8 1 - r-
TCTTTACTGG TCTTCACAAC M T T T G T T G A A G M C A C T T TAGAAGAGAT TGCTACMCG AGCTAGATGA AATcTAAATT GTCTATATTT TGCAT)ITIIAIGCGCTCGTT GCGGTCAGCT RAATCATAGT TTGATTGATT AACCTAACCA A,'AAAIICIbL
GGTTTCTGAG AAAGAAGCAT ACTATGATAG TTTTTAACAT AGCCTTTCAC AACAAATATA AMGTTAAAT AATATAAGCA CTGTTCAAC ATG AAG TTC CTG GTAAGC AATCCCTACA GCTGGACTTG GACATATGGA TGGCTGACTA ATCCTGTTTC
1852 9 6 1
1932
AACACAAATA GAAATAGCCT TAAGTTAMA AGTCTCTTGC CATTTCGTAG CGGGTCTAAA GACTGMGTC TGTTTAATTG 1018 2012
TTTTGAGAGA GAGAGAGAGA GIGAGAGTGC ATTGGGAGGC TGCTTCTTAT CCAGCTGCAT GCTCTCACGA AGCAGCAGCA
2092
MET LYS PHE LEU
CIAAAATCAT AC ATT GCC TTC GCT GTC cTC GCT CTG GTC GCC TGC ATC ART GCC AAT CCr TAT G G C
ILE ALA PHE A L A VAL L E U ALA LEU V A L A L A C Y S ILE A S N A L A ASN m n TYI G L Y
1104
AGC AAC CGT GGC TAT GAA GGT GGC CGT GTG GCC TAC GTT CAG GAG GTT GGT TAT Cc' bc': *bbl T'C CCGCCAGCTT CATTTAGTGG CACACATATT GGGAAGCAGT TCAACGAGAG ATGAACACCC CCAATCTGGG GTTCAAGTGT S E R ASN A R G GLY T Y R GLU GLY GLY ARG VAL ALA TYR VAL GLN GLU VAL GLY TYB GLY i L Y GLY JER
CGCCGATACG AGAGACGGTC GAACMGCTG CTCAGGCGAT ATGCAGGTGC GATTTCGACA GAGAAAAAAA CCAAGAAGAC TAC GGC AAC CAG GGC TAT GGC AAC C A T GGC TAT GGC AAC CGC LGC TAT K G CAG (CC ' . x TA" T.lG
2112 1170
TYR GLY ASN GLN GLY TYR GLY ASN H I S GLY TYR GLY ASN ARG GLY TYR ALA GLN PRO LLU TYR I C ? ? > 5 ,
."_
GAAGAAGAAG ATGATGATGA AGAAGAAGAA GAAGAAGAAG ATGAACTGAG GCTGAAACTG GGGCTGATGA ACGCCCACCA
2132
TCATCGCCGA GAAGMGAAA ATTMGCGGT GGTTAAGAAG CTCAAGCTGA AGCTCAGCGC CGTGITAAAT TCGCGGCGAG
CGC TCA TCG AAC CCC ACT GCC TCG GCT GCT GCG GCC GCT GCC TCG GCT GGC ATC CGC CPA ,GC AGG 1236
ARG SER SER ASN PRO SER ALA SER ALA ALA ALA ALA ALA ALA SER ALA GLY I L E ARC FR3 GLY l i k i 1 3 0 2
ATCACGTTTC GAGTGCTTCA AATATTTTTG CA-T GALGTGTTCT TGGCATTTGG TTTGTTAATT GTGCCAACTG TYR GLU GLN ALA ALA VAL I L E GLY TYR ASP LEU A s p ALA SER TYR ISN GLY H1s S E R liRC GLY G L Y TAC GAG CLG GCT GCA GTC ATC GGC TAC GAT CTG GAC GCT AGC T I C AAC GGC CAC AGC CGC GGT GL': 2
- r
-
2192TTCCAACCAG CGAGCGCCCC TCAMTAACT AAAAGCATAA cc ATG AAC ACA TTC GCC G T A A G T A ~ T C G TAT GGA CGT ~ ~ GGT GGC ~TAT TAA TTCA GCCACATCCA ATTGAGCCAA ~ ~ ~ ~TGACCTCATT GTTCAATCGA TCAGCTCIAG ~
1168
TYR GLY ARG GLY GLY TYR - - ~
MET ASN THR PAE ALA 2548
....
TGGCGCCMT TGGCACMTT TCCGTTTGCC GTCATTAACC ATCGATTTCC ACTCTCCATG CAG ACT CTT GCT ATC 1413
THR LEU ALA I L E l r l l
C A ~ ~ ~ A ~ T ~ T T G A G A A I I ) . T I A C A A I C C C GCTGAAAGCC GCGGAGCATG TTGAACAAAA AACCAAATTC TAAGAGTTGT *""
PHE ILK SER ALA CYS LEU ALA VAL GLY SEll CYS GLY GLY TYR GLY SER PRO ILE GLY TYR GLY GLY CTTCTGTCGG GTGCGGGTAG CCACAAACTG TGACATACTT TTGAGCGTCG GGCTTAAATG GTTCCAGCTG GGWrAGCGC TTC ATC AGC GCC TGC CTG GCT GTC GGC AGC TGC GGC GGC TAT GGT AGC CCC ATC GGC TAT GGT GGC 1523
FIGURE 4."Sequences of chromosomal segments encompassing genes s15 and s19 in that order (D. gnmshawi and D. subobscura) or gene
Evolution of Chorion Locus 669
D subobscufu
1AGATCTTCCA GAATGCTTTC AAATTTCACT TATAGAAAAG TTCTTCCAAT TTCTTGCCTT CTTAAAACGT TLAAAAATGT GGATAGGGTA GAACTTTTTC TTGGCGAGTT GTAGCAGAAT ATTATTAAGA AAATATCCCA CTGTTTCCAT TCAAAATTCT
81
TGCCAAACAT TTACTTTTCA GTACCCTTTC ACGCTGGTCC TCCAATGAGA ACTAGTCCTA CGCCCTGTTT CCTTATGCGG
1 6 1
AATCCCTCAT CAAACGTAGC AGTTTTAGCA ACGCCCTGAA ACCCACTGAG CCGCCCACAG AACGTTACCC CCAAGAATGT
241
121
CCAAATGICA AATAATTCTA CAACAAATTT TAGGGGCTCT ATGGAGAATT GGCGCGTTCG CGAGTTCATT GAGAAAGTCG TGTGTGGTCG TCGAGGGGGC TGGCTTGGGA CAATCAGGCA TGGAAACAAT GGAACATCGC GTAACCCCAA GCGATTTTkT
401
AATGGCTCGC GAGTCGAGAC ACACCGACAA TGIATACATG GAAATGGAGT ACATAAATAC CTITGTACAC AACTATTAIT
401
GTACATTTAT TAAGCAATTA TGTGGCATAT ATTTGGTATA TAATTCGTAT ATGAAATGTG GATITGTGGC CCGTATATGG
5 6 1
6
-
-
GTCACGTMA TATCCAGTCT AATTTTGCGA GI-GC AAGCGTTTCG GGCTGTTTAT AGTTATAGTT TGATTGATTA
1 2 1
I"
-
TCCCACAACC ACCAAAACTA AGCATTCACC ATG AAG TIC c r c GTMG TAATCCTTAG AGCCTCCGCC CTAGGATCCA UET LYS TYR LEU
1 9 8
GCCAGCTAAT CCTCGTGTGC TTTTCCACCT TTAG TTC GTC TGC GTC AGC CTG GCT CTC TTC GCC T I C ATC
8 6 9
AGC GCC AAT CCC GCG TAC GGT GGC M C CGT GGT GGA TAT GGT GGT GGA T I C GGC M C GAT CGT GTG
PHE VAL CYS VAL sen LEU ALA LEU PHE ALA TYR ILE sen ALA ASN PRO ALA TYR GLY GLY ASN ARC GLY GLY TYR GLY GLY GLY TYR CLY ASN ASP ARC VAL
914
GLU TYR GLU GLN I L E LEU VAL PRO SER TYR GLY ARC SER ARC GLY GLY TYR GLY GLY TYR ASP ARC
GAG TAT GAG CAG ATC CTG GTG CCT TCG TAT GGT CGC AGC CGT GGC GGC TAT GGC GGT TAT GAT CGT
1000
CCC CAG ATC CTG CGA TCG GCT CCC TCT GGT TCC CGT GCC TCG GCT GCT GCT GCT TCG GCC GCT GCf
PRO GLN I L E L E U ARG SER ALA PRO SER GLY SER ARG ALA SER ALA A L I ALA ALA SER A L I ALA ALA
1066
GCC AT7 GCT CCT GGC AGC T I C AGC CAG TAT GCC A T T CCC CGT T I C GAG ATT GAC GGC AGC T I C AAT ALA I L E A L I PRO GLY SEE TYR SER GLN TYR ALA I L E PRO ARG TYR GLU I L E ASP GLY SER TYR ASH
1 1 3 2
GGT CCC ACC CAC GCA CAT GGT GGC T I C GGA CAT GGC GGC CGC GGT GGC TAC TAA TTTCCTGAAC GLY PRO SEE HIS CLY HIS GLY CLY TYR GLY HIS GLY GLY ARC CLY GLY r Y R ---
TCCAACACCA AACGAACACC TCAGACTTTC CTCTTTGATC MCTGGCACC AACAGCMTG CTCTGAGAAC A G G A A A ~ A A
LACTTCTTC AACCAMTCG TGIIATGTTGA ACACGAAAAA TATCACAGAC TTTTTTGCAT ATTGCGGGGC CCAGAGAAAA
1196
1216
-
CCTACMGAC GATGGCATAC TTTTCACCGC MGCTGGTTA AGMTTTGGC AGGGTATTAG AGAGTTCTAT GGAGAMATA
1356
1436
ATAGGGTAGA GATTTCGCAG C M C T G G M G TTGGTTGGGA A T T T M T T C T TATTTCTTGT A T A T C I M T C T C C A T T G A U ATGGATMCT TGCCMCGAA GAGCTTCTTT TAAATGCAAT TTCATTGGTA A C T M V T C T CTGACGCATA M C I M C C T C
1516
15 16
CCTTGTGCCA CLACTTTCAA TAGACACTGT ACAGAGGTCC CACTGTCACA TTTCTTGACT XAAGCCAGC CGCATGTCGT
1616
CACGCCTGGG CCATCGTCTG TTTAGACGAC CTGTCCAGCC CACCCCCATT GGAGGTCAGC ATCCAAATTT CGCAGATACG
1756
AAGCTCTAGC TGTGGGATGC AGTGCCATGG TATCAGAAAG GGGGACGGAC ACACAGCGCG AAACTTGCAG AACAACGGCA
1816
AAAGTTCGGG CCGTAGCTGA AGCTCAGCAA AGACGGGGAG AAACTGTGGA GCATCGCGGC TCGGAGCCGT GATAAATTCG
1316 - -
CGCCGAGATC ACGTTTTGAG TGCCACAATA ATACCTTGCT TATATAAAGA ACTGTGCGGG CCGTTTCATT TGTTAATTGT
I"
-
-GCCAACTGTT CCGAGCAGCA AGCGCCCCCC AAAAGACACA CAMACATTA TATAGCC ATG AAC ACT TTC GCT GTAA
1996
2012
GTAAACCCAA CGATGACTTC CCGTTCCCGG TTCGCTTTCC GGGAATACAC AATCCAAACC CAGTCCTGTG GCTAACCCAT
2152
CATCTTTCTC GACAG ACT TTG GCG GTT CTC TTC TGC GCT TGC CTC ATC GGC AAC TGC CAC GGA CGC THR LEU ALA VAL LEU PHP CYS ALA CYS LEU I L E GLY ASN C Y I HIS GLY GLY
NET ASN THR PHE ALA
TAT GGC GGT GGC GGC CAT GGA GGC T I C GTG C I A CAG GGA AGC TAT GGA CAG CGC TCC AAC GGA CGT 2218
TYR GLY GLY GLY GLY H I S GLY GLY TYR VAL GLN GLN GLY SER TYR GLY GLN ARG SER ASN GLY GLY
2284
GCC GCT TCG GCT GCC AGC TCT GCT GCT GCC GCA GGC AAC CAG CGT CCC GTA GAG ATC ATT GCC GGT ALA ALA SER ALA ALA SER PER ILA I L A ALA ALA GLY ASH GLN IRG PRO VAL CLU I L E I L E ALA GLY
2350
GGA CCC CGC GGT GGT TAT GGC CAT GGC CAC GAG ATC CTG CGC CCC ATT CAG CTG GGC TAT GGC GGA
GLY PRO ARG GLY GLY TYR GLY HIS GLY H I S GLU I L E LEU ARG PRO I L E GLN LEU GLY TYR GLY GLY
2416
CAC TCG CAG CGT GTG CCC CAG CAC GGC AGC TAC GGA CGT CGC AGT GGC TAT GGA CCT CGC TGG ACT
HIS SER GLN ARG VAL PRO GLN H I S GLY SER TYR GLY ARG ARG SER GLY TYR GLY PRO ARG TRP THR GTC CAG CCA GCT GGC GCC ACT CTC CTG T I C CCC GGC CAG M C AAC T I C CGC GCC TAT GTC TCG CCT
2482
VAL GLN PRO ALA GLY ALA THR LEU LEU TYR PRO GLY GLN ASU ASN TYR ARC ALA TYR VAL SER PRO
2548
CCG GAG TAC ACC AAG GTG G I G CTG CCC GTC CGT CCA GCT GAG CCC GTG GCC AAG CTG T I C ATT CCC PRO GLU TYR THR bYS VAL VAL LEU PRO VAL ARG PRO ALA GLU PRO VAL ALA LYS LEU TYR I L E PRO GAG AAC CAC TAC GGC I G C CAG CAG AAC TAC GGC ACG TAC GCT CCC CAG CAG AGC TAC M C GTC GAG 2614
GLU ASN HIS TYR GLY SER GLU GLU ASR TYR GLY THR TYR ALA PRO GLN GLN SER TYR ASN VAL GLU GGT CCC AGA T I C TAG ATGGATACTC TCCACCTCCT CAATCCCCCT TCTCAGTGTG GATTCGCTCC TGTGCAGCGC
2680
GLY PRO ARG TYR ---
2 7 5 5
GA*AM TACMMAGA AAACATMTT TCCMACAGT TTTATGGTAT AGTTTTGGGC GTACGGGAAG TACAGCGATA TCTGCTTCCG ACTTGGGTCG GATCGMCCA GAATTTCGGT CTTTATGCAG CTGCTTGCAG CTGTGCCACT ACAAATTTGA
2835
2915
TTGCAACTTT TGGGTGGGM TGTCTGAGTG ACTCTCTGGT CGAGMCGTG CTGCTMATT TGTTTACATT TTTTTCCACA STGCAAAAGA GTTCCACMT CAAACTTTAC I M T T T C C A C ACTTCAGAAT TTGTTTCCCA CTTTCTGGM C A T t m C A C
2995
J015
CCATTTATTC CCATTACTTT C C M G C A A M GTTTCTTCCA CGAACCATTG AATGTTTGCT GATTTTTGTG AAATATTTTT CTGGCCGGTA AGCAAAGTCT TTTGCTGACT T G T T T K G T T GAAGCTGCTG GCCCAATGCT TGTGCCACCT TCGCTTCACA
3155
FIGURE 4.-Continued
though, as expected, the similarities are generally less pronounced between distant species, in extragenic locations some comparably placed patches of strong similarity are evident irrespective of species; partic- ularly prominent are conserved blocks near the 5' end of each gene.
Figure 5 , c-e, shows higher magnification compar- isons of the s 1 5 gene in all four species. Strong conservation is seen in the immediate 5' flanking region as well as in shorter stretches further upstream (see below). The small 5' exon is also invariably well conserved. In contrast, the intron is extensively di- verged and shows no matches in any matrix. The chorion coding region of the large exon also displays relatively extensive divergence (higher than in s 1 9 ) . The 3' untranslated region shows a diagonal only in the
D.
grimhawi vs.D.
virilis comparison. Some se- quence conservation is also seen 3' to the gene but, with the possible exception of theD.
gm'mhawi vs.D.
viriZis comparison, it is more limited than at the 5'
end: it includes a short element (ATGTTGAACA) conserved in all species except
D.
melanogaster at approximately 20 nucleotides downstream of the polyadenylation signal, and a longer region of con- servation in all four species that includes the invariantelement CATACTTTT, approximately 60 nucleo-
tides further downstream.
A similar picture emerges from higher magnifica- tion comparisons of the s 1 9 gene and its immediate vicinity in both distant
(D.
subobscura vs.D.
grimrhawi)D. subobscuro 0. grimshawi
1 520 1040 1560 2080 2600 3120
1560 1560 1560 494 4014 1534 2054 2574 3094 3614 4560
@-@
@-@
2 0 6 0
*.;j
2080 2080 2080\ 2 6 0 0 QJ
Y
D b
0
C 3120 3120 3120
2600 2 6 0 0
.
2600k
.
u,D P, 3420
2
QJ
2
$ F
3 6 4 0
\
1:;
3640\
44603 6 4 0
a
4160 4160
4680
520 1040 1560 2080 2600 3120
4680 4680
494 1014 4534 2054 2574 3094 . 3614
4 6 8 0
D. subobscura D. subobscura
8 4 0 I
-360 -240 -120 + 1 120 2 4 0 3 6 0 4 8 0 6 0 0 720 840
840
- 6 0 0 I
-600 -480 -360 -240 -120 +1 120 240 360 4 8 0 600 7 2 0 ' -600
- 4 8 0
-360
- 2 4 0
- 1 2 0
+1
120
2 4 0
360
480
6 0 0
. ..
-480 -360 - 2 4 0 -120 +1 120 2 4 0 360 480 600 7 2 0 8 4 0 9 6 0
D. mefonogoster D. vtrifis
D. subobscura
- 6 0 0 -480 -360 -240 -420 ti 120 240 360 480 600 720 840 -600
- 1 2 0 \ : - 1 2 0
t 1
1 2 0
2 4 0
3 6 0
4 8 0
6 00
\
\
, ' ',+ 4
1 2 0
2 4 0
3 6 0
4 8 0
6 0 0
cj cj
7 2 0
@
\
7 2 08 4 0
-360 - 2 4 0 -120 14 120 2 4 0 360 4 6 0 600 7 2 0 8 4 0 \ 6 4 0
D. subobscura
-700 - 5 6 0 -420 -280 -140 t 1 140 280 4 2 0 560 7 0 0 8 4 0 980
t 1
1 4 0
2 8 0
4 2 0
5 6 0
7 0 0
8 4 0
5 6 0 Q
7 0 0
8 4 0
9 8 0
0
\
9 8 0
1120
- 2 8 0 -140 I4 1 4 0 2 8 0 4 2 0 5 6 0 7 0 0 840 9 8 0 4120 1260 I 1 1 2 0
Evolution of Chorion LOCUS 67 1
stantially more divergent, with only the 3’ untrans- lated region showing an A-rich sequence immediately following the polyadenylation signal in all four spe- cies. A 36-bp long imperfectly conserved element 360 bases downstream of the polyadenylation signal is common only to
D.
subobscura andD.
melanogaster.In summary, the matrix comparisons show clearly nonuniform divergence of the sequences, both within and outside the genes. That conclusion is robust, being essentially unaffected by the choice of matrix parameters (data not shown). The strong sequence conservation in the proximal 5‘ flanking DNA is particularly notable because of its discontinuous, patchy nature, and because it stands out against a background of sequence divergence elsewhere in the extragenic DNA. T h e immediate 5’ flanking region tends to be considerably more conserved than much of the gene itself, including parts of the coding region. Within the gene, the small exon (5’ untrans- lated and beginning of coding region) is more strongly conserved than the coding region of the large exon; the intron and 3’ untranslated regions are not conserved.
T h e highly conserved elements in the 5’ flanking region were further identified by an automatic se- quence alignment program (PUSTELL and KAFATOS
1984), and are diagrammed in the top panels of Figures 6 and 7. Filled boxes indicate elements of 2 8 nucleotides which are perfectly conserved in all known species, or elements of 2 9 nucleotides which are identical in three out of four cases. Matches between only two species are of course much more frequent; we made the empirical choice of showing as open boxes identities of 11 nucleotides in two species. T h e significance of shorter matches in mul- tiple species is underscored by the fact that they are invariably found in the same order, even if displaced by insertions/deletions, whereas 6 of the 13 open boxes are scrambled, and may not necessarily imply homology. Filled boxes tend to be clustered in the most proximal 5’ flanking region.
Detailed sequence alignments: Based on the com-
parisons discussed in the previous section, detailed sequence alignments were constructed for the prox-
imal5’ flanking DNA and the nearby small exon and intron of each gene. T h e bottom panels of Figures 6 and
7
demonstrate the existence of highly conserved elements, interspersed with elements that are imper- fectly conserved and with extensively diverged se- quences. For these alignments, short blocks ( 2 5 n u - cleotides) that are invariable and in the same order in all species were first identified; they were both shaded and boxed. T h e sequences between these blocks were then aligned according to arbitrary but consistent rules, taking into account insertiorddele- tions as well as substitutions (see MATERIALS A N DMETHODS). In these “inter-block” regions, less perfect conservation involving at least three sequences was indicated by shading without boxes. T h e following features can be seen, in a 3’ to 5‘ direction.
In gene s19 (Figure 6), the intron is almost com- pletely nonconserved, except at its 5’ end. The small exon shows two separate well-conserved segments: one corresponds to its coding portion and the other to the first 22 nucleotides of the gene. The 5’ flanking DNA shows almost uninterrupted high conservation between positions - 1 to
-
82; within that region four perfectly conserved blocks are encountered. Further upstream, conservation is essentially limited to two invariant octamers.I n gene s15 (Figure 7) the intron is again extensively diverged, except at the 5’ end and in a short internal element, possibly related to lariat formation
(4.
GREEN 1986). In contrast, the small exon is almost completely conserved: for example the first 16 nu- cleotides of the transcript are identical in all four species. T h e proximal 5’ flanking region, between positions - 1 and - 62, is also very strongly con- served. Further upstream, over ca. 170 nucleotides(ca. 100 in
D.
melanogaster), conservation is limitedand major insertions/deletions have occurred among the various species; only three short (five to nine nucleotides) invariant elements are evident, plus some elements which are shorter, or conserved in only three sequences. Then a second strongly con- served extragenic segment of ca. 40 nucleotides is encountered ( - 157 to
-
199 inD.
melanogaster;-
233 to -276 inD.
grimshawi). More distantly, matchesFIGURE 5.-Matrix analysis of interspecies sequence conservation in the chorion locus. Letters indicate sequence matches, with A
corresponding to maximal similarity and L the lowest match shown under these conditions. Lateral shifts in the diagonal result from insertions/deletions, and off-diagonal matches indicate sequence repeats. The direction of transcription is from upper left to lower right of each panel. The two exons of each gene are boxed, with their untranslated terminal portions marked off; the large exon is shown as far as the polyadenylation signal. The single intron is indicated by a line connecting the exons. Panels a and b show low magnification comparisons of segments that encompass both the s l 5 and the s19 genes (upper left and lower right). Numbers are as in Figure 4, except for D. melanogaster where they refer to the sequence published by WONG et al. (1985). Note the prominent sequence conservations in the proximal 5’ flanking regions. Panels c to e show higher magnification comparisons of s l 5 alone, and f comparisons of s19 alone. Each of these panels shows two matrix comparisons, separated by a diagonal solid line; numbers refer to the 5‘ end of the respective gene. Note that discontinuous elements in the proximal 5’ flanking region are substantially more conserved than the intron and most of the 3’
untranslated sequence, as well as major parts of the coding region. Conservation downstream of the 3’ end of the gene is less than upstream of the 5’ end. The small (5’) exon, which is largely untranslated, is also highly conserved (except in the D. melanogaster s19 gene). Matrix settings are range = 9, scale = 0.95, hash level = 1, jump level = 1, step = 1, minimum value plotted = 78 (PUSTELL and
ti72 J. C. Martinez-Cruzado et ccl.
r~ I 1 I I I 1 I I 1 I I I I I I I I I 1
-1000 -950 -900 -850 -800 -750 -700 -650 -600 -550 -500 -450 -400 -350 -300 -250 -200 - f 5 0 -100 -50 t f d mehnogoster
D. subobscura
D. grimshawi A A T A A A I
-994
-415 -408 -259 -252
. . .
. . . -CCCGTAGCTCAAGCTCAGC
122bp
-
204bp-GCTGAACCTGAAGCTCAGC
....
-471 -464 -124 -317
-82 -70 - 6 5 51 - 4 9 - 4 4 - 3 1 TATA -18
Dm -119 AAACTGCCCGAGAACAGACCGCGAAGC.CAGCTCTTGA Ds -119 AAACACGGCGACAAACTGTGGAGCATCGCGGCTCG.GA
Dg - 81 ... . . .
. . .
-81 -69 -65 - 5 1 -49 - 4 4 - 3 2
Fxnn - 17
+
= +11 + 1 4 * 2 2 r e g i o n c o d i n g
I
. . . AAA . . ACCCA . . .
. . .
. .
*1 + 4 + 1 1 + 1 4 + 2 2
Dm .CTCCCT . . CA.GAACCGCTF.CCGTATTCCCTGC.CGCTTT T P . . . CATPTTCCC . . . . GACTTATG . . . CTAAC . . . TCAAAGT . . . TPTCCTGATTTTCCAG
Ds AAACCCAACCATGA .... CTTCCCG . . TTCCCGGTTCCCTTTCCCGGAATA .. CACAAT .. CCAAACCCAGTCCTGTGCCTAACCCATC.ATC TT.... TCTCCA . . . CAG
Dg AGTC . . . CATGA ... C A TP ... TGCCCC . . . CAATTGCCACAATTTCCGTTTGCCGTCAT . . . TAAC.CATCCAT.TTCCACTCTCCATG . . . CAC
Intron
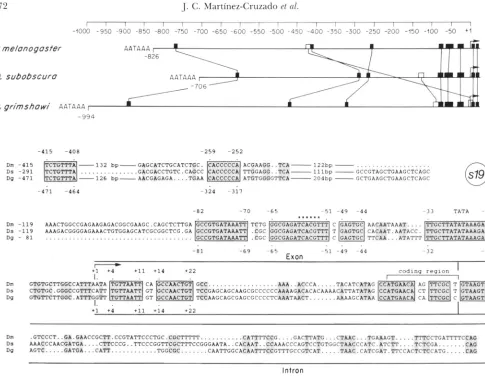
FIGURE &-Identification of highly conserved elements upstream and at the beginning of gene s l y . In the top panel elements which are invariant in all three species (28 nucleotides), at any place within the intergenic region, are indicated by filled boxes; note that such elements are clustered in the proximal 3' flanking region and are never found in crossed arrangement even if displaced by deletions/ insertions. Elements which are conserved in two species ( 2 I 1 nucleotides) arc considered less significant; they are shown as open boxes
and are less clustered and frequently scrambled. T h e bottom panel shows detailed sequence alignments that ignore scrambled matches. T h e proximal half of the intergenic 3' flanking DSA is shown, as well as the first small exon and the intron (large boxes). T h e alignments were initiated using as anchor points invariant elements ( 2 3 nucleotides present in all known species; boxed and shaded). Less well conserved secondary anchor points were then established in between, and finally alignment of the interstitial sequences was performed hy applying arbitrary but consistent rules (see MATERIALS :ASD METHODS). Aligned nucleotides matched in three species are shaded. Dots
correspond to putative deletions. and lines with numbers represent extensively diverged, unaligned segments of the indicated length. Sequences are numbered from the respective mRSA start site (arrow). Species codes are Dm, D. mdanogaskr; Ds, D. su6o6.~rurn; Dv, D.
virilit; and Dg. I). p-imshaui. Sote the patchy conservation of sequence elements in the 5' flanking DSA and the first exon, which strongly contrasts with the extensive divergence of the intron. All the species invariant elements diagrammed in the top panel are shown here, except for the most distal element, CATACTTTT.
are again limited and often are shared by pairs of phylogenetically more related species: D. melanogaster
and D. sztbobsczrm, or
D.
uiri1i.s andD.
grimshawi. How- ever, an l l-nucleotide element (TTCATTGAGAA) is identical in three species and partially conserved in D. melanogaster.DISCUSSION
Evolutionary stability of the organization of the
locus: T h e results presented reveal strong conser-
vation of the overall organization of the chorion locus. In all species examined, four chorion genes are clustered within 5.6 to 6.7 kb of D S A , approxi- mately 1 kb away from the gene identified as S C -
ORF. The order, spacing and orientation (with one
uncertainty) are also highly conserved.
Evolution of Chorion Locus 673
A A T A A A
D melanogaster
D. subobscura
D. virilis
D grimshowi
-971
Dm - 3 3 3 AACCATTACCCCCGACAATGTGCATAAT.ATMIICTTCAA TT... C A A C A A A ~ T G C A C . . T C T A T T C G A A M T A A A C G C G T
Ds - 4 0 4 AACG.TTACCCCCAACAATCTCCA.AATCACMA
...
TAATT~hCMCAAATT~ACGCGCTCTAT.CCAGAAPI%GCGCGTDV - 3 9 6 ... M C C . n ; G G C A A
...
A A . . CACGCGC Dg -445 ... AMT.TCGCGCTACAA ... AT.GCCGTGTDm - 2 5 6
...
TCGTG.CTTCCCA~CGAACACTCGC.G TO ... TTTDThGTGC...Ds - 3 2 1 ... TCCCCAG TT.. CATTOACAA.ACTCGT.CTG ... TGCTC.
...
GTCC.AC.GGGGCn;CCT . . . .Dv - 3 1 2 GCTCCGC.TCCTGGA ~ CATTGACAACTCACGAACTGCT . . ... TAATTTCTTm-l-TCT.CTCGAGCTTGTFTCGG*CTCCCTCCCGCTTTTT
Dg - 4 2 1 CTTTCC~CCGGATT..CATTGACMCTCACGAAGTGCT-lS-T~ATTAT~-26-TCT.CTCCAACCCAACTCG.AG.CCC.CCCC..TTTT
- 1 9 9 - 1 8 8
- 1 1 6 - 1 1 2
- 1 6 1
Dm - 2 1 1 ... TATCA-13-CGTA.GMTAGC.. AC . ... ... Ds - 2 7 9
....
TGOCACA..ATCA-5-CGAAACMTCC..A1
ACATCGCCTAACC C C M G7
CATTTTATAAT CCCTCGCGACTCGAGACACACCGACAATChA.TAC.MC GGCTT. .GACMCA
Dv - 2 1 9 C C C C ~ G . . C A ~ A T C A - l - G A A A A C M T G C A M ACATCCCCTAACC C . M . CATTTTATAAT TCTTC ... GCCAGACAC ... GACAACCAAATAC Dg - 2 9 8 CCCCTGG.ACATTATCA-6-ACAAACAACC..AA ACATCCCCTAACC C..AG GATTTTATAAT TGCT ... CCAGACACA. ..ACAACAAA..AC
- 2 1 6 - 2 6 4
- 2 5 2 - 2 4 8 - 2 3 1
- 1 4 8 -140 -108 -101
Dm - 1 4 8 ... ...
Ds - 1 8 7 ATCCAAATC.C ...
Dv - 1 8 8 CACCCA ... .... ... ... ... Dg - 2 1 3 .TACMCTCCG ... C M G .. TTTCT ... CTTATCT ... ACTTCGC ....
- 2 0 3 - 1 9 5
- 1 6 5 - 1 5 8
- 6 8 - 6 4
D m -100 ... GCCh'ITTCTGCGCTGlrUCAGAACAA ... R A . C T ... ... DS - 8 1 . . . GTGC ... ...
Dg -154 TCACTGACATA. CACAAATAAACATATTAATATATCG.. A
Dv -124 TCCCTCCCATA ... O A M T T A T T A TT ... ATA .. ... TG ... TGGCCA
...
. . .- 9 4 - 9 0
. .
Exon -61 - 5 3 -11 TATA - 2 3 + 3 6 + 2 8 + 2 6 + 1 + 2 2 + 1 6
A T C T C C A ~ C C T A A A A ~ . G C G . .
ATATCCAGTCTA..ATTTTGCGAG AACCGTTTCGCGCTGTTTATACTT ATAGTTTGATTGATTA TCCCAC AACCA G CAAAACTAA G
ATATCCAGTCTAT.ATTTTCCA.. CCTCGTTGCGCTC.ACCTA.AATC ATAGTTTGATTCATTA ACC . . . AACCA A C A A A A C T M C GTATCCCGTCTA..ATTTTCCA.. GAACGTTCCTGGC.AACTA.AATC ATAGTTTGATTGATTA ..CCAC AACCA GACCGTTTCTGCT. CCGTA. AATC
r
y
CCCCA. A Ar
CAAAACTAAl
c A. . .
- 6 0
- 5 2 - 3 1 - 2 3 41 + 1 6 + 2 1 + 3 5 + 2 5 * 2 1 + 3 8 codlng region' t l O 3 + 9 7
... TCCCCGTGAAGGAG . . . TGC....CAGCC.AACIY;
+ 1 2 8
. . . . . . C"T.CCACCTT.TAG
CC.GCATTPCCCCXT?T..CACCT".CAG
. . . CT%CACATATGG.AT ... ... .. CCTAAAATCA . . . TAG . . . GGCAT . . .
* 3 1 + 9 9 . + l o 1 . * 1 2 9
Exon Intron
FIGCRF. 7.-Identification of highly conserved elements upstream and at the beginning of gene s15. Conventions as in Figure 6. In the top panel filled boxes indicate invariant elements in all known species ( 2 8 nucleotides) or in three out of four species ( 2 9 nucleotides). T h e bottom panel includes all of the above elements, except for GCAATTATG which overlaps a four-way box in D. melanogastrr ( - 113/