Division XII
SAFETY ASSESSMENT OF VENTILATION STACK FOR BEYOND
DESIGN BASIS WIND USING NON-LINEAR ANALYSIS
Shrikant D Mishra1, Girish Patil2, Parag Bande3, R N Sarangi4, Raghupati Roy5, Arvind Shrivastava6
1
Scientific Officer-E, NPCIL, Mumbai, India
2
Scientific Officer-E, NPCIL, Mumbai, India
3
Scientific Officer-G, NPCIL, Mumbai, India
4
Scientific Officer-H, NPCIL, Mumbai, India
5
Scientific Officer-H+, NPCIL, Mumbai, India
6
Scientific Officer-H+, NPCIL, Mumbai, India
ABSTRACT
Ventilation Stack structure of a typical Nuclear Power Plant (NPP) is analysed and designed for a design basis wind velocity corresponding to 1000 years return period. Subsequent to the Fukushima Event, as a part of safety assessment of NPP structures, systems and components, assessment of structural integrity of Ventilation Stack structures has been taken up against extreme natural events beyond design basis i.e., beyond design basis wind in both along and across wind direction using non-linear analysis in Abaqus software. Ventilation stack shell is divided into different sections to account for variation of thickness of shell structure of stack varying linearly from bottom to top. Steel reinforcements have been introduced at relevant layers/sections of the shell element of stack. Transverse shear deformation in element formulation and geometric non-linearity due to large deformation has been considered to account for changes in geometry during the analysis. Non-linear analysis with detailed material characterization and failure models for both concrete and reinforcement has been carried out for a realistic estimation of post-cracking margins and to understand the non-linear behaviour of the structure at various load steps under beyond design basis wind speed. Based on the detailed nonlinear analysis, failure modes and failures locations for ventilation stack shell are identified. This paper presents the analysis methodology for safety assessment of wind sensitive stack structures against beyond design basis wind. The analysis procedures, material models adopted for the analysis, etc. and the analysis results of a typical ventilation stack under beyond design basis wind speed have been discussed in this paper. Based on the results of the nonlinear analysis safety margin with respect to beyond design basis wind speed has been established.
Keywords: Ventilation stack, beyond design basis wind, concrete and reinforcement nonlinearity, safety margin
INTRODUCTION
10 m/s speed. Accordingly, site specific beyond design basis wind speed value has been evaluated for different NPP sites. Ventilation stack being the wind-sensitive structure is required to remain functional during BDBE and the collapse of the same may endanger the functionality of the surrounding buildings supporting essential systems required under beyond design basis condition. This paper presents the study carried out, considering ventilation stack structure of a typical NPP, to assess the safety of the ventilation stack against wind load due to beyond design basis wind speed. Non-linear analysis with detailed material characterization and failure models for concrete and reinforcement has been carried out, for a realistic estimation of post-cracking margins and understand the non-linear behaviour of the structure at various load steps under beyond design basis wind speed and to establish the various failure modes, failure location etc. based on the engineered structure. The analysis procedures, material models adopted for the analysis, etc. have been discussed here. The results of the analysis have been studied and safety margin with respect to beyond design basis wind speed has been arrived.
MATHEMATICAL MODELLING OF VENTILATION STACK
The ventilation stack structure consists of a reinforced concrete (RC) shell and RC raft foundation. Abaqus is used for the detailed non-linear analysis of ventilation stack structure for evaluation of safety assessment and structural integrity. Stack is modelled as 3D finite element (F.E.) along with raft and opening for underground ventilation tunnel on north face. The ventilation stack is 100m above ground level. The cylindrical shell is rigidly connected at base with the ring foundation raft. The outer and inner diameters of ring foundation are 16.0 m and 3.5 m respectively. Opening of size 3.5 wide and 3.5 m deep is made in the shell for taking the underground ventilation tunnel provided to carry the exhaust duct into the stack. The thickness around the opening is 950 mm which gradually reduces to 500 mm.
Stack is divided into different sections to account for variation of thickness of RC shell structure of stack varying linearly from bottom to top. The top 7 members are divided closely so as to find out the variation of deflection at the tip. Steel reinforcements have been introduced at relevant layers/sections of the element. Quadrilateral four noded shell elements are used for modeling the ventilation stack. Nine integration points are used in thickness direction of the shell help in tracing the progress of cracks through the depth of the shell. Transverse shear deformation is considered in the element formulation by assuming that the normal to the mid-surface of the element remains straight but not necessarily normal during deformation. Geometric non-linearity due to large deformation has been considered by enabling FE programs to account for changes in geometry during the analysis. Then the stiffness matrix is calculated using the current configuration i.e. current position of nodes. 3D F.E. model of stack is shown in Figure 2.
Modeling of Steel Reinforcement
Reinforcement in stack has been modelled as a smeared layer with a constant thickness equal to the area of each reinforcing bar divided by the reinforcing bar spacing as shown in Figure 1. One or multiple layers of reinforcement in shell elements can be specified. For each layer the rebar properties have been specified, such as, (i) the cross-sectional area of each rebar, (ii) the rebar spacing in the plane of shell element, (iii) the position of the rebars in the thickness direction, measured from the mid-surface of the shell (positive in the direction of the positive normal to the shell), (iv) the rebar material name, and (v) the initial angular orientation, in degrees, measured relative to the local
Figure 2. 3D F.E. Model of Ventilation Stack
MATERIAL MODEL
The concrete damage plasticity model is used for concrete reinforcement in the present nonlinear analysis. The material model is a continuum, plasticity-based, damage model for concrete. It assumes that the main two failure mechanisms are tensile cracking and compressive crushing of the concrete material. Kent and Park Model have been used to consider the stress strain behaviour of concrete under compression. The material model in tension as suggested in Japanese codes JSCE JGC-15 has been considered for concrete. The grade of concrete considered in the analysis is M35 and for steel is FE500.
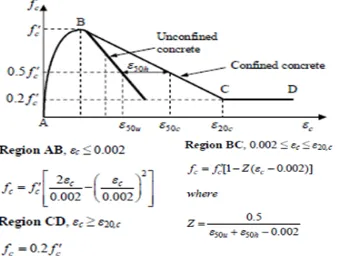
Stress-Strain Behaviour of Concrete under Compression (Kent & Park Model)
Kent and Park proposed a stress-strain curve for concrete confined by rectangular hoops as shown in Figure 3. A second-degree parabola represents the ascending part of curve and assumes that the confining steel has no effect on the shape of this part of curve or the strain at maximum stress. This essentially means that the ascending curve is exactly the same for both confined and unconfined concrete. It is also assumed that the maximum stress reached by confined concrete is equal to the cylinder strength fc' that is reached at a strain of 0.002.
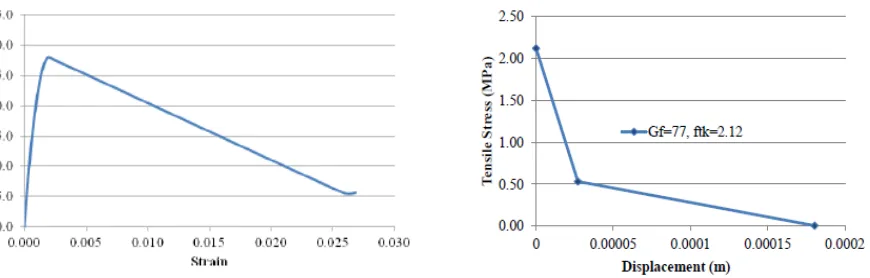
Stress-Strain Behaviour of Concrete under Tension (JSCE JGC15)
Fracture Energy (Gf) based approach is adopted for
simulating tension in concrete.The different parameters of this model are:
Gf = Fracture Energy of Concrete = 10(dmax) 1/3
*(fck '
)1/3 dmax = Maximum size of aggregate
fck = Characteristic Compressive Strength of Concrete
ftk = Uniaxial Tensile Strength of Concrete = 0.23f'ck 0.67
For, dmax = 16 mm, fck ’
= 28 MPa, Gf = 77 N/m
Ultimate Crack Width , wu = 5*Gf/ftk = 0.1816 mm
Crack Width, wl = 0.75*Gf/ftk = 0.0272 mm
The crack width is treated as displacement perpendicular to the direction of crack and the same is
correlated with the tensile stress as shown in Figure 4. Figure 4. Material Behaviour of Concrete (M35) in Tension
Stress-Strain Behaviour of Concrete under Compression and Tension for M35
Figure 5. Stress-Strain Curve of Concrete (M35) under Compression
Figure 6. Stress-Strain Curve of Concrete (M35) under Tension
Material Model for Reinforcing Steel
A linear elastic and plastic hardening behaviour is assumed for the reinforcing steel. The grade of steel considered is FE500.
LOADING
Varying Load
Stack is designed to resist the wind forces in both the along-wind and across wind directions. The along wind load (mean plus fluctuating component of wind) per unit height of the Stack at any level is calculated as per clause 4.2.2 of ACI 307-98 and is based on mean hourly wind (MHW). Fluctuating component of wind is based on gust factor and base bending moment due to mean wind.
Across wind load on the stack is generated due to vortex shedding phenomenon. As per clause no. 4.3.2.2 of ACI 307-98 any method using the modal characteristics of the Stack shall be used to estimate the across-wind response in the critical mode. Thus the equations given in clause A-5.3 of IS: 4998-1992 is used for calculating wind response in the critical mode of stack vibration. Calculation of across-wind load is made by first calculating the peak response amplitude at the specified mode of vibration (critical mode).
Estimation of Along Wind Load
Along wind load is consisting of mean along wind load (w(z)) due to mean wind and fluctuating component of wind due to gust (w'(z)). Along wind load per unit height of the Stack at any level is calculated as per clause 4.2.2 of ACI 307-98 and is based on maximum wind speeds averaged over a one hour i.e., mean hourly wind (MHW). Fluctuating component of wind is based on gust factor and base bending moment due to mean wind.
Calculation of Mean Along Wind Load
The mean load
w(z) in lb/ft is calculated using the following equation.
(1) (z) p * d(z) * (z) C (z) w dr − − =
Where, Cdr (z) = 0.65 for z < h-1.5 d(h) and Cdr (z) = 1.00 for z > (h-1.5 d(h)), d(z) = outside diameter at
height z, ft., h = height of stack above ground level, ft., d(h) = top outside diameter, ft.
(2) (z) V 0.0013 (z) p 2 = − − (z)
V = mean hourly wind speed in ft/sec, = Vb*k1*k2*k3
Vb is the site specific beyond design basis wind speed. k1 = risk coefficient = 1.0 (for beyond design basis
event as site specific beyond design basis wind Vb includes associated risk coefficient), k2 = terrain,
height and structure size factor, and k3 = topography factor.
Calculation of Fluctuating Component of Along Wind Load
Fluctuating component of wind is based on gust factor and base bending moment due to mean wind. The fluctuating load w'(z) is calculated using the Equation 3 below.
(3) h (b) w M * G * 3.0z (z)
w' = w′3
Where Mw(b)= Base bending moment due to mean wind w(z)and
[
]
(4)Where, (33)V is design wind velocity at z = 33 ft. T1 is the natural period of chimney in seconds per cycle
obtained by free vibration analysis of stack. Mw(b)is calculated by applying mean along wind load
(z)
w as equivalent nodal force along height of ventilation stack. Where, h is the total height of stack, ft.
Estimation of Across Wind Load
Across wind loads due to vertex shedding in the critical modes are considered in the analysis of stack shells when the critical wind speed Vcr is between 0.50 and 1.30 V(Zcr). Across-wind loads need not be
considered outside this range. As per ACI 307-98 any method using the modal characteristics of the stack may be used to estimate the across-wind response in the critical mode. Thus the equations given in clause A-5.3 of IS: 4998-1992 is used for calculating across-wind response in the second mode. Free vibration analysis of stack is carried out to find out an un-damped natural frequencies, mode shapes and modal participation factors in various modes.
Check for Across Wind Load
Across wind loads due to vertex shedding in the first or second modes are considered, when the critical wind speed Vcr is between 0.50 and 1.30 V (Zcr).
Where, V(Zcr) = the mean design wind speed at Zcr, Zcr = (5/6 h), h is the total height of stack, ft. Vcr, is
critical wind speed for vortex shedding for the ith mode of vibration is given by Equation 5 below
(5) S fd(u) V t cr=
f = ith mode frequency, d(u) = mean outer diameter of upper third of the stack, ft. St is Strouhal Number
given by Equation 6 below.
(6) (A) F 0.25
St= 1
(7) d(u) h 0.206log 0.333 (A)
F1 = + e
Calculation of Shear Force and Bending Moment
The sectional shear force (Fzoi) and bending moment (Mzoi) at any height z0, for the i th
mode of vibration shall be calculated from the Equation 8 and Equation 9 given below.
(8) 0 d φ m η f 4π F H z zi z oi 2 1 2
zoi= ∫
z (9) 0 )d z -(z φ m η f 4π M H z 0 zi z oi 2 1 2
zoi= ∫
z
Combination of Along and Across Wind Load
As per clause no. 4.2.3.5 of ACI 307-98, across wind load is combined with the coexisting component of along wind load (mean component due to hourly mean wind).
[
] [
]
{
M (z) M (z)}
(10) (z)M l 2 0.5
2 a
w = +
Where, Ma(z) = moment induced by across-wind loads and Ml(z) = moment induced by the mean
along-wind load w(z)
ANALYSIS METHODOLOGY
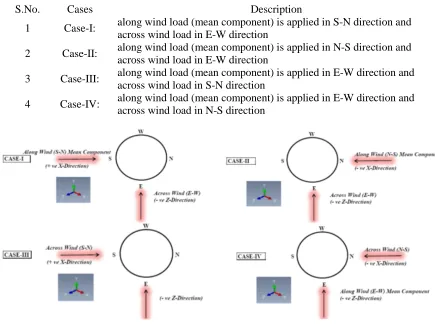
Stack is analysed for a combination of along wind loads (mean or static component of wind load due to Hourly Mean Wind (HMW)) and across winds applied in different directions for four different cases to account any uncertainty with respect to direction of wind flow. Both along and across wind loads are calculated as equivalent nodal forces varying with respect to height of stack. These equivalent nodal forces are then divided by number of nodes in the half perimeter and are applied uniformly at the respective location of nodes in the half perimeter. Wind load due to both along wind and across wind is applied incrementally. A maximum load increment size of 1% of full load is employed with sufficient iterations in order to satisfy the equilibrium of the structure. Four different cases considered in the analysis are given in Table 1 and Figure 7:
Table 1: Different Cases Considered in the Analysis
S.No. Cases Description
1 Case-I: along wind load (mean component) is applied in S-N direction and across wind load in E-W direction
2 Case-II: along wind load (mean component) is applied in N-S direction and across wind load in E-W direction
3 Case-III: along wind load (mean component) is applied in E-W direction and across wind load in S-N direction
4 Case-IV: along wind load (mean component) is applied in E-W direction and across wind load in N-S direction
Figure 7. Different Cases Considered for Analysis of Stack
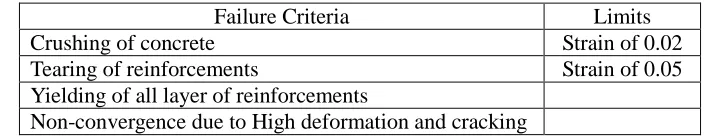
FAILURE CRITERIA
Table 2: Failure Criteria of Stack
Failure Criteria Limits Crushing of concrete Strain of 0.02 Tearing of reinforcements Strain of 0.05 Yielding of all layer of reinforcements
Non-convergence due to High deformation and cracking
RESULTS
Maximum Top Deflection of Stack
The deflections at the top of stack under different condition as brought out in Table 1 are given in Table 3 below.
Table 3: Top Deflection of Stack along N-S and E-W Direction
S.No. Cases Maximum displacement along N-S direction (m)
Maximum displacement along E-W direction (m)
1 Case-I 2.02 0.49
2 Case-II 1.93 0.48
3 Case-III 0.50 1.52
4 Case-IV 0.50 1.51
Variation of Principal Strain in Inner and Outer Face of Concrete
The variation of principal strain at inner and outer face of concrete is shown in Figure 8 for the most critical case (Case-I) having maximum top deflection. Here six colours are used to differentiate the type of strain. Red denotes the complete loss of tensile strength of concrete; the corresponding strain value is 0.002. Green is for tensile strain more than 0.00015 (cracking strain). Cyan and blue denote compressive strain of concrete less and more than 0.00015, respectively. As per CEB-FIP model code the crack propagation of concrete starts at a strain of 0.00015. When each integration point along the thickness of concrete at any section reaches that strain, concrete is said to be through and through cracked in that section. Loss of complete tensile stress of concrete is considered in case of through and through cracking of concrete at strain 0.002 at each integration point along the thickness. The through and through cracking has been observed in a large portion at different elevation of stack.
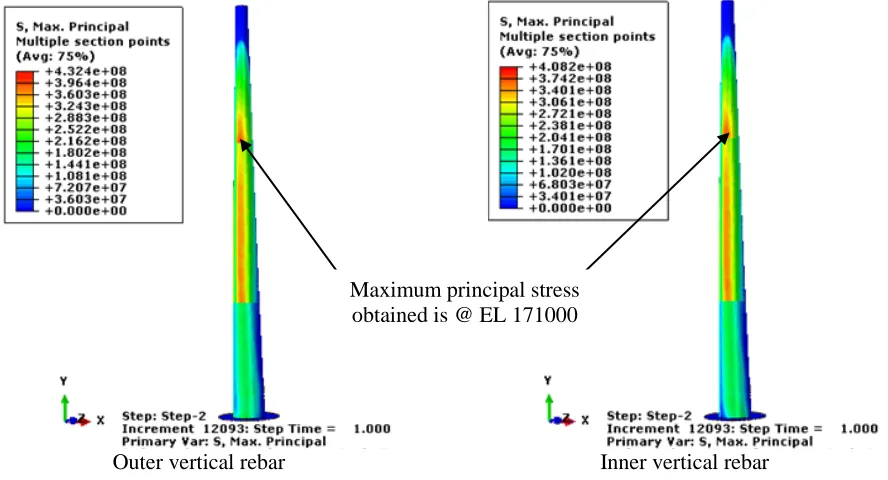
Variation of Principal Stresses in Rebar Layer
The maximum principal stresses obtained in rebar layer under four different cases mentioned in Table 1 are given below in Table 4.
Table 4: Maximum Principal Stresses (MPa) in Rebar Layer
S.No. Cases Vertical Rebar Layer Horizontal Rebar Layer Outer Inner Outer Inner
1 Case-I 432 408 92 86
2 Case-II 453 412 73 53
3 Case-III 405 384 78 74
Outer surface Inner surface
Figure 8. Variation of Principal Strain in Concrete (Outer and Inner Surface)
Outer vertical rebar Inner vertical rebar
Figure 9. Variation of Principal Stresses (N/m2) in Outer and Inner Vertical Rebar
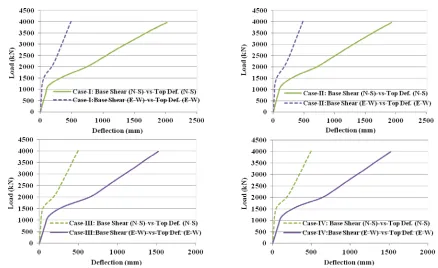
Load-Deformation (P-Δ) Curve of Stack
The non-linear load-deformation (i.e., base shear vs. top deflection) curve of stack under BDB wind for four different cases as mentioned in Table 1 is given below in Figure 10.
Red denotes the complete loss of tensile strength of concrete, corresponding strain is more than 0.002
Figure 10. Load Deformation Curve of Stack Under BDB Wind for Different Cases
DISCUSSION AND CONCLUSION
The analysis results are studied in terms of stresses and displacements. It is observed from the non-linear load-deflection curve that the response of stack is linear at initial steps, further, as cracking of concrete starts, and then it behaves non-linearly. It has been observed that the distribution of stiffness degradation in stack becomes symmetrical at higher wind loading due to presence of the across wind load. This un-symmetrical distribution of stiffness degradation causes torsional deformation of the stack, due to which the component of the deformation in the along-wind direction reduces. This, in return, shows the pseudo-stiffening of the stack at higher wind load. This effect is not observed if the stack is subjected to only along or only across wind load. The maximum principal stresses in the rebar at outer and inner layer are within limit. The structural strength and stiffness of the 100m high ventilation stack is adequate to withstand the beyond design basis wind speed of 90 m/s without collapse and there exists sufficient margin even when subjected to wind loads higher than the beyond design basis wind.
REFERENCES
ACI (307-2008) (2008) Code requirements for reinforced concrete chimneys (ACI 307-08) and commentary. American Concrete Institute, Farmington Hills
CICIND (2001) Model code for concrete chimneys, Part A. In: The Shell, 2nd edn (revision 1)
IS: 4998(Part 1)-1992 (reaffirmed 2003) Criteria for the design of reinforced concrete chimneys. Bureau of Indian Standards, New Delhi
IS: 875(Part 3)-1987 (reaffirmed 2003) Code of practice for design loads (other than earthquake) for building and structures. Bureau of Indian Standards, New Delhi
JSCE JGC15, Japan Society of Civil Engineers Standards, Japan 2008
ACKNOWLEDGEMENT