18th International Conference on Structural Mechanics in Reactor Technology (SMiRT 18) Beijing, China, August 7-12, 2005 SMiRT18-M03-1
SAFETY MANAGEMENT IN NPPs USING EVOLUTIONARY
ALGORITHM
Alok Mishra*
Nuclear Power Corporation,
NUB, Anushaktinagar,
Mumbai – 400094, India
E-mail: [email protected]
Anand Patwardhan
SJM School of Management,
Indian Institute of Technology,
Powai, Mumbai – 4000 78, India
Ashok Chauhan
Nuclear Power Corporation,
NUB, Anushaktinagar,
Mumbai – 400094, India
A.K. Verma
Reliability Engineering Programme,
Indian Institute of Technology,
Powai, Mumbai – 4000 78, India
ABSTRACT
Technical specification and maintenance (TS&M) activities in a plant are associated with controlling risk or with satisfying requirements, and are candidates to be evaluated for their resource effectiveness in risk-informed applications. The general goal of safety management in Nuclear Power Plants (NPPs) is to make requirements and activities more risk effective and less costly. Accordingly, the risk-based analysis of Technical Specification (RBTS) is being considered in evaluating current TS. The multi objective optimization of the TS&M requirements of a NPP based on risk and cost, gives the pareto-optimal solutions, from which the utility can pick its decision variables suiting its interest. In this paper a multi objective Evolutionary Algorithm technique has been used to make a trade-off between risk and cost both at the system level and at the plant level for Loss of coolant Accident (LOCA) and Main Steam Line Break (MSLB) as initiating events.
Keywords: safety management, technical specification, multi objective optimization.
1. INTRODUCTION
Over the years there is a growing interest in the nuclear industry, to stimulate the use of Probabilistic Safety Analysis (PSA) for risk-informed application aimed at better safety management of NPPs. The general goal of safety management in NPPs is to make requirements and activities more risk-effective and less costly by using the risk information to focus better on what is risk-important (Veseley, 1999) .
The resource versus risk-control effectiveness principles formally enters in optimization problems where the cost or the burden (i.e. number of tests conducted, man-hours required, incurred costs, occupational exposure, etc.) is to be minimized simultaneously with the risk or performance. This relationship applies when TS&M activities are optimized to minimize both the cost and the unavailability of safety-related systems/ plant risk taking TS&M-related parameters as the decision variables.
purpose of the different TS&M tasks on increasing the system availability, which in some cases may be redundant, have brought a growing interest during the last years to focus on the simultaneous and multi-criteria optimization of TS&M for better safety management in NPPs. However, the optimization problems were restricted to minimizing the cost or the burden while restricting the risk / performance to be constrained at a given level.
In the simultaneous optimization of TS&M-related parameters based on risk (or unavailability) and cost, like in many engineering optimization problems (i.e. design, reliability, etc), one normally faces multi-modal and non-linear objective functions and a variety of both linear and non-linear constraints. This results in a complex and discrete search space with regions of feasible and unfeasible solutions for a discontinuous objective function that eventually presents local optima. For such problems, it is desired to find global optima not violating any constraint.
Most classical multi-objective methods convert multiple objectives into a single objective either by aggregating them or by converting all but one objective into suitable constraints. Although some of these classical methods can be applied repeatedly for finding multiple pareto-optimal solutions, each method usually requires the setting of a number of parameters (aggregating weight vectors or constraint limits). Recently, increasing interest has been shown in the use of evolutionary optimization algorithm for finding multiple pareto-optimal solutions.
Evolutionary Algorithms (EAs) mimic natural evolutionary principles to constitute search and optimization procedures in a variety of ways. Genetic Algorithms (GAs) are search and optimization algorithms inspired by the principles of natural evolutionary principles. Conceived by John Holland in the early sixties , GAs have enjoyed a number of applications and developments. One of the niches of GA’s application domains is in the field of multi-objective optimization, where instead of one multi-objective the problem is faced with number of conflicting objectives.
Over the past decade, a number of multi-objective evolutionary algorithms (MOEAs) have been suggested. The primary reason for this is their ability to find multiple pareto-optimal solutions in a single simulation. In this study one such multi-objective EA – a real coded “Non-dominated Sorting Genetic Algorithm with Elitism (NSGA-II) (deb et al., 2002).
In this paper a multi objective optimization case study for a nuclear power plant at the plant level is presented. PIE (Postulated Initiating Event) i.e. LOCA (Loss of coolant Accident) and MSLB (Main Steam Line Break) of a PWR has been considered for the analysis. And an optimization study has been done to decide the surveillance test interval, allowed outage time, the preventive maintenance period and the replacement/overhaul time of components, such that the risk (Cumulative CDF due to both the initiating event) and the cost of maintaining the required availability of the safety systems are optimized. The decision variables of STI, AOT, PM and the over-haul period for different systems and equipment chosen from the pareto-optimal front will be risk consistent.
2. PROBLEM FORMULATION
The multi-objective optimization of TS&M will be formulated by adopting the model of Risk and Cost as the objective functions to be minimized. TS&M are represented through appropriate parameters included within the models of risk and cost, which will be adopted as decision variables for the optimization process.
2.1 Risk Function
In a nuclear power plant the occurrence of a postulated initiating event with the unavailability of the mitigating safety systems may lead to Core Damage (CD) sate. The Core Damage frequency (CDF) can be defined as the risk associated with the operation of a Nuclear Power Plant (NPP). Thus the total such risk can be defined as
[
. . . .
]
n[
]
pn p
Risk
=
I E frequency
×
C D EventSequences
Here n extents to the number of initiating event and p extents to the number of core damage
(CD) event sequences. The risk associated with a particular initiating event r - can be defined
as:
[
]
r
. .
r. .
pp
Risk
=
I E frequency
×
∑
C D Event Sequences
[Eq. 2]The CD event sequences results due to the unavailability of a single or a group of mitigating safety systems. Thus the Riskr can be defined as a function of the I.E. frequency and the
unavailability of the mitigating systems i.e.
[
(
)
(
)...
(
)
(
)...
]
.
.
rr
I
E
frequency
U
x
U
x
U
x
U
x
Risk
=
×
i×
j+
i×
k [Eq. 3]U (x) – unavailability of mitigating system and i,j,k are for different mitigating systems.
The system unavailability model ( which can also be modeled as a risk function at a system level) is often formulated into the PRA adopting the rare event approximation, which is an upper bound, as follows (Henley et al., 1981).
)
(
)
(
x
u
x
U
j k jk
∑∏
≈
[Eq. 4]Where the sum in j extents to the number of Minimal Cut sets (MCS) after the reduction of the system structure function and the product in k extents to the number of basic events relevant to the corresponding MCS. In addition, ujk(x) is the unavailability associated with the basic
event k belonging to MCS j, which quantifies a given unavailability state of a safety component that depends on the vector of decision variables x. Consequently, quantification of the different contributions to the component unavailability is needed to derive the final risk function using Eq.(2-4), which, in turn, will be used as one of the objective functions. Thus by using only Eq.(4), we can write the risk function at the system level and using Eq.(2 or 3), we can formulate the risk function at the plant level for a particular initiating event.
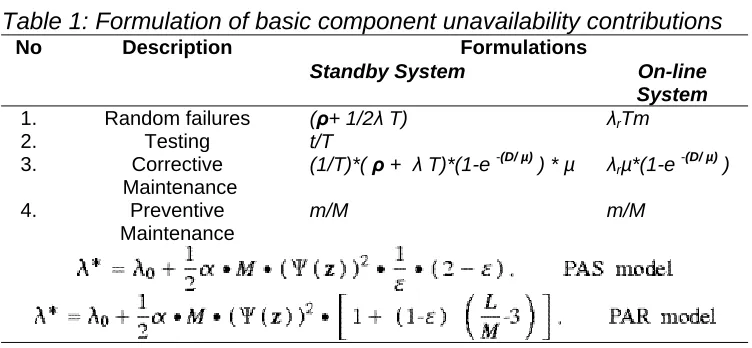
The unavailability contributions of a component normally in standby is divided into two categories : 1) unavailability due to random failures, named the reliability effect, and 2) unavailability due to testing and maintenance downtimes, named the downtime effect. In modern Npps some of the active safety system functions are combined with normal operation functions, with a view to increase functional reliability. In such cases the design provides full-fillment of safety functions with minimum number of changes of valves position. These models are presented in detail in (Martorell et al., 2002) and are summarized here in Table-1.
Table 1: Formulation of basic component unavailability contributions
FormulationsNo Description
Standby System On-line System
1. Random failures (ρ+ 1/2λ T) λrTm
2. Testing t/T
3. Corrective Maintenance
(1/T)*(ρ+ λ T)*(1-e -(D/ µ) ) * µ λrµ*(1-e
-(D/ µ)
)
4. Preventive Maintenance
ρ demand failure probability, λ standby failure rate, λr run-time failure rate, D allowed outage time, T surveillance test interval, t testing time, M preventive maintenance period, m
preventive maintenance time, µ mean time to repair, α linear aging factor, ψ(z) working
condition ε maintenance effectiveness, L overhaul period.
2.2 Cost Functions
The relevant costs in analyzing TS&M optimization of safety-related equipment include the contributions of on-line systems as well as the standby components, which undertake surveillance testing with period T, preventive maintenance with period M and corrective maintenance to restore their operability after a failure has been discovered during a test. Consequently, summing up the corresponding cost contributions of the relevant components to yield the cost model :
∑
=
i
x
c
x
C
(
)
i(
)
[Eq. 5]which will be used as the other objective function in the optimization problem. These models are presented in detail in (Martorell et al., 2002) and are summarized here in Table-2.
Table-2 : Formulation of basic cost contributions
Formulations No. DescriptionStandby System On-line System
1. Testing : (t/T) * Cht
2. Preventive Maintenance :
(m/M) * Chm (m/M) * Chm
3. Corrective Maintenance :
(1/T)*(ρ + λ T)*(1-e -(D/µ) ) *
µ * Chc
λr µ*(1-e
-(D/µ)
) * Chc
4. Plant Shut-down
(repair time exceeds AOT)
(1/T)*( ρ + λ T)*(e -(D/µ) ) *
Cu
λr *(e-(D/µ) ) * Cu
5. Overhaul Maintenance :
(1/L)*Cr (1/L)*Cr
Cht hourly cost for surveillance testing,Chm hourly cost for preventive maintenance,Chc hourly
cost for corrective maintenance, Cu cost for plant shut-down andCr total cost for overhaul,
3. EXAMPLES OF APPLICATIONS
In a nuclear power plant two of the most important postulated initiating events are (i) Loss of coolant accident (LOCA) and (ii) Main Steam Line Break (MSLB). In the case of LOCA borated cooling water is injected into the reactor core to remove the decay heat and to preserve core integrity by the emergency core cooling system ( active and passive systems). Similarly in case of MSLB the core cooling is ensured through the secondary side by actuation of Steam Generator Emergency Cool-Down (SG-ECD) system and Passive Heat Removal System (PHRS).
The multi-objective optimization study using evolutionary algorithm is carried out to under-stand the trade-off between the cost and unavailability of these safety systems individually and also the cost and risk trade-off, while considering the effect at the plant level. Thus for the system level the objective functions are formulated using the Eq.(4&5) and for the plant level using Eq.(3&5). For our case study, the risk function at the plant level has the following form:
Risk = RiskLOCA+ RiskMSLB --- [Eq. 6]
Risk = [ {I.E. frequencyLOCA} × {CD Event SequencesLOCA} +
{I.E. frequencyMSLB} × {CD Event SequencesMSLB} ] --- [Eq. 7]
3.1 System Modeling And Data
The system modeling consists of the active and passive safety systems and the underlying safety support systems. A train is assumed to consist of the front-line safety system and its support system. For the active systems the surveillance test interval, the allowed outage time and the preventive maintenance period are train specific and are chosen same for all the components in a train. It is also considered that during the preventive maintenance the entire train with all its components is under preventive maintenance. The over-haul period of the components is for the individual components. For a passive system the surveillance test interval and the preventive maintenance may need to coincide with the annual scheduled plant outage, and hence these values has to be forced as once per year.
The success/failure criteria of the above systems as defined by the safety analysis report are used and the fault tree analysis for generation of the Minimal Cut Sets (MCS) of these systems have been done using the computer software “Risk Spectrum”. The cut-off value for the Minimal Cut Sets (MCS) for the High Pressure Injection System, the Low Pressure Injection System, the Steam Generator Emergency Cool-Down system are taken as 3.85*10-11, 3.78*10-11 and 8.33*10-10 respectively.
The obtained Minimal Cut-sets have been used to define the two objective function based on risk and cost. The various component data required for the fault tree analysis are considered as per the Probabilistic Safety Analysis for Nuclear Power Plant guidelines. For considering the effect of ageing for all the components Proportional Age Reduction (PAR) model is used, though option exists for Proportional Age Set-back (PAS) model.
The component unavailability and the cost parameters as required in the formulations for the risk and cost functions modeling are given in Reference (Martorell et al., 1996; Martorell et al., 2002).
3.2 Decision Variables
Any solution to the optimization problem can be encoded using the following array of decision variables: X = {T, D, M, L1-n}. In this analysis it is considered that the T i.e.
Surveillance test interval, D i.e. Allowed Outage Time and M i.e. Preventive Maintenance Period. L1-n is the over-haul time of a components in the mitigating front-line systems and
support systems . The above decision variables can be bind by lower and upper bound to get a solution in the desired feasible domain. The bounding conditions lower bound and upper bound for the decision variables are considered as follows T(168,4032), D(72,720), M(4000,
16000) and L1-n(8000, 80000), all the above mentioned values are in hours. The current TS&M
requirement for the decision variables are as follows: X = {T=672, D=168, M=8000, L1-n =32000}.
4. EVOLUTIONARY ALGORITHM FOR MULTI OBJECTIVE OPTIMIZATION
been shown in the use of evolutionary optimization algorithm for finding multiple pareto-optimal solutions.
Evolutionary Algorithms (EAs) mimic natural evolutionary principles to constitute search and optimization procedures in a variety of ways. Genetic Algorithms (GAs) are search and optimization algorithms inspired by the principles of natural evolutionary principles. Conceived by John Holland in the early sixties, GAs have enjoyed a number of applications and developments. One of the niches of GA’s application domains is in the field of multi-objective optimization, where instead of one multi-objective the problem is faced with number of conflicting objectives.
Over the past decade, a number of multi-objective evolutionary algorithms (MOEAs) have been suggested (Horn et al., 1995; Srinivas et al., 1995). The primary reason for this is their ability to find multiple pareto-optimal solutions in a single simulation. In this study one such multi-objective EA – a real coded “Non-dominated Sorting Genetic Algorithm with Elitism (NSGA-II) (Deb, 2001; Deb et al., 2002) is used and is discussed in the following sections.
4.1 NSGA-II Solution Algorithm
The Non-dominated Sorting Genetic Algorithm or NSGA-II procedure (Deb, 2001; Deb et al., 2002) for finding multiple pareto-optimal solutions in a multi-objective optimization problem has the following three features:
It emphasis the non-dominated solutions
It uses an explicit diversity preserving mechanism It uses an elitist principle
In NSGA-II, the initial population (Pt) of size N is randomly created within the feasible
boundary for each decision variables. Then the offspring population Qt is created by using the
parent population Pt. The parent and the child population are then combined to form Rt of size 2N. Then, a non-dominated sorting is used to classify the entire population Rt. Although this
requires more effort compared to performing a non-dominated sorting on Qt alone, it allows a
global non-domination check between both the parent and child solutions. Meaning the elitism in the solution set is preserved. Once the non-dominated sorting is over, solutions of different dominated fronts, one at a time fill the new population. The filling starts with the best non-dominated front and continues with the solutions of the second non-non-dominated front, followed by the third non-dominated front, and so on. Since the over-all size of Rt is 2N, not all fronts
may be accommodated in N slots available in new population. All fronts, which could not be accommodated, are simply deleted. When the last front is being considered there, may exist more solutions in the last front than the remaining slots in the new population. Then instead of arbitrarily discarding some members from the last front, it would be wise to use niching strategy to choose the members of the last front, which reside in the least crowded region in that front.
4.1.1 Crowded Tournament Selection Operator
A solution i win a tournament with solution j if any of the following conditions are true: If solution i has a better rank, that is, ri < rj.
If they have the same rank but solution i has a better crowding distance than solution j, that is , ri = rj and di > dj.
The first condition makes sure that the chosen solution lies on a better non-dominated front. And the second condition resolves the tie of both solutions being on the same non-dominated front by deciding on their crowded distance. The one residing in a less crowded area (with a large crowding distance) wins.
4.1.2 Crowding Distance
perimeter of the cuboid formed by using the nearest neighbors as the vertices. The crowding distance di can be calculated by several ways, in this study a crowding distance metric (Deb,
2001), which requires O(MN logN) computations is used. The other methods have O(MN2)
complexity.
4.1.3 Cross-Over Operator
Since the design variables take any real number, a real-coded genetic algorithm is used in this study. In a real coded GA, variables are not coded in binary strings instead GA operators are directly applied on the real numbers. Although any selection operators can be used, specialized crossover and mutation operators are used to effectively create offspring solutions from parent solutions. In this study, we use Simulated Binary Crossover (SBX) and a parameter-based mutation operator (Deb et al., 2002).
5. RESULTS AND DISCUSSIONS
The multi objective optimization at the system level has been studied for the unavailability vs the cost/hr of maintaining the system. The decision variables are the surveillance test interval, the allowed outage time, the preventive maintenance period and the overhaul time of various components appearing in the minimal cut sets (mcs). The pareto-optimal solution for the active HPSI system, LPSI systems and SG-ECD are given in figure-1, 2 and 3 respectively. The implications of the cost and unavailability for meeting the current Technical Specification requirement are also plotted in the same figures. From the figures it is seen that the current Technical Specification requirements for the maintenance of the systems are not cost and risk consistent. It is observed that the present requirement is very much away from the pareto optimal front and lot of scope exists for making the resource allocation more risk consistent. The decisions variables can be chosen by the utility from the set of pareto-optimal solutions for the given minimum unavailability requirement. The pareto-optimal solution for the passive HA-I and HA-II systems are shown as points as the decision variables are imposed because of their configuration in the NPP.
0 0.5 1 1.5 2 2.5 3 3.5
0 5 10 15 20 25 30
Unavailability (* 10 E -6) year/year ---->
C
o
st $/
h
r --->
HPSI Pareto Front HPSI Current TS
Figure-1: Pareto optimal
solution
0.0 0.5 1.0 1.5 2.0 2.5 3.0 3.5
0.0 5.0 10.0 15.0 20.0 25.0
Unavailability (* 10 E -6) year/year ---->
Cost $/hr --->
LPSI Pareto Front LPSI Current TS
0.00 1.00 2.00 3.00 4.00 5.00 6.00 7.00
1.739 1.74 1.741 1.742 1.743 1.744 1.745 1.746 Risk ( CDF * 10 E - 9) /year ---->
C
o
st
$/
hr --->
Pareto Optimal Front Current TS
Figure-3 Pareto optimal solution fo
SG-ECD and current TS results
solution for Risk vs Cost and
Figure-4: Pareto optimal
The multi objective optimization at the plant level for the risk vs. cost/hr of maintaining the risk level due to a particular initiating event LOCA and MSLB are given in figure-4&5 respectively. The risk vs. cost plot by the combining the contribution of LOCA and MSLB is given in figure-6. The implications of the cost and risk for meeting the current technical specification requirement are also plotted in the same figures. It is seen that though the risk level at the current TS requirement are maintained at a desired level but there is enough scope to reduce the cost. The current TS requirements are not risk consistent and are far of from the Pareto optimal solutions. Thus the plant level risk vs. cost optimization suggests redistribution of allocation of resources (Decision Variables) in terms of STI, AOT, PM frequency for different systems and overhaul time of equipment to be risk consistent.
Figure-6 Risk vs Cost Pareto
optimal solution and current TS
for MSLB & LOCA considered
together
Figure-5 Risk vs Cost Pareto
optimal solution and current TS
for MSLB
6. CONCLUSIONS
The TS&M requirements for increasing the system availability and for minimizing the risk due to the probable postulated initiating events have brought a growing interest to focus on multi objective optimization in the context of the use of PRA for risk-informed applications and better safety management of NPPs. The multi objective optimization of the TS&M requirements of a NPP based on risk and cost, gives the pareto-optimal solutions, from which the utility can pick its decision variables suiting its interest. All of the optimized TS&M parameters in the example of application represent practical alternatives that can be implemented in a NPP under a real situation for a better safety management of the NPPs. The decision variables of STI, AOT, PM and the over-haul period for different systems and equipment chosen from the pareto-optimal front will be risk consistent. The evolutionary algorithm has proved to be very efficient in arriving at the optimal solutions in a reasonably small number of generations.
Deb, K., and Agarwal, R.B., (1995), Simulated binary crossover for continuous search space, Complex Systems Vol.9, pp.115-148.
Deb, K., (2001), “Multiobjective Optimization Using Evolutionary Algorithms”. Wiley, Chlchester, UK.
Deb, K., Agarwal, S., Pratap, A., and Meyarivan, T., (2002), A fast and elitist multi-objective genetic algorithm: NSGA-II, IEEE Transactions on Evolutionary Computation, Vol.6 (2), pp.182-197.
Harunuzzaman, M., and Aldemir, T., (1996), Optimization of standby safety system maintenance schedules in nuclear power plants. Nuclear Technology, Vol.113 pp. 354. Henley J, Kumamoto H. (1981), Reliability Engineering and Risk Assessment. Englewood
Cliffs, NJ: Printice-Hall.
Horn, J., Nafploltis, N., and Goldberg, D.E., (1994). A niched pareto genetic algorithm for multi-objective optimization. Michalewicz, Z, editor, proceedings of the 1st IEEE Conference on Evolutionary Computation, pp. 82-87, Piscataway, Newjersy.
Levitin, G., and Lisnianski, A., (1999), Joint redundancy and maintenance optimization for multistage series-parallel systems. Reliability. Engineering and System Safety Vol.64 pp. 33. Martorell, S., Serradell, V., Verdu, G., Fragio, R., Sanchez, A., Martinez, M.L., Gil, S., and
Izquierdo, J.A., (1996), Maintenance optimization by using PSA results in the RCM context. IAEA-TECDOC-873, pp.257.
Martorell, S., Sanchez, A., Carlos, S., and Serradell, V., (2002), Simultaneous and Multi Criteria Optimization of TS requirements and Maintenance at NPPs, Annals of Nuclear energy Vol.29, pp.147-168.
Muñoz, A., Martorell, S., and Serradell, V., (1997), Numerical absolute and constrained optimization of maintenance based on risk and cost criteria using genetic algorithms, Proceedings of Advances in Safety and Reliability, ESREL'97. Lisbon, pp. 1749.
Painton, L., and Campbell. J., (1995), Genetic algorithms in optimization of system reliability. IEEE Transactions on Reliability Vol.44 (2) pp. 172.
Risk Spectrum Manual (2000).
Srinivas, N., and Deb, K., (1995),Multi-objective function optimization using non-dominated sorting genetic algorithms. Evolutionary Computation, Vol.2 (3), pp.221-248.
V aurio, J.K., (1995), Optimization of test and maintenance intervals based on risk and cost. Reliability Engineering and System Safety Vol. 49, pp. 23.
Vesely, W., (1999), Principles of resource-effectiveness and regulatory-effectiveness for risk-informed applications: reducing burdens by improving effectiveness. Reliability. Engineering and System Safety, Vol.63, pp. 283.