ABSTRACT
WANG, GUAN. Synthesis and Application of Bleach Activators Containing Various Cationic Groups and PET Fabric Decolorization using Fenton’s Reagent. (Under the direction of Dr. David Hinks.)
CBAs are quaternary ammonium salts (QAS) that are extensively used in various applications. Although most of the QAS are generally believed to be nontoxic to humans, they will harm aquatic life both animals and plants. CBAs are applied in textile bleaching process and the wastewater after bleaching contains chemicals including bleach activators. Even though wastewater contains CBAs will be treated in a wastewater treatment plant, the treated water still contain these chemicals. The study of acute toxicity and genotoxicity of CBAs to aquatic organisms was conducted in this study. Eight new bleach activators and two bench mark cationic bleach activators were investigated. New invented cationic bleach activator 3-PBBC is 86 times less toxic in the Daphnia sp. Immobilization Test, 18 times less toxic in Algae Toxicity assay and 10 times less mutagenic in the Salmonella/microsome microsuspension assay in comparison with the benchmark product (TBBC). This confirmed that replacing the cationic group in CBAs using low toxicity ammines can reduce the toxicity of CBAs to aquatic organisms.
bleaching process has lower environmental impacts than conventional method. It consumes less electricity, steam, water, and process time by modifying the conventional bleaching process.
Polyester (polyethylene terephthalate; PET) fibers now exceed cotton as the largest volume textile substrate in commerce, owing to their economy, strength, and versatility. Unlike cotton, PET fibers are not readily biodegradable, leading to their persistent if placed in a landfill environment following their useful lifetime. The modern-day corporate commitment to product stewardship has led to considerable interest in the recycle/reuse of textiles derived from synthetic fibers such as PET. It is generally recognized that the key step in the recycling process is color removal. Fenton’s chemistry was used in the present investigation as an approach to decolorizing PET fabrics containing a variety dye structural types, providing an indication of the versatility of this method. A full factorial design of experiments was used to establish the amount of FeSO4 and H2O2 needed to optimize fabric decolorization. In this study, an optimized method consisting of FeSO4 (0.18 mM), H2O2 (1235 mM), and water: acetone (1:1), at 120 oC, for 15 min was found suitable for color removal from most PET fabrics.
Synthesis and Application of Bleach Activators Containing Various Cationic Groups and PET Fabric Decolorization using Fenton’s Reagent
by Guan Wang
A dissertation submitted to the Graduate Faculty of North Carolina State University
in partial fulfillment of the requirements for the Degree of
Doctor of Philosophy
Fiber and Polymer Science
Raleigh, North Carolina 2015
APPROVED BY:
_______________________________ _______________________________ Dr. David Hinks Dr. Harold S. Freeman Committee Chair
ii DEDICATION
iii BIOGRAPHY
Guan Wang, the only son of Sifeng Wang and Ying Wang, was born on January 4th, 1989 in Zhejiang, China. He graduated from Huzhou High school in June, 2007, and received a Bachelor of Engineering degree in Textile Engineering from Donghua University, Shanghai, China in June 2011. In undergraduate study, he conducted research on 3D-weaving ramie polypropylene enforced composite under the guidance of Dr. Yiping Qiu. He was one of the Donghua “3+X” program students who took three years to complete the B.S. degree and then entered the Master of Science in Textile Chemistry in the College of Textiles at North Carolina State University in August, 2010. After he got Master of Science degree in Textile Chemistry in May, 2012, Guan continue his education and studied for his Doctor of Philosophy degree in Fiber and Polymer Science under the direction of Dr. David Hinks.
iv ACKNOWLEDGMENTS
Firstly, I would like to express my sincere gratitude to my advisor Dr. David Hinks for the continuous support of my Ph.D study and related research, for his patience, motivation, and immense knowledge. His guidance helped me in all the time of research and writing of this dissertation.
This dissertation could not be written to its fullest without Dr. Harold S. Freeman, who challenged and encouraged me throughout my time spent studying under him. He would have never accepted anything less than my best efforts, and for that, I thank him. Besides, I would like to thank the rest of my dissertation committee: Dr. Peter J. Hauser and Dr. Joseph F. DeCarolis, for their insightful comments and encouragement, but also for the hard question which incented me to widen my research from various perspectives.
Also I thank my friends. Thank you so much for your time, your support, your well wishes and friendship.
v TABLE OF CONTENTS
LIST OF TABLES ... ix
LIST OF FIGURES ... xi
LIST OF SCHEMES ... xi
Chapter 1 Introduction... 1
1.1 Dissertation Outline ... 1
1.2 Research Objectives ... 2
Chapter 2 Literature Review ... 3
2.1 Natural color contents in cotton ... 3
2.2 Peroxide-based bleaching ... 4
2.3 Bleach activators ... 6
2.3.1 Cationic Bleach Activators ... 9
2.3.2 Synthesis of cationic bleach activators process ... 14
2.3.3 Environmental properties of cationic compounds ... 15
2.4 Structure analysis ... 19
2.4.1 Time-of-flight mass spectrometry ... 19
2.4.2 High-performance liquid chromatography ... 19
2.4.3 NMR spectroscopy... 20
2.5 Whiteness Measurement ... 21
2.6 Whiteness ... 21
2.7 The physical and chemical assesment of color ... 22
2.7.1 Visible reflectance spectroscopy ... 26
2.7.2 Color strength... 27
2.8 History of colors and dyes ... 28
2.9 Dyes in wastewater ... 36
2.10 Dye wastewater treatment ... 37
2.10.1 Adsorption and other physicochemical methods ... 37
2.10.1.1 Inorganic adsorption systems ... 37
Carbon-based inorganic adsorption agents ... 37
Other inorganic adsorption agents ... 38
2.10.1.2 Organic adsorption agents ... 39
vi
2.10.2.1 Ozonation... 40
2.10.2.2 Oxidation with UV/H2O2 ... 42
2.10.2.3 Fenton’s process ... 43
a. Effect of pH ... 44
b. Effect of H2O2 ... 44
c. Effect of Fe(II) sulfate level ... 45
2.11 Polyethylene terephthalate (PET) ... 45
2.11.1 PET synthesis ... 47
2.11.2 Recycled PET... 48
2.11.2.1 Conventional recycling processes ... 49
2.11.3 PET dyeing... 50
2.11.4 PET decolorization... 50
2.11.4.1 PET fiber and fabric ... 50
2.11.4.2 PET plastic ... 53
2.12 Life-cycle assessment ... 55
Chapter 3 The toxicity of cationic bleach activators. ... 57
3.1 Introduction ... 57
3.2 Experimental ... 60
3.2.1 Chemicals and media ... 60
3.2.2 Daphnia sp. Immobilization Test ... 61
3.2.2.1 Culture of aquatic organisms ... 61
3.2.2.2 Experiment design ... 61
3.2.3 Algae Toxicity assay ... 62
3.2.3.1 Culture of aquatic organisms ... 62
3.2.3.2 Experiment design ... 62
3.2.4 The Salmonella/microsome assay ... 63
3.2.4.1 Sample preparation ... 63
3.2.4.2 Experiment design ... 63
3.2.4.3 Data evaluation and potencies ... 64
3.3 Results ... 64
3.3.1 Daphnia sp. Immobilization Test ... 64
3.3.2 Algae Toxicity assay ... 67
vii
3.4 Conclusion ... 70
Chapter 4 A comparative life cycle assessment for bleaching process of cotton. ... 71
4.1 Introduction ... 71
4.2 Methods... 72
4.2.1 Goal and scope ... 72
4.2.1.1 Functional unit ... 73
4.2.1.2 System boundaries ... 73
4.2.2 Data collection and LCI analysis ... 75
4.2.3 Impact assessment ... 77
4.2.3.1 Normalization and weighting ... 79
4.3 Results and Discussion ... 80
4.3.1 Inventory analysis ... 80
4.3.2 Life cycle impact assessment ... 81
4.3.2.1 Comparative analysis ... 81
4.3.2.2 Contribution analysis ... 82
4.3.2.3 Normalization ... 86
4.3.3 Sensitivity and uncertainty analysis ... 88
4.4 Discussion ... 90
4.5 Conclusions ... 90
Chapter 5 Decolorization of colored PET using Fenton’s reagent in solvent/water solution ... 91
5.1 Introduction ... 91
5.2 Experimental ... 95
5.2.1 Materials ... 95
5.2.2 PET fabric dyeing ... 95
5.2.3 Decolorization experiments ... 96
5.2.4 Full factorial design of experiments ... 97
5.2.5 Effect of FeSO4, H2O2 and solvent ratio ... 98
5.2.6 Decolorization efficiency on different dyes ... 98
5.2.7 UV-Vis measurements ... 99
5.2.8 Reflectance and color strength ... 99
5.2.9 Analysis of bath residuals ... 100
viii
5.3 Results and discussion ... 100
5.3.1 Full factorial design of experiments (FFD) ... 100
5.3.2 Effects of FeSO4, H2O2 and solvent ratio ... 104
5.3.3 Decolorization efficiency on different dyes ... 109
5.3.4 TEM, EDS and XPS analysis... 120
5.3.5 Polymer degradation ... 122
5.4 Conclusion ... 123
Chapter 6 A life-cycle assessment case study of post-consumer PET fabric-to-fiber recycling ... 125
6.1 Introduction ... 125
6.2 Methodology ... 126
6.2.1 Goal, functional unit and system boundary ... 126
6.2.1.1 Goal and functional unit ... 126
6.2.1.2 System boundary ... 126
6.2.2 General data and assumptions ... 129
6.2.3 Environmental impact assessment ... 131
6.2.4 Normalization and weighting ... 131
6.3 Recycling PET garments into fiber ... 133
6.3.1 Collection of used PET fabric ... 133
6.3.2 PET fabric decolorization ... 133
6.3.3 PET recycling... 134
6.3.3.1 Semi-mechanical recycling ... 134
6.3.3.2 Chemical recycling ... 135
6.4 Life-cycle assessment results ... 135
6.4.1 Comparative analysis ... 135
6.4.2 Contribution analysis ... 139
6.5 Discussion ... 144
6.6 Conclusion ... 144
Chapter 7 Conclusions and Recommendations for Future Research ... 146
ix LIST OF TABLES
Table 2.1 Summary of main components present in raw cotton fibers ... 3
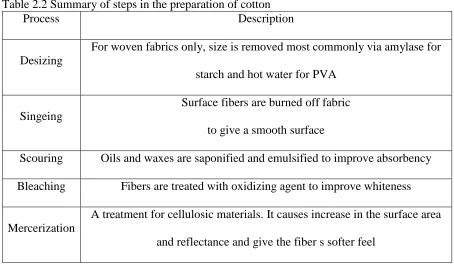
Table 2.2 Summary of steps in the preparation of cotton ... 4
Table 2.3. Toxicity classes: hodge and sterner scale ... 17
Table 2.5. Chromaticity coordinates for the CIE standard illuminant and source used ... 21
Table 2.6. Classification of Dyes [93] ... 31
Table 3.1. EC50 values of each substance tested in D. similis acute toxicity test. ... 65
Table 3.2. The GHS criteria for classification of a substance in acute categories ... 66
Table 3.3. Algae toxicity test.results expressed in inhibition concentration 50%, 72h (IC50) for the selected chemicals ... 67
Table 3.4. The GHS criteria for classification of a substance in chronic categories ... 67
Table 4.1. Impact categories used in impact assessment ... 78
Table 4.2. Normalization factors for all impact categories analyzed ... 79
Table 4.3. Product flows for manufacture of dyed cotton fabric products through conventional and bleaching process... 81
Table 4.4. Comparative LCIA results associated with conventional and modified new bleaching process ... 82
Table 5.1. Factor levels used in DOEs ... 97
Table 5.2. FeSO4, H2O2 and water: acetone levels used ... 98
Table 5.4. Conditions and testing results of the FFD with actual levels of factors for decolorizing Basic Yellow 28 (0.75 owf) on cationic dyeable PET ... 101
Table 5.5 ANOVA summary for the full factorial LS model ... 102
Table 5.6 Parameter estimates (Adjusted R2 = 0.8912). ... 103
Table 5.7 The color coordinates of the original dyed fabric and fabric after decolorization. ... 108
x Table 6.1. Product systems in this study, comparing type of fiber, property and application
... 126
Table 6.2. Data and assumptions in this study ... 130
Table 6.3. Impact categories used in impact assessment ... 131
Table 6.4. Normalization factors for all impact categories analyzed ... 132
xi LIST OF FIGURES
Figure 2.1. Proton NMR resonance signals of 3,5-dimethylbenzoic acid ... 20
Figure 2.2. UV-visible spectrum of blue and yellow dye solution ... 24
Figure 2.3. Same yellow dye solution with different dye concentration ... 25
Figure 2.4. UV-visible spectrum of two yellow dye solution with different brightness. ... 26
Figure 2.5. Reflectance spectrum of yellow and red fabric. ... 27
Figure 2.5. Structure comparison between compounds resulting from PET depolymerization process... 49
Figure 2.6. Life Cycle Stages [154] ... 55
Figure 3.1. EC50, 48h in mg/L-1 of each substance tested in D. similis acute toxicity test and the respective confidence interval of 95%. ... 66
Figure 4.1. System map for the conventional bleaching process. Two processes were considered within the system boundary, including bleaching and rinsing & neutralizing. For each process, chemicals, water, energy (electricity and steam) and other material consumption were indicated as inputs ... 74
Figure 4.2 System map for the modified new bleaching process. One process was considered within the system boundary. In contrast to the conventional method, the rinsing & neutralizing process after bleaching was eliminated since neutral pH was used for bleaching ... 75
Figure 4.3(a-g). Results of contribution analysis for conventional and modified new cotton wet processing ... Error! Bookmark not defined. Figure 4.4. Normalized impacts of all categories for conventional and modified new bleaching process ... 87
Figure 4.5. Normalized impacts of conventional and modified new wet processing with the same assumed weight loss (5%) during bleaching ... 89
Figure 5.1. Structures of dyes used in PET decolorization studies ... 94
Figure 5.2. Schematic of the dyeing procedure employed for cationic dyeable PET. ... 96
Figure 5.3. PET fabric decolorization procedure used in this study. ... 97
xiii LIST OF SCHEMES
Scheme 1. Reaction of TBBC with H2O2 to produce a cationic peracid. ... 12
Scheme 2. A proposed sorption-activation peroxide bleaching model for TBBC [20]. ... 13
Scheme 3. Process for making 4-chloromethyl benzoyl lactam ... 14
Scheme 4. Process for making the lactam based bleach activator. ... 14
Scheme 5. Free radical generation by ozone. ... 41
1 Chapter 1 Introduction
1.1 Dissertation Outline
2 1.2 Research Objectives
1. Obtain the toxicity data of the new bleach activators and compare it with toxicity of TBBC.
2. The life cycle assessment comparison between cotton fabric bleached with TBBC-activated H2O2 system and conventional rapid bleaching will be conducted. The environmental impacts of novel bleaching method will be studied.
3. Develop a novel solvent-based Fenton’s reagent process for PET fabric decolorization method. This method should be used to decolorize PET fabric efficiently. In order to get recyclable PET after decolorization, the differences of degree of polymerization between untreated PET and decolorized PET will be measured.
4. Optimize the recipe of Fenton’s reagent process for PET decolorization. A full
factorial design of experiments will be made for obtaining the key factors and the best processing condition. The factors could be: Fenton’s reagent concentration; treatment time and temperature; liquor to goods ratio; pH.
5. Study the feasibility of the optimum decolorization process on fabric colored by different types of dyes. Three dye categories: Azo, Nitro and Anthraquinone will be used.
3 Chapter 2 Literature Review
2.1Natural color contents in cotton
Cotton is the most widely used natural fiber by far, owing to its perceived comfort, relatively low cost, bright hues and good fastness properties when dyed. It is grown and processed into commercial products in various locations throughout the world. Approximately 116.7 million of 480 lb bales of cotton were processed in 2013/14 [1].
Table 2.1 shows the main components present in cotton [2]. Most of the content is cellulose and the other contents that may affect dyeing and finishing process take up around 1%.
Table 2.1 Summary of main components present in raw cotton fibers Components Percentage
Cellulose 91.00%
water 7.85%
Protoplasm,pectins 0.55% Waxes, fatty substances 0.40%
Mineral salts 0.20%
4 but are left in a whitened state. Table 2.2 shows the primary stages of preparation for cotton [3].
Table 2.2 Summary of steps in the preparation of cotton
Process Description
Desizing
For woven fabrics only, size is removed most commonly via amylase for starch and hot water for PVA
Singeing
Surface fibers are burned off fabric to give a smooth surface
Scouring Oils and waxes are saponified and emulsified to improve absorbency Bleaching Fibers are treated with oxidizing agent to improve whiteness
Mercerization
A treatment for cellulosic materials. It causes increase in the surface area and reflectance and give the fiber s softer feel
2.2 Peroxide-based bleaching
Whiteness is one of the major properties of fabrics in textile industry. It is very important not only for daily application but also for post processing of textile such as dyeing and finishing. However the impurities remaining in most of the textile materials will cause white
appearance detraction [4-7]. Bleaching is a key process used to remove colored impurities present in natural fibers such as cotton, ramie, and wool. Bleaching may be performed using a continuous or batch process [8]. A rapidly process performed at elevated temperature and a relatively slow process at room temperature are two common methods used in textiles
5 using H2O2 and sodium perborate (NaBO3·nH2O) [16]. Of these, H2O2 is the most
commonly used in diluted form (e.g. 35% w/w), owing to its very low cost, abundance, and ease of application from a solution.
H2O2 is a weak acid that exists in equilibrium with its conjugate base, as shown in Equation 3.
H2O2 H+ + HOO- (3)
In order to shift the equation to the right so that the perhydroxyl anion is established in high concentration, alkaline conditions are required, typically in the range pH 10.5-12 [12]. The perhydroxyl anion destroys many impurities via oxidation in substrates, although the exact mechanism is unclear [13-15].
Rapid bleaching is undertaken at relatively high pH and at elevated temperatures, typically 95°C or even higher to obtain better whiteness. These conditions consume significant amounts of energy and lead to reduction of fiber strength up to approximately 10% [11], via reduction in degree of polymerization. Furthermore, neutralization of the alkaline bleach bath is required at the end of the process, which generates electrolytes that have a negative environmental impact. In large dyeing and finishing mills, the effluent must be treated in lagoons prior to discharge to receiving waters. Hence, conventional bleaching is significantly costly.
6 method of bleaching textiles during the manufacturing process is the use of so-called bleach activators.
2.3 Bleach activators
Bleach activators are compounds with O- or N-bounded acetyl groups which are able to react with the perhydroxyl anion to yield a peroxy acid functional group. Since 1970 sodium perborate has been used as a bleaching compound in European laundry detergents. Sodium perborate decomposes rapidly in aqueous solution to yield H2O2, as shown in Equation 4.
(4)
Sodium perborate by itself is active at temperatures above 80°C, but less so at 40-60°C. Hence, the bleach activators in the presence of which sodium perborate acts as a bleaching agent already at temperatures below 80°C were developed [21].The peroxy acid is decomposed in weakly basic media in a bimolecular reaction forming singlet oxygen[21], as shown in Equation 5.
(5)
7 nonanoylbenzenesulphonic acid (NOBS, 2), used mainly by The Procter & Gamble Company (P&G) in the US, Japan and certain other countries.
N
N
CH3
CH3
CH3
H3C
O O
O
O
1
H3C O
O
SO3Na
2
Cai et al. [30] reported a new class of bleach activators and their application in the textile bleaching process. The new activators are guanidine derivatives, in which at least one amine hydrogen atom is substituted with an alkyl or acyl group. Suitable acyl groups include the benzoyl, formyl and acetyl groups.
3 4 5 6
9 2.3.1 Cationic Bleach Activators
TAED and NOBS are anionic bleach activators, and have certain limitations considering the negative charge on cellulosic fibers. Compared to anionic bleach activators, cationic bleach activators have potential to exhibit better performance because they exhibit inherent substantivity to the negatively charged surface of cellulosic fibers in neutral to alkaline conditions to provide enhanced bleaching efficiency, especially in low temperature [27]. They can react with peroxide to produce a peracid. It is a stronger oxidative specie for bleaching compared to the perhydroxyl anion obtained from the ionization of H2O2 under alkaline conditions.
10 bleach performance. However, TBCC was found to be unstable in aqueous solution and the instability makes it hard to store for industry use.
N
N O O Cl
7
In order to improve the hydrolytic stability and bleaching performance, Lee et al. [25] synthesized, characterized and tested five cationic bleach activators containing lactam-based leaving groups of varying ring size. Their structures are listed below:
n=1, 2, 3, 4 and 5
11 TBBC has a similar structure to TBCC, except for the leaving group. The bleach mechanism for these cationic activators is the same, whiles the stability and, to a certain extent bleach performance of TBBC is better than TBCC.
TBCC (7) and TBBC (8) increase the reactivity of a H2O2 bleach bath by reacting with perhydroxyl anions (OOH-) to form a reactive peracid oxidant. It has potential to be a more effective bleaching system than H2O2 alone. A leaving group is expelled in the process. In TBCC, caprolactam is the leaving group while in TBBC, the butyrolactam is the leaving group. Incorporating a cationic group facilitates the potential inherent affinity for negatively charged substitutes in addition to water solubility. Scheme 1 shows the reaction of TBBC with H2O2 to produce a cationic peracid.
N
N O
Cl
O
13 Scheme 2. A proposed sorption-activation peroxide bleaching model for TBBC [20].
14 Sang-Hoon Lim et al. [28] reported and compared the bleaching performances of NOBS activated and TBCC activated peroxide system.
2.3.2 Synthesis of cationic bleach activators process
Lee et al. reported the synthesis method for making lactam-based cationic bleach activators [21]. The first step is to make the intermediate: 4-chloromethyl benzoyl lactam. Scheme 3 summarizes the process.
Scheme 3. Process for making 4-chloromethyl benzoyl lactam
In the second step the intermediate is reacted with triethylamine to get the final bleach activators: the 4-chloromethyl benzoyl lactam was dissolved in acetonitrile under argon and reacted with triethylamine. The solution was stirred under reflux for 4 hours then cooled to room temperature. The solvent was evaporated and the mixture was washed using acetone. Scheme 4 summarizes the process.
N
O
N O
Cl +
N Cl
CH3CN
(CH2)n
O
(CH2)n
O
15 2.3.3 Environmental properties of cationic compounds
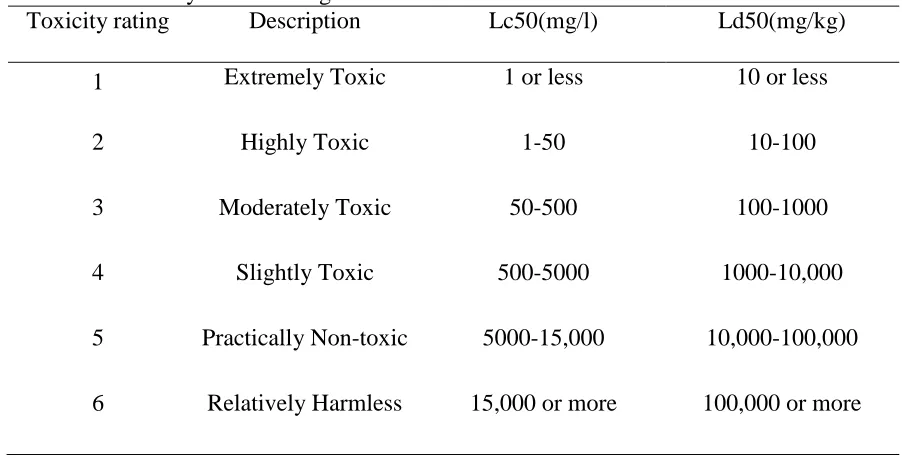
Toxicity is a key characteristic of all new compounds developed for commercial application. LC50 and LD50 are the two key indexes of toxicity. LC stands for “lethal concentration”, LC50 values refer to the concentration of a chemical that kills 50% of the test animals in a given time, such as 24h or 48h. LD stands for “Lethal Dose”. LD50 is the amount of a material, given all at once, which causes the death of 50% of a group of test animals. LD50 is one way to measure the short-term toxic potential of a material dose. Cationically charged compounds are often flagged by the US Environmental Protection Agency as being potentially toxic to aquatic organisms [159]. The cationic group in TBCC and TBBC is triethylamine, which is a toxic chemical. Additional research to discover reduced toxicity bleach activators may be necessary.
Bleach activators are consumed during bleaching and therefore cannot be recycled after use. The cationic chemical will exist in the waste water and it is important to minimize its the impact on the environment for industry use. The cationic groups in both TBCC and TBBC are triethylamine. Triethylamine is LC50 60mg/L and LD50 460mg/kg. Table 2.3 summarizes toxicity classifications of molecules. The toxicity rating of triethylamine is a rating of two, or highly toxic. Therefore, it is desirable to replace triethylamine with a low toxicity cationic group to help make the bleach activator more environmentally responsible. Table 2.4 shows several amine groups with relatively low toxicity. It is feasible that the toxicity of bleach activators may be decreased by replacing triethylamine with a low toxicity tertiaryamino group.
17 Table 2.3. Toxicity classes: hodge and sterner scale
Toxicity rating Description Lc50(mg/l) Ld50(mg/kg)
1 Extremely Toxic 1 or less 10 or less
2 Highly Toxic 1-50 10-100
3 Moderately Toxic 50-500 100-1000
4 Slightly Toxic 500-5000 1000-10,000
18 Table 2.4. Toxicity of selected tertiary amines
Name Structure Lc50(mg/l) Ld50(mg/kg)
Triethylamine N 600 460
Pyridine N 4000 866
1,4-Diazabicyclo(2.2.2)octane N N 1510-1980 1700
Nicotinamide
N NH2 O
1000 3500
3-Picoline
N 3300 400
19 2.4 Structure analysis
2.4.1 Time-of-flight mass spectrometry
Time-of-flight Mass Spectrometry (TOFMS) was first introduced by Wiley et al. in 1955 [38]. TOFMS can determine the mass-to-charge ratio (m/Q) of an ion via a highly accurately measured time measurement. In TOFMS, ions are accelerated by an electric field. The ions that have the same charge will have the same kinetic energy and the velocity of ion depends on the mass-to-charge ratio. The time that the ion subsequently takes to reach a detector at a known distance is measured. From this time and the known experimental parameters one can find the mass-to-charge ratio of the ion. Based on this technique, some other methods such as matrix-assisted laser desorption/ionization (MALDI), californiumplasma desorption, static secondary ion mass spectrometry (SIMS) [39-42] were developed and are now quite widely used. An important enhancement to mass spectrometry is combining it with chromatographic separation techniques. The chromatographic separation system will separate the components of a mixture first followed by ionization, and passing the components into the mass spectrometer’s analyzer for detection.
2.4.2 High-performance liquid chromatography
HPLC is a separation technique that involves a liquid mobile phase and a stationary phase. The mobile phase can be manipulated easily to accommodate a variety of chemical
compositions. In 1966, Horvath developed reverse-phase separations to high-performance liquid chromatography (HPLC) [43]. Reverse-phase HPLC is especially useful for
20 2.4.3 NMR spectroscopy
Nuclear magnetic resonance (NMR) is a physical phenomenon. It was first described and measured in molecular beams by Rabi et al. in 1938 [44]. NMR spectroscopy is one technique to obtain structural information on molecules. 1H is the most common element characterized in NMR analysis, because hydrogen is highly abundant and it is the nucleus most sensitive to a NMR signal. By studying the peaks of nuclear magnetic resonance
spectra, the structure of many compounds can be inferred. Figure 2.1 shows the proton NMR resonance signals of 3, 5-dimethylbenzoic acid. The proton in different location has different chemical shift value and the height of the signal represents the number of the proton at same location.
21 2.5 Whiteness Measurement
2.6 Whiteness
In colorimetry, whiteness is the degree to which a surface is perceived to be as white [47]. Whiteness is fundamentally an attribute of the human visual system of whose “color” is devoid of hues and grayness [11].
2.6.1 Whiteness index
In 1931, the CIE (the International Commission on Illumination) introduced the instrumental color measurement for specifying color numerically. All colors, including white, can be defined by tristimulus values. Whiteness index is a single scale of whiteness and allows users to identify and compare the level of whiteness of two or more objects, shown as Equation 8 [49].
WI CIE = Y + 800 (xn - x) + 1700 (yn - y) (8)
Where Y, x, y are the luminance factor and chromaticity coordinates of the specimen, and xn and yn are the chromaticity coordinates for the CIE standard illuminant and source used. These values are provided in the Table 2.5 below based on the illuminant and observer used. Whiteness Index can only be calculated for illuminants C, D50, and D65. Currently, no additional illuminants are incorporated into the standard.
Table 2.5. Chromaticity coordinates for the CIE standard illuminant and source used VALUE C/2° D50/2° D65/2° C/10° D50/10° D65/10°
22 2.7 The physical and chemical assesment of color
To see color, three things are required: a source of illumination, a human eye to observe the effect and an object to interact with the light which comes from this source [151]. And these three things are related to three natural science disciplines: physics, biology and chemistry.
Human experience colors though interpreting signal by brain. The signal comes from the optical nerve from the eyes in response to stimulation by light. Human eyes are only sensitive to light with a very narrow wavelength range 360-780 nm. Beyond this range extremes are the ultraviolet (UV) region (below 360 nm) and the infrared (IR) region (above 780 nm).
The most familiar nature light source is daylight. The daylight contains the complete visible wavelength range although the exact composition is variable. Tungsten lamps and fluorescent lights are two types of artificial illumination used as white light source in daily life. The composition of the light from these sources varies depending on the type of lamp. For example, tungsten lamp appear yellowish because the light it emits is deficient in the blue region of the spectrum. In this case, same object will have a different color under different illumination sources.
There are fifteen specific causes of color which can be collected into five groups [151]:
23 b) Color from ligand field effects: color from transition and metal compounds and from
transition metal impurities;
c) Color from molecular orbitals: color from organic compounds and from charge transfer;
d) Color from band theory: color in metals, in semiconductors, in doped semiconductors and from color centres;
e) Color from geometrical and physical optics: color from dispersion, scattering, interference and diffraction.
For dyes and pigments, color is generated by the mechanism described in group (c). In order to make sure dye and pigment have color, which means the light can interact with them, they must to able to absorb and scatter light. One substance can absorb light means that the radiant energy can raise its molecular to higher energy states. Scattering is occurred when light is re-directed as the results of multiple refractions and reflections. If only absorption happens, this substance will be transparent. If only scattering happens, the object will appear either translucent or opaque.
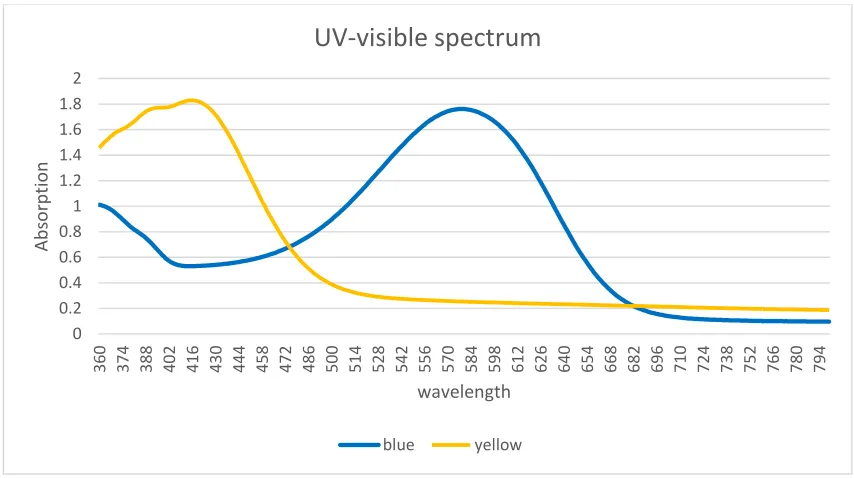
The color of dye is based on the wavelengths of visible light absorbed and the wavelengths of light reflected. There are various of ways to describe color in scientific terms. One useful method involves UV-visible spectroscopy. UV-visible spectra of dye solution can provide important information to enable relationship between the color and molecular structure of the dyes. UV-visible spectrum can define the color in three attributes: hue, strength and
24 and yellow dye solution. The λmax value of blue dye solution is around 584 nm and the λmax value of yellow dye solution is around 424 nm.
Figure 2.2. UV-visible spectrum of blue and yellow dye solution
The strength of the dye is given by the molar extinction coefficient (ε) at its λmax value. It can be obtained from UV-visible spectrum by using the Beer-Lambert Law, showed below: A=εcl
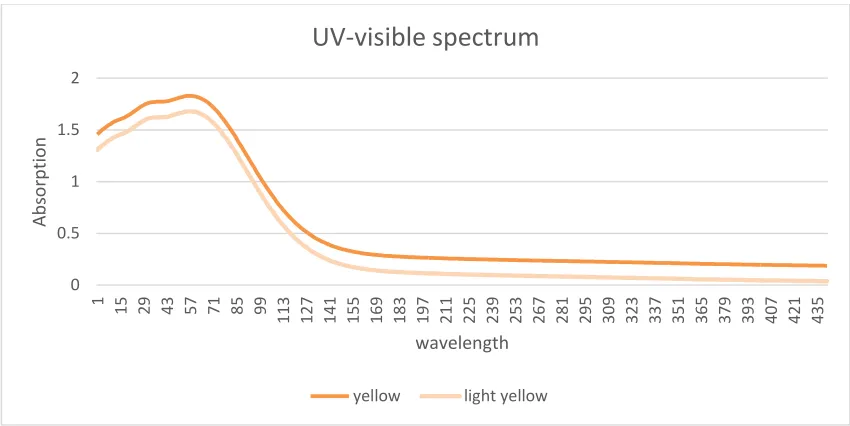
where A is the absorbance of the dye in a particular wavelength, ε is the molar extinction coefficient at that wavelength, c is the concentration of the dye and l is the path length of the cell used for measurement of the spectrum. Figure 2.3 shows two yellow dye solution with same hue but different color strength.
0 0.2 0.4 0.6 0.8 1 1.2 1.4 1.6 1.8 2
360 374 388 402 416 430 444 458 472 486 500 514 528 542 556 570 584 598 612 626 640 654 668 682 696 710 724 738 752 766 780 794
Ab
so
rp
tio
n
wavelength
UV-visible spectrum
25 Figure 2.3. Same yellow dye solution with different dye concentration
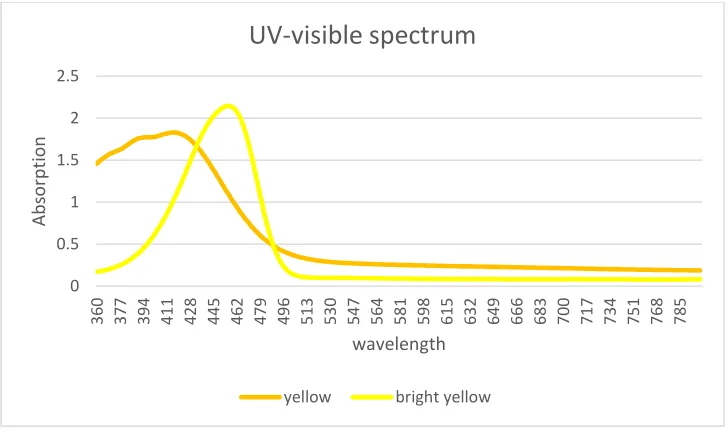
The brightness of color is characterized by the absence of wavelength of transmitted light. In terms of the UV-visible spectrum, the dyes with bright color show narrow absorption bands and broad absorption bands are characteristic of dull color. Figure 2.4 shows two yellow dye solution with different brightness.
0 0.5 1 1.5 2
1 15 29 43 57 71 85 99
113 127 141 155 169 183 197 211 225 239 253 267 281 295 309 323 337 351 365 379 393 407 421 435
Ab
so
rp
tio
n
wavelength
UV-visible spectrum
26 Figure 2.4. UV-visible spectrum of two yellow dye solution with different brightness.
2.7.1 Visible reflectance spectroscopy
Visible reflectance spectroscopy is used to measure the color of opaque object such as textile fabrics. For example, in Figure 2.5, a yellow color has the low
reflectance in the 400-500 nm but high reflectance of the yellow wavelengths (500-600 nm). And a red color has the low reflectance in the 400-(500-600 nm but high reflectance in 600-700 nm.
0 0.5 1 1.5 2 2.5
360 377 394 411 428 445 462 479 496 513 530 547 564 581 598 615 632 649 666 683 700 717 734 751 768 785
Ab
so
rp
tio
n
wavelength
UV-visible spectrum
27 Figure 2.5. Reflectance spectrum of yellow and red fabric.
2.7.2 Color strength
Kubelka developed numerous formulas for correlating reflectance with concentration by making scattering and surface difference corrections. It was found that the ratio of light absorption to light scattering at a given wavelength is proportional to the concentration of the dye in the sample. The theory works best for optically thick materials. The relationship shown here is derived from the Kubelka-Munk equation [152].
K/S=
(1−𝑅)
22𝑅
Where R= 1.0 at 100% reflectance; K is the absorption coefficient and S is the scattering coefficient.
Color strength is defined as:
Color strength = [(K/S) batch / (K/S) standard] × 100
0 20 40 60 80 100
400 420 440 460 480 500 520 540 560 580 600 620 640 660 680 700
28 2.8 History of colors and dyes
Colored substrnces such as minerals and oches have been used since ancient human history. Their uses ranged from decorating the body to painting on natural or constructed walls. The color they produced were quite stable and have survived for thousands of years.
Natural dyes used for textiles can be dissolved or dispersed in a medium and coloring the fiber or surface of a textile. Because ancient textiles are so biodegradable, few evidence of dyed fabric can be survived. The earliest record of natural dyes was made by Pliny the Elder, a 1st-centry AD Roman encyclopedist. He wrote that the Egyptian dyers used indigo, Kermes (source of red or purple, made from parts of the cochineal insect), archil ( a red-producing lichen, also called orchil or cudbear), alkanet (an herb whose root produces red), buckthorn berries and saffron (for yellow) [52]. Dyes were pretty precious in the ancient time because of their complex extraction process from nature materials and low yield. At that time, dyed fabric was only used by the wealthy.
In 18th and 19th centuries, dyeing developed from the boom in new research and processes. As the textile industry throughout Europe and America grew more mechanized, processes for dyeing fabric also evolved. Cotton became the most widely used material at that time but process for dyeing fabric with many color was complex and difficult.
29 production, and this led to periodic famines and revolts in regions of monoculture, such as the 1860-1867 Indigo War [53]
In 1853, William Henry Perkin, a 15-year-old Englishman discovered mauve (9) during the experiment in which he attempted to synthesize quinine from aniline. In 1856, he patented mauve which is the first synthetic dye in the world and began to manufacture it.
9
Many organic chemists such as Hofmann, Charles-Adolphe Wurtz and Emil Fischer also chose to develop and study the structures and properties of dyes. Currently, the dye manufacturing industry is declining in Europe and the United States. Much of the world market in synthetic colors is controlled by Japanese companies [52].
A dye is a colored organic compound comprised of two key components:
31 Table 2.6. Classification of Dyes [93]
Dye type Example Characteristics
I. According to chemical structure
1 Nitro dyes
Derivatives of phenols containing at least one nitro group ortho or para to the hydroxyl group
2 Azo dyes
The azo dyes represent the largest and the most important group of dyes. They are characterized by the presence of one or more azo groups (-N=N-), which form bridges between two aromatic rings.
3 Diphenylmethane dyes
32 Table 2.6. Continued
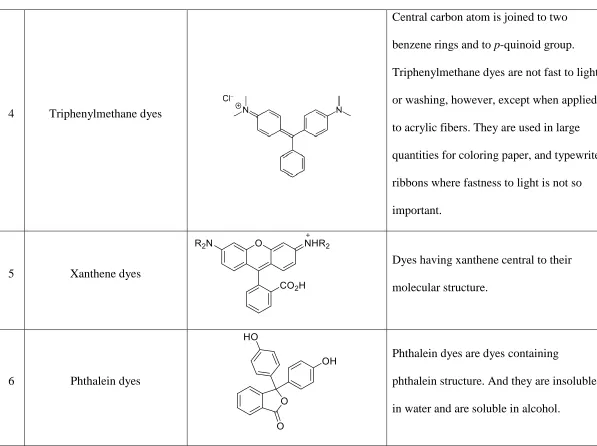
4 Triphenylmethane dyes
Central carbon atom is joined to two benzene rings and to p-quinoid group. Triphenylmethane dyes are not fast to light or washing, however, except when applied to acrylic fibers. They are used in large quantities for coloring paper, and typewriter ribbons where fastness to light is not so important.
5 Xanthene dyes
Dyes having xanthene central to their molecular structure.
6 Phthalein dyes
Phthalein dyes are dyes containing
33 Table 2.6. Continued
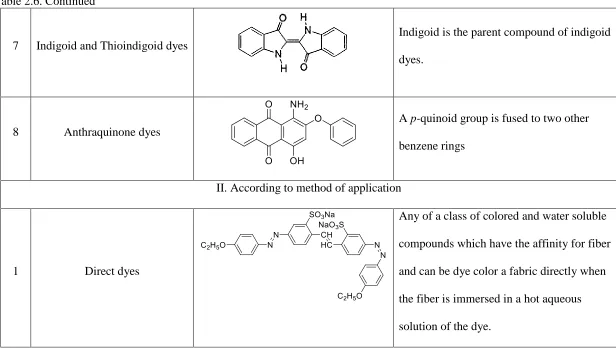
7 Indigoid and Thioindigoid dyes
Indigoid is the parent compound of indigoid dyes.
8 Anthraquinone dyes
A p-quinoid group is fused to two other benzene rings
II. According to method of application
1 Direct dyes
34 Table 2.6. Continued
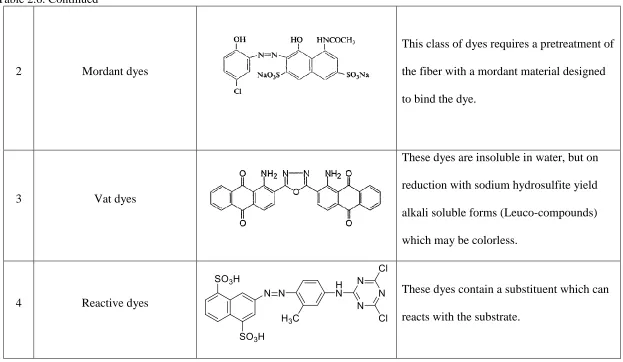
2 Mordant dyes
This class of dyes requires a pretreatment of the fiber with a mordant material designed to bind the dye.
3 Vat dyes
These dyes are insoluble in water, but on reduction with sodium hydrosulfite yield alkali soluble forms (Leuco-compounds) which may be colorless.
4 Reactive dyes
35 Table 2.6. Continued
5 Disperse dyes
36 2.9 Dyes in wastewater
The discovery of the synthetic dyes overwhelmed the role of natural dyes in the society due to its low production cost, brighter colors, better resistance towards
environmental factors (light, oxygen), and easy to apply factor [94]. Many industries like textiles, leather, cosmetics, paper, printing, plastics use synthetic dyes to color their products. Thus, effluents from these industries contain various kinds of synthetic dye. Over 100,000 commercially available dyes existed and more than 7 × 10⁵ t per year were produced in 2005 [95, 96]. It is reported that 10-15% of the used dyes enter the environment through wastes [97, 98]. Chemical oxygen demand (COD) and biochemical oxygen demand (BOD) are two approaches to environmental impact. Typically, the waste water coming from textile industry has COD ranging from 150 to 12,000 mg/L and BOD ranging from 80 to 6,000 mg/L. The BOD/COD ratio is around 0.25 which shows that it contains significant levels of
nonbiodegradable organic compounds [99].
For environmental and health reasons, dyes as well as the degradation products in the waste water from dyeing process should be removed before they reach the effluent stream going out to the discharge water supply. Significant amounts of dyes are lost during the dyeing process, with the actual values depend on the class of dyes. The overall average loss is 15% [149]. The dye effluent will discolor water and increase the BOD of the contaminated water, creating anoxic conditions which may be lethal to aquatic species.
37 removal and no evidence pointed to color toxicity, the issue of color removal standards received sporadic attention up until 1990’s [150].
A wide range of methods has been developed for removal of dyes from wastewater to decrease their impact on the environment. The methods can be generally classified in to three main categories: physical, chemical and biological treatment [100].
2.10 Dye wastewater treatment
2.10.1 Adsorption and other physicochemical methods
Adsorption methods can remove the color by simply adsorbing dyes from water and then change or destroy the dye chromophore [54]. However it cannot remove the residual dye completely, so the treated wastewater may still pose environmental problems.
2.10.1.1 Inorganic adsorption systems
Carbon-based inorganic adsorption agents
38 Other inorganic adsorption agents
Clays are widely used as catalysts, adsorbents and ion exchanges because of their low cost. Clay minerals such as kaolinite and montmorillonite are used as adsorbents for dyes [57]. It was reported that basic, acidic, disperse, direct and reactive dyes in the wastewater could be removed by the use of acid-activated clay. Basic dyes have the highest adsorption capacity and this agent was proposed for their removal from aqueous media [58]. At acidic pH, low temperature, small particle size of clay can increase the efficiency Omega Chrome Red ME (10) removal [59].
10
Silica and alumina were also used for removal of dyes in effluents [60-62]. Through the analysis of thermodynamical parameters, the adsorption of Rhodamine B, Acid Red 4 and Nile blue on alumina was found to be more favorable at high temperature. Adsorption
39 2.10.1.2 Organic adsorption agents
Organic adsorption agent mostly comes from the waste or by-product of industrial processes, which has no other commercial value. Compare with inorganic adsorption agent, its manufacturing cost is much lower or can be considered as no cost.
Biogas waste can be used for remove of Rhodamine B from the wastewater of a textile plant. The adsorption followed the Freundlich isotherm and the optimum pH was 2.3[63]. Chitosan was found to have high capacities for removal of anionic dyes such as direct yellow 4 [64]. Waste banana pith was used for the removal of Rhodamine B from aqueous solutions. At pH 4, it had the highest adsorption capacity, 84 % of the dyes were removed [65].
2.10.2 Chemical decolorization methods
Chemical decolorization methods are used to break down the dye structure through oxidation or reduction reactions. Table 2.7 contains some common agents for dyes
40 Table 2.7. Comparison of decolorization based on active oxygen species
Agent Advantages Disadvantages
NaOCl Simple equipment and process Rapid decolorization
Relatively high toxicity compared with other agent
Salt formation O3 Short reaction times
No salt and sludge formation
High equipment cost Not applicable for all dye types
No COD reduction Toxicity and hazard handing UV/H2O2
Short reaction time Reduction of COD No salt and sludge formation
Not applicable for all dye types Relatively high energy and equipment
cost
FeSO4/H2O2
Simple equipment and easy operation
Reduction of COD Increase of dissolved oxygen in
water
Long reaction time Salt and sludge formation
2.10.2.1 Ozonation
Ozonation has found application in the decolorization of synthetic dyes due to its effective oxidation process. It has been reported that ozonation is effective for azo dyes decomposition in textile wastewater. The decomposition rate was considerably higher at acidic pH, while the influence of temperature and UV light on the decomposition level was negligible [130]. The effect of ozonation on the toxicity of wastewater effluents has been investigated using the nematode Caenorhabditis elegans. The data indicated that the toxicity depended on the type of dye decomposed [131]. The influence of operating parameters on the decolorization of reactive orange 14 by ozone has been studied in detail. The results
indicated that the decomposition level increased with increasing pH and temperature [132].
41 Scheme 5. Free radical generation by ozone.
Ozone will rapidly decompose and yield hydroxyl radicals (2.8 V) which was reported by Lopez-Lopez et al [146], during ozonation of sulphonated some azo dyes.
Ozonolysis, the reaction of ozone with a carbon–carbon double bond (C=C), is well known. The C=C bonds are very attractive centers for addition reactions by ozone to yield reactive intermediates. Therefore, stoichiometric relationship may be considered between ozone and the double bonds. Kusvuran et al. [147] recently reported that relation between ozone and double bonds, C=C, C=N and N=N, in the decolorization study of some dyes (basic yellow 28, reactive black 5 and reactive red 198). Decolorization stoichiometry must be different from degradation stoichiometry since the double bonds may be still present in dye molecule after decolorization.
The ozone concentration in water is limited by its solubility and is inversely
42 concentration is constant and is related to the partial pressure and Henry’s constant [148]. The concentration of dissolved ozone can be written as:
P = KH [O3] (9)
where P is the partial pressure of ozone and KH is Henry’s constant of ozone. If it is written as a second-order kinetic equation, Eq. (10) is obtained:
-d[Dye]
dt = K[Dye][P/KH] (10)
2.10.2.2 Oxidation with UV/H2O2
Hydrogen peroxide is widely used for bleaching in the textile industry. It also can be used applied to the decolorization of synthesis dyes in effluent. The combinantion of UV light and H2O2 gives the hydroxyl radical (OH˙), the second most powerful oxidant after fluorine, which oxidizes and destroys dye structures. It can attack most organic molecules and is not highly selective [87, 88]. The hydroxyl radical produces new oxidized
intermediates with lower molecular weight or carbon dioxide and water in case of complete mineralization by abstracting a hydrogen atom or adding hydrogen atom to the double bonds [89].
UV light was the one of the agents used to initiate the process which produces OH˙ [66-68]. The Fenton reaction is a catalytic process for the generation of hydroxyl radicals
43 However, it is difficult to develop a general oxidation method for a mixture of dyes because the optimum method for decolorization is different for each dye. UV/H2O2 could be
successfully used for the decolorization of acid dyes, direct dyes, basic dyes and reactive dyes but it is not suitable for vat and disperse dye decolorization [69].
2.10.2.3 Fenton’s process
The Fenton process is widely studied and reported as an interesting method for the treatment of industrial wastewater containing nonbiodegradable organic pollutants [101]. The mechanism of organic compounds degraded by Fenton process is shown below [102-104]:
Fe2+ + H2O2 →Fe3+ +OH- + HO˙ (11)
RH + HO˙ → R˙ + H2O (12)
RH represents the dye
R˙ + Fe3+ → R+ + Fe2+ (13)
Fe2+ + HO˙ → Fe3+ + OH- (14)
Fe2+ ions can be regenerated by the reaction between Fe3+ ion and H2O2 (Eqs. (15) and (16)) under acidic condition [105-107]. These reactions make Fe2+ can be re-used after decolorization and keep the process going by adding H2O2 continuously.
Fe3+ + H2O2 → Fe2+ + H+ + HO2· (15)
44 The hydroxyl radical can also be produced by employing Fe3+ salts instead of Fe2+ salts in Fenton process. The process involves a slow reaction between Fe3+ ion and hydrogen peroxide (Eqs. (17) and (18)) and rapid reaction between the produced Fe2+ ion and
additional hydrogen peroxide [55,56].
Fe3+ + H2O2 → FeO2H2+ + H+ (17)
FeO2H2+ → HO2·+ Fe2+ (18)
a.Effect of pH
The optimal pH for Fenton reagent process is pH 2-3.5 [65, 143]. H2O2 and Fe2+ ions are more stable when the pH value is lower than 3.5 and can give best decolorization ability under acidic condition. If the pH is higher than 4, Fe2+ ions are unstable and will form Fe3+ ions, which have a tendency to produce hydroxyl complex. It will further generate [Fe(OH)4] -when the pH value is higher than 9.0. However, for wastewater treatment, the [Fe(OH)4]- can coagulate dyes and enhance the effluent treatment.
b.Effect of H2O2
45 powder to dissolve into solution [143]. So the efficiency will decrease when H2O2
concentration is greater than 0.001M.
c.Effect of Fe(II) sulfate level
The optimal amount of Fe2+ sulfate depends on the dyes. For reactive dyes, decolorization ability increased until the Fe2+ sulfate level reduced to 1 g/L, then the decolorization performance will drop by adding more Fe2+ sulfate. The low concentration of Fe2+ sulfate cannot generate enough sufficient Fe2+ ions for Fenton’s reaction but if the concentration is too high, the excess Fe2+ will scavenge the hydroxyl radical formed. For acid dyes, such as Acid Blue 40 (11) which has two oxygen and two nitrogen atoms may serve as the ligand for Fe2+ and Fe3+ on the Fe2+ sulfate powder surface, chemisorption is expected to be stronger than azo dyes. Therefore, the higher the iron powder concentration is, the greater the decolorization rate constants will be [143].
11
2.11 Polyethylene terephthalate (PET)
46 solution and in bulk depend on the degree of polymerization (P) and the molecular weight (M), which are the most important characteristics of macromolecular substances.
Degree of polymerization is the number of monomers in polymer chain. The molecular weight of a homopolymer is given by Eq. 19
M = P · Mru (19)
where Mru stands for the molar mass of the monomer repeating unit.
Polyethylene terephthalate, having repeat unit (12), is widely used in the past two decades due to its excellent tensile and impact strength, chemical resistance, clarity, process ability and reasonable thermal stability [69]. The short ethylene group and ρ-phenylene group make PET have low flexibility, and the inflexibility affects PET structure-related properties, such as high glass-transition point and melting point.
47 2.11.1 PET synthesis
There are two ways to make the PET repeat unit: 1. Reacting terephthalic acid with ethylene glycol (EG) by an esterification reaction; 2. Reacting dimethyl terephthalate (DMT) with EG by trans-esterification. Trans-esterification scheme.6 (a) is the much preferred process because it is easier to purify [70]. The initial product of both these process is bis(hydroxyethyl) terephthalate (BHET). The BHET is polymerized to a degree of
48 Scheme 6. PET synthesis reactions: (a) trans-esterification reaction and (b) condensation
reaction.
2.11.2 Recycled PET
In order to improve waste management and considering the low rate of PET natural decomposition, PET recycling is of interest. What is more, as the price of virgin PET remains stable, the technologies of PET recycling can provide the industry with relatively inexpensive PET. The first recycling effort of PET bottles was in 1977 [72].
Certain minimum requirements are necessary for achieving successful PET recycling. The major factor affecting the suitability of recycled PET is the level and nature of
49 2.11.2.1 Conventional recycling processes
PET recycling includes chemical and mechanical recycling. Chemical recycling is achieved by depolymerizing the PET to monomers or partially depolymerizing to oligomers. Water (hydrolysis), methanol (methanolysis) and EG (glycolysis) are used for the depolymerization of PET [75-77]. Figure 2.5 shows the structure of compounds resulting from the
depolymerization of PET with comparison to PET structure. However, chemical recycling is a high cost recycling process [73].
Figure 2.5. Structure comparison between compounds resulting from PET depolymerization process.
50 stabilization [73, 79], using di- or poly-functional low MW material react with PET to rejoin the broken chain [80-82].
2.11.3 PET dyeing
Polyethylene terephthalate fibers, as a hydrophobic substrate with a very dense structure, are very difficult to dye. Disperse dyes, such as Disperse Blue 79 (13), Disperse Orange 30 (14), and Disperse Red 60 (15), are used for PET dyeing.
13 14 15
PET is mostly exhaust dyed at high temperature in pressurized vessels. Atmospheric carrier dyeing and thermo-fixation processes mainly for polyester/cellulose blends are the alternative PET dyeing methods [110-114].
2.11.4 PET decolorization
2.11.4.1 PET fiber and fabric
53 2.11.4.2 PET plastic
Colorants used in PET packaging include both organic dyes and inorganic pigments, with organic dyes most commonly belonging to the azo and anthraquinone families, such as Pigment Orange 64 (16), Pigment Red 177 (17) [134,135].
16 17
55 2.12 Life-cycle assessment
Life cycle assessment is a “cradle-to-grave” approach which used to analyze the impacts of a product to environment. The analysis “begins with the gathering of raw materials from the earth to create the product and ends at the point when all materials are returned to the earth” [153]. The Figure 2.6 shows the life cycle stages in an LCA and typical inputs and outputs measured.
Figure 2.6. Life Cycle Stages [154]
LCA is a technique to assess the environmental aspects and potential impacts associated with a product, process, or service. LCA process consists of four component [153]:
1) Goal Definition and Scoping: Make definition and description of the product, process and activity which LCA will be evaluated. Establish the context in which LCA is to be made. Identify the system boundaries and environment effects to be reviewed for the assessment.
2) Inventory Analysis: Identify and quantify inputs and outputs elements
3) Impact Assessment: Assess the potential human and ecological effects of the elements in inventory analysis.
Recycle/Waster Management Use/Reuse/Maintenance
Manufacturing Raw material acquisition
56 4) Interpretation: Obtain the preferred product, process or service by evaluating the results
of the inventory analysis and impact assessment.
57 Chapter 3 The toxicity of cationic bleach activators.
The experiments were conducted in School of Technology, UNICAMP, Limeira, SP, Brazil. This chapter was reported with the help from Gisela de Aragão Umbuzeiro, Josiane
Aparecida Vendemiatti, and Francine Inforçato Vacchi. 3.1 Introduction
Quaternary ammonium salts (QAS) are extensively used in various applications. They are major class of cationic surfactants used as the ingredients in industry, biotechnology, medicine and biocide production [165-166]. The structure of QAS contains at least one hydrophobic hydrocarbon chain linked to a positively charged nitrogen atom, and other alkyl groups with the mostly short-chain substituents such as methyl or benzoyl groups. The main source of QAS released into the environmental are the discharge of effluents and sludge from sewage treatment plant [167-172]. Other local point sources, such as hospitals and laundry wastewater also lead to its presence in the environment. QAS is generally considered to be biodegradable in an activated sludge system and its degradation depending on the QAS concentration, chemical structure, etc [173-177]. However, adsorption usually outcompete biodegradation in activated sludge system. Therefore, QAS is enriched in sewage sludge and the QAS containing biosolids will cause environmental risk when they are recycling on land. The QAS in the surface water downstream from wastewater treatment plants in the US in the range of 2.7 to 5.8 μg/L and 6.3 to 36.6 μg/L [178]. Although most of the QAS is generally believed to be safe for humans, it will harm organisms that live in water and affects both animals and plants [179].
58 treatment plant, the effluent of the treatment plant still contains these chemicals. In this chapter, the study of their acute toxicity, chronic toxicity and genotoxicity to aquatic organisms is reported. Acute toxicity of these bleach activators was measured using Daphnia sp. Immobilization Test. Young daphnia, aged less than 24 hours at the start of the test, were exposed to the test substance at a range of concentrations for a period of 48 hours. Immobilization was recorded at 48 hours and compared with control values. The results were analyzed in order to calculate the EC50 at 48h. EC50 is the concentration estimated to immobilize 50% of the daphnia within a stated exposure period. Immobilization is defined as: Those animals that are not able to swim within 15 seconds, after gentle agitation of the test vessel are considered to be immobilized (even if they can still move their antennae) [186]. Chronic toxicity of two selected bleach activators was measured using Freshwater Alga Growth Inhibition Test. This test is used to determine the effects of a substance on the growth of freshwater algae. The algae will be exposed to the test substance in the batch cultures in 72 hours. Growth and growth inhibition are quantified from measurements of the algal biomass as a function of time. Algal biomass is defined as the cell counts per volume. The test endpoint is inhibition of growth, expressed as the logarithmic increase in biomass (average specific growth rate) during the exposure period. From the average specific growth rates recorded in a series of test solutions, the concentration bringing about a specified 50 % inhibition of growth rate is determined and expressed as the ErC50 [244].
59
effect of chemicals and among the in vitro ones, the Salmonella/microsome assay have been
the most used [240]. The Salmonella/microsome assay, also known as the Ames test, uses a
bacteria, Salmonella typhimurium that was previously mutated and is not able to growth in
histidine free media. Only if a mutation occurs, the histidine production capacity will be
restored. There are several protocols that can be applied and in this project we decided for the
microsuspension version of the assay because limited amount of the chemicals of interest were
available [241]. There also several strains with different characteristics but the most used ones
are TA100 and TA98 because they are more sensitive to the majority of the environmental
chemicals. To enhance the ability of the assay to detect mutagenic compounds, an exogenous
metabolic system is added to the mixture along with the bacteria that will mimic the reaction
of the chemical with enzymes present in the organisms that are responsible for detoxification
of xenobiotics. Sometimes when this reaction occur then the compound becomes active and
interacts with DNA. An example is the benzo[a]pyrene that only reacts with DNA after
metabolization with those enzymes. The system that provides this metabolic reaction is called
S9 and it is known as S9 mixture. Therefore the assay is always done in the presence and in
60 3.2 Experimental
3.2.1 Chemicals and media
Ten substances tests were sent to Technology laboratory (UNICAMP/Brazil) and their structure are showed below.
The structure of bleach activators:
TBCC:
N
N
O O
TBBC:
PBCC: N
N
O O
PBBC: N
N O O DOBCC: N O O N N DOBBC: N O N N O
NABCC: N
N O O NH2 O NABBC: N N O NH2 O O
3-PBCC: N
N
O O
3-PBBC: N
N
O O
61 visually determined in the culture media and some substances, such as NABCC, TBBC and NABBC had to be sonicated (Cole-Parmer Ultrasonic cleaner, 50-60Hz) by 5 min at 25 °C ± 2 °C to improve the dissolution.
3.2.2 Daphnia sp. Immobilization Test 3.2.2.1Culture of aquatic organisms
The organisms used in the test were Daphnia similis from Faculty of Technology laboratory (UNICAMP/Brazil). The daphnia culture was maintained in control media at 20 °C ± 2 °C, pH in the range of 6 to 9, hardness between 40 to 48 mg/L as CaCO3, with a light intensity of 1000 lux under photoperiod, 16:8 light/dark [186]. The daphnia were fed daily with the green algae Raphidocelis subcapitata (106 cell/org).
3.2.2.2Experiment design
62 3.2.3 Algae Toxicity assay
3.2.3.1Culture of aquatic organisms
The inoculum was composed of algae cells harvested from a liquid stock algal culture that is 3 days old and was in a logarithmic phase of growth. The initial cell density was 10000 ± 1000 cells/mL for all replicates. The test was performed under static conditions for 72 hours without media renewal, at 24 ± 2 °C under continuous fluorescent light (4000 ± 400 lux).
3.2.3.2Experiment design
Two cationic bleach activators, TBBC and 3-PBBC, were used to assess the chronic toxicity. Chemical stock solutions were prepared in DMSO ultrasonicated (Cole-Parmer
Ultrasonic cleaner, 50-60 Hz) by 5 min at 25 °C ± 2 °C. Test solutions and negative control
(deionized water) were prepared in sterilized oligo medium [242]. The range concentration of
TBBC was 0.01 to 10 mg/L and the chemical 3-PBBC was 10 to 400 mg/L. The experiment was performed with three replicates per each concentration. The concentration of DMSO in the test was less than 0.01%. A DMSO control at maximum concentration used in the test was performed at the same time to the chemicals. The number of cells was evaluated by counting with a Neubauer chamber. The endpoint measured was the inhibition of algal biomass in comparison to the negative control and expressed in inhibition concentration (IC50) in mg/L.
Data were statistically analysed by ICp [243] and the inhibition concentration (IC50) was
63 3.2.4 The Salmonella/microsome assay
3.2.4.1Sample preparation
Two chemical substances (TBBC, 3-PBBC) were selected for analysis in the Salmonella/microsome assay. They were dissolved in dimethylsulfoxide (DMSO) at the solubility limit just before testing. The maximum doses tested were 0.5 mg/plate.
3.2.4.2Experiment design
64 3.2.4.3Data evaluation and potencies
An ANOVA was followed by a linear regression using the using the Salanal program (Bernstein model, p<0.05) [245]. Potency were expressed number of revertants per mg of the tested chemical.
3.3 Results
3.3.1 Daphnia sp. Immobilization Test
The preliminary tests were performed to discover the range of toxicity. The preliminary acute toxicity results are shown in the Table 3.1 and summarized in Figure 3.1. TBCC is less toxic than TBBC to daphnia. All of the new bleach activators have less toxicity than TBBC. The confidence interval of toxicity of NABCC, PBBC and NABBC is not available. Because the results of these bleach activators did not fit well to the ToxCalcMix model. DOBBC and 3-PBBC have significant low toxicity among all of the bleach activators. 3-PBBC is 86 times less toxic than TBBC in acute toxicity test. The globally harmonized system (GHS) criteria for classification of a substance in acute categories is listed in Table 3.2. According to this classification, PBCC and TBBC are in Acute I category. TBCC and other seven newly synthesized cationic bleach activators are in Acute III category.
65 Table 3.1. EC50 values of each substance tested in D. similis acute toxicity test.
Substance EC50 (mg/L) 95% CI
TBBC 1.5 ±0.14
PBCC 4 ±2
NABCC 18** -
PBBC 21* -
DOBCC 34 ±10
TBCC 35 ±8
3-PBCC 39 ±6
NABBC 64*** -
DOBBC 114 ±20
3-PBBC 129 ±8.4
EC50 – effective concentration that caused 50% of mortality in 48h CI – confidence interval
66 Figure 3.1. EC50, 48h in mg/L-1 of each substance tested in D. similis acute toxicity test and
the respective confidence interval of 95%.
Table 3.2. The GHS criteria for classification of a substance in acute categories Category Acute toxicity (48 hr EC50)
Acute I ≤1 mg/L
Acute II 1-10 mg/L
Acute III 10-100 mg/L
-20 0 20 40 60 80 100 120 140
TBBC PBCC NABCC PBBC DOBCC TBCC 3-PBCC NABBC DOBBC 3-PBBC
EC
5
0
(m
g/L
67 3.3.2 Algae Toxicity assay
The results of chronic toxicity of TBBC and 3-PBBC to freshwater algae
Raphidocelis subcapitata are shown in Table 3.3. The 3-PBBC and TBBC both were toxic in the algae inhibition test but 3-PBBC is 18 times less toxic than TBBC. The globally
harmonized system (GHS) criteria for classification of a substance in chronic categories is listed in Table 3.4. According to this classification, TBBC is in Chronic II category. 3-PBBC is in Chronic III category.
Table 3.3. Algae toxicity test.results expressed in inhibition concentration 50%, 72h (IC50) for the selected chemicals
Chemicals (mg/L) IC50 95% Confidence Interval (mg/L)
TBBC 5.4 4.7 – 6.6
3-PBBC 93.2 84.1 – 104.1
Table 3.4. The GHS criteria for classification of a substance in chronic categories Category Chronic toxicity (72 hr ErC50)
Chronic I ≤1 mg/L
Chronic II 1-10 mg/L

![Table 2.6. Classification of Dyes [93] Dye type](https://thumb-us.123doks.com/thumbv2/123dok_us/1740242.1222691/48.792.95.715.77.493/table-classification-dyes-dye-type.webp)