A study on the Effect of Distorted Sampler
Shoe on Standard Penetration Test Result in
Cohesionless soil
Utpal Kumar Das
Associate Professor, Department of Civil Engineering, Tezpur University, Tezpur, Assam, India
ABSTRACT: Standard Penetration Test (SPT) is one of the most commonly used methods of geotechnical subsurface exploration. The soil parameters for design of building foundations are frequently based on SPT results. The accuracy of measurement of SPT blow count (N-Value), therefore, highly influences the design and construction of foundations of structures. Although there are uncertainties involved in the determination of N-Value inherent to the procedure of the test, these can be minimised by maintaining close adherence to the accepted standard method of testing and instrumentation. In this work a series Standard Penetration Tests were carried out using a non-standard (damaged due to prolonged use) sampler cutting shoe and the results were compared with N-values obtained by using a standard sampler shoe. The effect of using the overused sampler shoe on SPT value is presented.
KEYWORDS: SPT, Sampler Shoe, N Value, Cohesionless Soil, End Resistance, Skin Friction.
I. INTRODUCTION
The Standard Penetration Test (SPT) is currently the most popular and economical means to obtain subsurface information. Although great effort has been put into standardizing the SPT procedure, variability is inherent in present procedures. The standard penetration resistance is, in fact, conventionally measured using different kinds of hammers, drill rig types, drill rod lengths, drill rod types, hammer blow rates, different energy delivery systems with different degrees of efficiency, different borehole fluids, and different kinds of sampling tubes. Thus the test is performed by different equipment and testing procedures as well as different operators. Consequently, the consistency of the SPT N values is questioned, i.e., the ability of the test to reproduce blow counts using different rig systems under the same site/soil conditions. In India the method of conducting SPT is standardised by the Bureau of Indian Standards(BIS) (IS:2131-1981). [1].
Bureau of Indian Standards (BIS) has recommended use of Split Spoon Sampler in SPT. The Split Spoon Sampler is driven into the soil to obtain the N-value of the soil at a given depth. At the end of the spilt sampler a Cutting Shoe is attached. The bottom of the shoe is provided with a cutting edge to facilitate driving of the sampler into the soil. After repeated use of the sampler, particularly while driving through course grained soils with pebbles/hard rocks, the sampler shoe gets damaged and the cutting edge at its bottom become blunt. In many occasions it is observed that the workmen continue to use these damaged blunt samplers for determining N-Values. The Standard Penetration Test measures the resistance of a hollow core being hammered with a 63.5 kg weight into the subsoil in terms of number of blows required for 30cm penetration of the sampler.
number and needs to be corrected before use. Rabie and Albatal [6] carried out site investigation for a building project using SPT in three time stages, pretender, during tender and post tender stage. From this study the authors commented that the SPT can provide useful and reliable data with good maintenance of the equipment and quality control in the performance of the tests. Although the SPT results for the three investigation stages showed major variations between results, the calculated bearing capacity had variation within the safe margin for the three stages. The settlement results however showed large variation for the three stages.
Design Manual 7.1 of NAVFAC [7] in its list of the procedures that may effect the measured “N” Values have mentioned that “Not using a good tip on the sampling spoon” will result in increased N-value if the tip is damaged and reduces the opening or increases the end area of the sampler shoe.
II. BACKGROUND
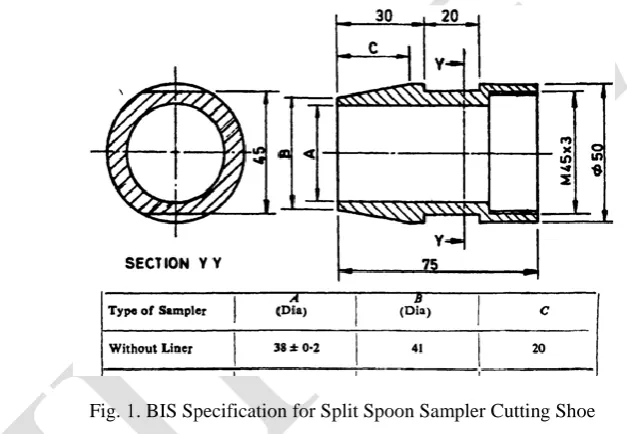
Bureau of Indian Standards(BIS) (IS:9640-1980) [8] has laid down speciation for Split Spoon Sampler to be used in Standard Penetration Test (IS:2131-1981) as shown in Fig.1 below. It was observed that that in many occasions,
Fig. 1. BIS Specification for Split Spoon Sampler Cutting Shoe
particularly while conducting SPT for small works at remote locations, the testing team continue to use the same cutting shoe which had become blunt due to overuse or other reasons. Although test results obtained using such blunt overused cutting shoe should ideally be erroneous such results are often reported without any comment on the condition of the cutting shoe. The geotechnical designers very often rely on the SPT data supplied by the field testing party. In order to have an insight into the effect of the using the over-used sampler shoe on SPT result this study was taken up.
III.FIELDEXPERIMENTALWORK
IV.PRESENTATIONOF EXPERIMENTALRESULTSANDANALYSIS
When a sampler is driven under the impact of hammer blow during SPT the resistance offered by the soil against penetration comes in the form of End Resistance at the bottom of the sampler assembly and Skin Resistance ( friction and cohesion along the body of the sampler). When the tip of the cutting edge is damaged the end resistance increases as a result of increase of area of the blunt sampler bottom. Whether this increase in the end resistance is appreciable or not depends on the percentage contribution of the end resistance on the total resistance offered by the soil against penetration of the sampler. Presence of cohesion in the soil is likely to make the contribution skin resistance more predominant in case of cohesive soil in comparison with cohesionless soil.
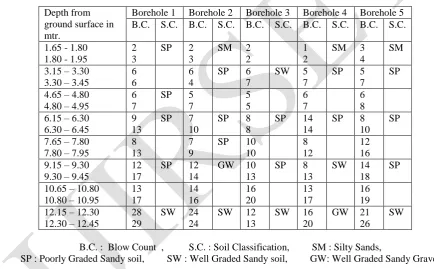
Table 1 shows the blow counts for the 15cm-30 cm and 30cm-45cm penetration of the split sampler into soil at different depths for the boreholes tested using a standard split sampler shoe. The soil collected from the bore hole were transported to the laboratory and tested for classification. The soil classification obtained from laboratory testing are also shown against each depth. The Classification of soil was carried out following specification as laid down in BIS code of practice (IS:1498-1970).
Table 1. SPT Values for Tests conducted with Standard Split Spoon Sampler
Depth from ground surface in mtr.
Borehole 1 Borehole 2 Borehole 3 Borehole 4 Borehole 5 B.C. S.C. B.C. S.C. B.C. S.C. B.C. S.C. B.C. S.C.
1.65 - 1.80 1.80 - 1.95
2 3
SP 2 3 SM 2 2 1 2
SM 3 4
SM
3.15 – 3.30 3.30 – 3.45
6 6
6 4
SP 6 7
SW 5 7
SP 5 7
SP
4.65 – 4.80 4.80 – 4.95
6 7
SP 5 7 5 5 6 7 6 8 6.15 – 6.30
6.30 – 6.45
9 13
SP 7 10
SP 8 8
SP 14 14
SP 8 10
SP
7.65 – 7.80 7.80 – 7.95
8 13
7 9
SP 10 10
8 12
12 16 9.15 – 9.30
9.30 – 9.45
12 17
SP 12 14
GW 10 13
SP 8 13
SW 14 18
SP
10.65 – 10.80 10.80 – 10.95
13 17 14 16 16 20 13 17 16 19 12.15 – 12.30
12.30 – 12.45
28 29
SW 24 24
SW 12 13
SW 16 20
GW 21 26
SW
B.C. : Blow Count , S.C. : Soil Classification, SM : Silty Sands, SP : Poorly Graded Sandy soil, SW : Well Graded Sandy soil, GW: Well Graded Sandy Gravel
From the data in Table 1 it is observed that the difference in blow counts between 15-30cm penetration and 30-45cm penetration of the sampler remains between 0 and 3 in 75% of the cases. The difference of blow counts in none of the tests is found to be greater than 5. It can be inferred from this observation that skin resistance offered by the soil to the sampler against penetration is not significant for the soil under study which is a Sandy soil with pebbles. The end resistance, therefore, is the predominant contributor to the penetration resistance i.e. N Value in SPT in the case under study.
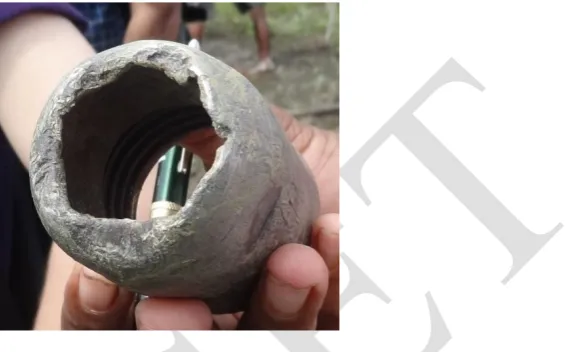
The damaged sampler shoe used in conducting SPT in 4 boreholes is shown in Fig.2. The bottom edge of the shoe has become blunt due to overuse, perhaps through soil layers having pebbles and rocks, and the increase in the base area of the sampler shoe is clear in the figure.
Fig. 2. SPT Sampler Shoe with Blunt Bottom used in the SP Tests
Fig.3. shows the extent of distortion of the cutting shoe which became blunt due to overuse. The solid circular lines show the thickness of the standard sampler cutting shoe at its mid height and the shaded portion shows the distorted shape of the cutting edge. The thickness of this sampler shoe was found out to have increased by 60% with respect to the sampler shoe thickness at its mid length.
Fig. 3. Extent of Distortion of the Cutting Shoe used in the SP Tests
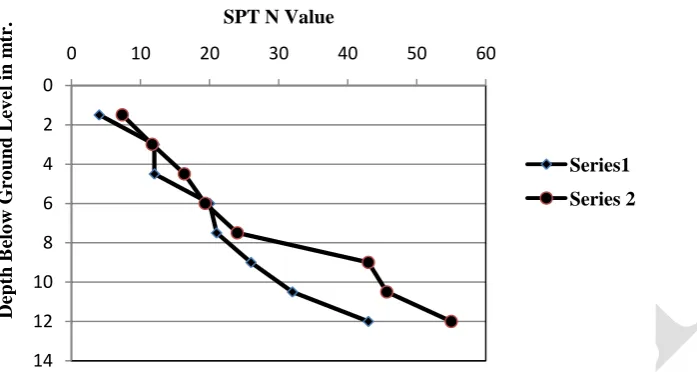
The results of the two series of Standard Penetration Tests conducted in the boreholes are presented in Fig.4. N value Vs Depth of below ground level are plotted in the figure. In one series (Series 1) the N values obtained by using a standard sampler shoe for the 5 Nos. of boreholes are included and the average N value of the 5 boreholes corresponding to each depth from ground surface is plotted in Fig.4. In the other series (Series 2) N values were obtained at same depths at 4 different boreholes using the distorted sampler cutting shoe (Fig.3) and the average N value of the 4 boreholes are plotted in Fig.4.
A comparison of the two curves in Fig.4. shows that up to a depth of 9.00 m from ground surface the N Values for the two test series shows that their variation is low, the maximum being 4, and may be considered to be within acceptable range. But beyond 9.00 m depth the N values for the tests conducted using the blunt shoe (Test Series 2) are
Outer Dia. at mid length of sampler shoe Dia= 45mm
Fig. 4. Average SPT N-Values for Test Series 1 (Test with Standard Shoe) and Test Series 2 (Tested with damaged shoe) against Depth from Ground Surface
appreciably high in comparison with Test Series 1 and the difference in SPT values lies between 12 and 17. A study of the bore logs reveals that existence of pebbles at depths deeper than 6.00 m. The increased bottom area of the sampler shoe might have compacted the small pebbles and increased the base resistance and thus resulting in an overestimated SPT N values in depths above 9.00m.
V. CONCLUSIONS
The following conclusions are drawn based on the results and the discussions and analysis presented in this work:
1) The contribution of skin resistance offered by soil along the body of the sampler against its penetration is not significant in Cohesionless soil. The bearing plays the predominant role.
2) The effect of using a Sampler Shoe which has become blunt due to overuse on SPT value is within tolerable limit, the variation with SPT values obtained using standard Sampler Shoe being maximum 4, for course sandy soil and sand with small pebbles for depth upto 9.00 m from ground surface.
3) The effect of using a blunt overused Sampler Shoe in course sandy soil and sand with small pebbles for depth beyond 9.00 m from ground surface is misleading and gives overestimated N-Value.
REFERENCES
[1] Bureau of Indian Standards(BIS) code “Method for Standard Penetration Test for Soil”, (IS:2131-1981).
[2] Terzaghi, K. and Peck, R.B. (1948). “Soil Mechanics in Engineering Practice”, 1st. ed. John Wiley and Sons., New York. . [3] Peck, R. B., Hanson, W.E. and Thornburn, T.H. (1953). Foundation Engineering, John Wiley and Sons, New York. .
[4] Rogers, J.D. “Subsurface exploration using the standard penetration test and the cone penetrometer test”, Environmental and Engineering Geoscience, Vol. 12, No.2, pp. 161-179, 2006.
[5] Mahmoud, M.A.A.N. “Reliability of using standard penetration test (SPT) in predicting properties of silty clay with sand.” International Journal of Civil and Structural Engineering, Vol. 3, No.3, pp. 545-556, 2013.
[6] Rabie, N.A. and Albatal, A.H. “Uncertainty of standard penetration test measurements and its effect on geotechnical design (case study).” The Third African Young Geotechnical Engineering Conference, Nov. 12-13, Egypt, 2012.
[7] NAVFAC DM-7.1. (1982). Soil Mechanics, Design Manual 7.1, Dept. of the Navy.
[8] Bureau of Indian Standards(BIS) code of “Specification of Split Spoon Sampler” (IS:9640-1980).
0
2
4
6
8
10
12
14
0 10 20 30 40 50 60
Dept
h
B
elo
w
G
ro
un
d
L
ev
el
in
m
tr.
SPT N Value
Series1