ABSTRACT
FRANKOWSKI, KRISTIN M. The Role of Sodium in the Salty Taste of Permeate. (Under the direction of Dr. Maryanne Drake).
One of the contributing factors to hypertension in the U.S. is from the amount of sodium in
the American diet. Many food companies are trying to limit the amount of sodium in their
products. Permeate, the liquid remaining after whey or milk is ultrafiltered, has been
suggested as a salt substitute. It has not been established what part of permeates composition
allows for its use as a sodium replacer or if permeates exhibit salty taste. The objective of this
study was to determine the sensory and compositional properties of permeates and to
determine if elements other than sodium (Na) contribute to the salty taste found in permeate.
Eighteen whey (n=14) and reduced lactose (n=4) permeates were obtained in duplicate from
commercial facilities. Proximate analyses, specific mineral content, and non protein nitrogen
were determined. Organic acids and nucleotides were extracted followed by high
performance liquid chromatography (HPLC). Aromatic volatiles were evaluated by gas
chromatography mass spectrometry (GCMS). Descriptive analysis of permeates and model
solutions was conducted using a trained sensory panel. Correlation analysis was used to
determine which compounds were likely associated with salty taste. Whey permeates were
characterized by cooked/milky and brothy flavors, sweet taste and low salty taste. Permeates
with lactose (DLC) removed were distinctly salty. The organic acids with the highest
concentration in permeates were lactic and citric acid. Volatiles included aldehydes, sulfur
containing compounds, and diacteyl. Sensory tests with sodium chloride solutions confirmed
KCL, lactic acid, citric acid, hippuric acid, uric acid, orotic acid, and urea. KCl, lactic, and
The Role of Sodium in the Salty Taste of Permeate
by
Kristin M. Frankowski
A thesis submitted to the Graduate Faculty of North Carolina State University
in partial fulfillment of the requirements for the degree of
Master of Science
Food Science
Raleigh, North Carolina
2013
APPROVED BY:
_____________________________ _________________________
Dr. Allen Foegeding Dr. Timothy Sanders
ii
DEDICATION
iii
BIOGRAPHY
Kristin Frankowski was born in Chicago, IL. In the fall of 2006 she began her undergrad
studies at Loyola University Chicago. One year after, in the fall of 2007, she transferred to
the University of Illinois Urbana Champaign. It was here that she found her love of food science. Kristin had always had an interest in chemistry but wasn’t sure what she would
want to pursue as a career. As an elective class she took an introduction to food science
course and become more interested in that class than any of her others. It was after that
course that she switched her major to food science. She graduated in December of 2012 with
her Bachelors in Food science. In the fall of 2011, she began her Masters under the direction
iv
ACKNOWLEDGMENTS
I would like to thank my parents for always encouraging me to go after what I want and teaching me
the determination to get it. For never giving up on me and always believing in me even when I didn’t
believe in myself anymore. Without both of you I would never have been able to complete any of my
accomplishments. To Eddie for being the best big brother anyone could ask for. For always being
there for me when I needed advice or just when I needed someone to talk to.
To my friends, for always being there for me. For listening to me when I needed someone to talk to
and for your advice. Especially to Kaitlyn, who always found the time to come and visit me atleast
once a year; I thank you for that.
To Dr. Drake, thank you for taking a chance on a random girl that called you out of the blue saying
she wanted to join your lab. I can’t thank you enough for all that I’ve learned while I was part of your
lab. You shaped me into a better scientist and for that I will always be grateful.
To Evan, thank you for your guidance and patience. I would never have gotten through my two years
without your help.
To Aaron, thank you for teaching me to smile even when I thought I couldn’t do it. For the countless
times you took me out to get my mind off of writing. Most importantly, for never doubting that I
would be able to do it.
To the Drake lab members for being the best lab family anyone could ask for. For the help, guidance
and countless teasing sessions, I’m looking at you 331 members, I thank you all. I could never have
v
TABLE OF CONTENTS
LIST OF TABLES……… ………...vii
LIST OF FIGURES……… .. viii
CHAPTER 1 ... 1
Literature Review ... 1
Salt ... 2
Sodium Chloride ... 2
Adverse Health Effects ... 3
Hypertension... 3
Satiety ... 6
Physiology of Salty Taste ... 7
Salt Replacers ... 8
Flavor Enhancers ... 13
Umami and Salty taste ... 16
Flavor suppressants ... 18
Dairy studies and sodium reduction ... 19
Permeate ... 22
REFERENCES ... 25
CHAPTER 2………... ... 46
The Role of Sodium in the Salty Taste of Permeate ... 47
Abstract ... 49
Introduction ... 51
Materials and Methods ... 53
Permeates ... 53
Proximate Analysis ... 53
Organic acids ... 54
Nucleotides ... 56
Volatile Compound Analysis ... 56
Descriptive Analysis... 57
Threshold Determination ... 58
Basic Taste Response Curves ... 59
Model Permeates ... 60
Proof of Concept ... 60
Statistical Analysis ... 60
Results ... 61
Proximate Analysis ... 61
Organic Acids and Nucleotides ... 62
Descriptive Analysis... 63
Volatile Compounds ... 65
Sensory thresholds and basic tastes of salts and blends ... 67
vi
Basic Taste Response Curves/ Model Permeates ... ………68
Conclusions……… ... ………71
Acknowledgment……….73
REFERENCES………74
vii
LIST OF TABLES
Table 1.1: Daily Nutrient Goals Used in DASH Studies. Based off of 2100 calorie diet. 34
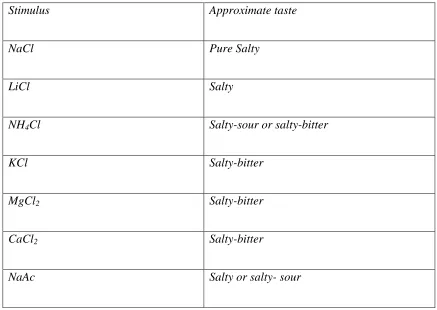
Table 1.2 Approximate tastes of some halide salts ...35
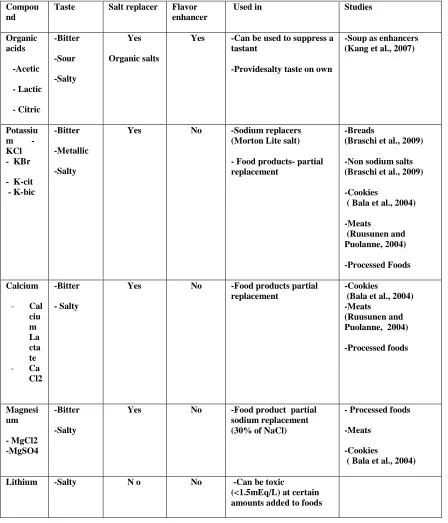
Table 1.3 Summary of sodium replacers and salty taste enhancers ...36
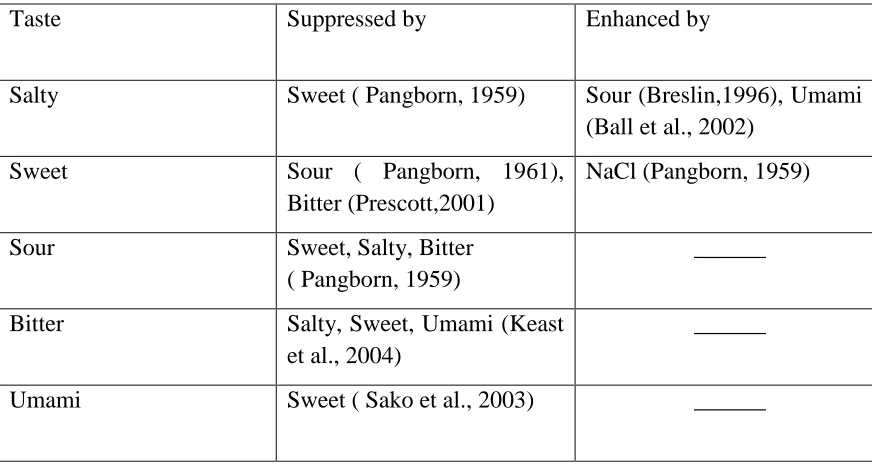
Table 1.4 Supression/enhancement of the basic tastes ...37
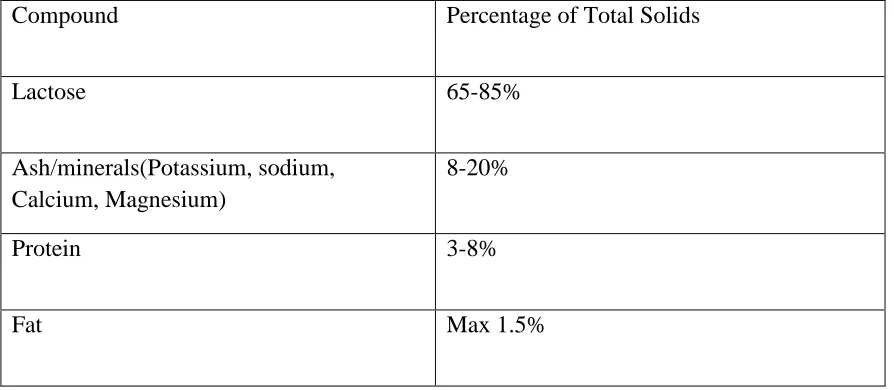
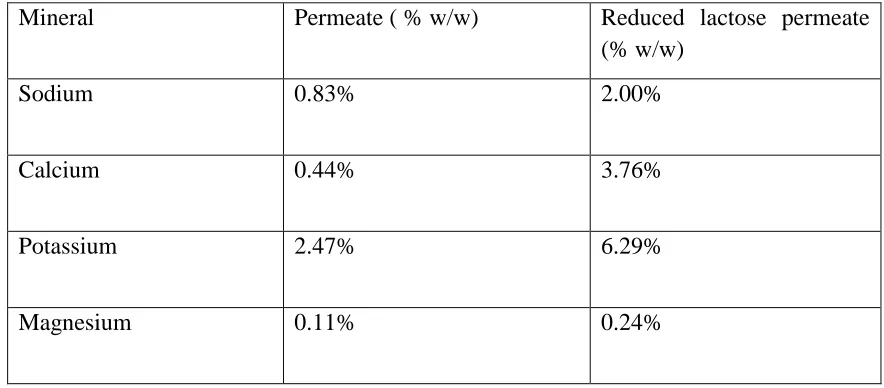
Table 1.5 Composition of whey permeate.38 Table 1.6 Mineral composition of whey permeate and reduced lactose whey permeate ..39
Table 2.1 Proximate analysis averages of all permeate types ...81
Table 2.2 Average mineral concentration permeates ...82
Table 2.3 Organic acid concentrations in permeates ...83
Table 2.4 Trained panel sensory profiles of permeates ...84
Table 2.5 Volatile compounds of whey permeates……… 85
Table 2.6 Volatile compounds of reduced lactose permeates ...86
Table 2.7 Best estimate thresholds of different ratios of potassium chloride (K), magnesium chloride (Mg), calcium chloride (Ca), and sodium chloride (Na) salts in water ...87
Table 2.8 Salty and bitter taste intensities of salts and salt blends ...88
viii
LIST OF FIGURES
Figure 1.1 Estimated Mean Daily Sodium Intake………..40
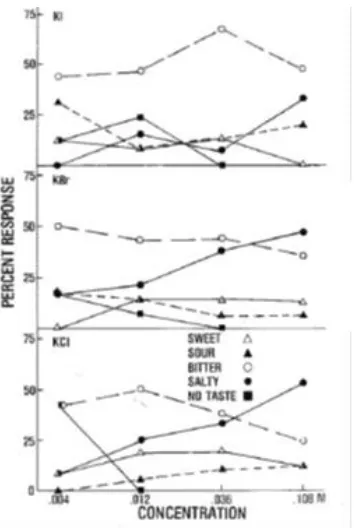
Figure 1.2 Potassium salts and salty taste response. ……….………... ..41
Figure 1.3 Mean magnitudes of saltiness for 18 stimuli at best concentratio ...42
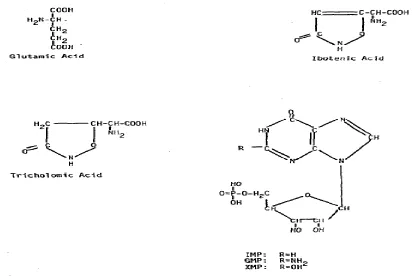
Figure 1.4 Example structures of nucleotides that enhance savory flavors and salty taste43 Figure 1.5 Flow chart for whey permeate production ...…………..………44
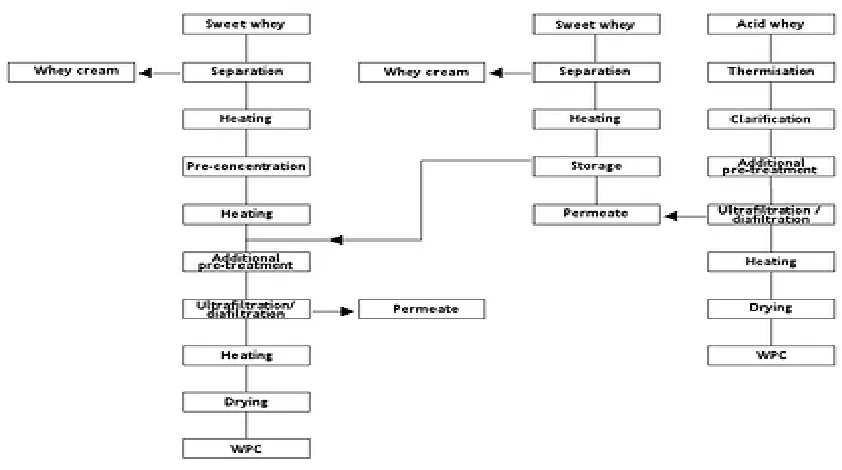
Figure 1.6 Process for milk permeate. ...………45
Figure 1.7 Process for reduced lactose permeate ...………46
Figure 2.1 Principal component biplot of sensory profiles of permeates ...…………90
Figure 2.2 Principal component biplot of volatile compounds in permeate and reduced lactose permeates (ppb)...91
Figure 2.3 Salty taste response curves of permeate and NaCl:lactose solutions ..……….92
Figure 2.4 Salty taste response curves of NaCl and 0.05M KCl with and without lactose.. ...…93
Figure 2.5 Salty taste response curve of NaCl and 0.10M KCl with and without lactose 94 Figure 2.6 Salty taste response curves of NaCl and0.01M lactic acid with and without lactose ...95
Figure 2.7 Salty taste response curves of NaCl and 1mM citric acid with and without lactose ...96
Figure 2.8 Salty taste response curves of NaCl and 3.84mM Orotic acid with and without lactose ...97
Figure 2.9 NaCl, KCl, acid, and lactose models ....………98
1
2 Salt
Sodium chloride (NaCl), otherwise known as salt, has many uses throughout the food
industry. Its uses are currently grouped into three major categories: processing, sensory, and
preservation (Hutton et al., 2002). However, salt may function in more than one category at a
time: overlapping between the categories is frequent. Sodium chloride is one of the oldest
preservatives in the world; it was used mainly to preserve meats before the time of
refrigeration.
Sodium Chloride
Not only is NaCl useful in the food industry, it is also needed by the body to perform
certain functions. Sodium is an electrolyte and is used in the body to create electrical signals
for communication in the brain, nervous system, and muscles. Sodium also regulates the
amount of water that is in the body (BNF, 1994; Eck and Wilson, 1991; SACN, 2003).
According to the Dietary Guidelines for Americans, the average person, ages 9-50 y, should
have 1500- 2400 mg per day (USDA, 2010). However, most Americans consume too much
sodium, with only 15% of the population at or below the recommended consumption
(USDA, 2010). Most Americans consume in excess of the upper limit (2400 mg/day). The
average sodium consumption in the US is around 3,000 mg per day: 55% more than five
years ago (Harvard Medical, 2010).
The average sodium consumption by age is shown in Figure 1.1. Most of the salt consumed
is in processed foods, not from salt that is added during home preparation or at the table
(Anderson et al., 2009). In a study conducted on dietary sources of sodium in many regions
3
sodium), commercially processed meats (12% dietary sodium),
gravies/seasonings/sauces/salad dressing (11.7% dietary sodium), and dairy products (8.2%
dietary sodium) (Anderson et al., 2009).
Adverse Health Effects
High sodium consumption is cause for concern because too much salt intake can have
adverse health effects. Salt has negative effects on gastric health (Tsugane et al., 2004),
kidney stones (Cirillo et al., 1994), asthma (Carey et al., 1993), and increases blood pressure.
In rats, salt increased carcinogenic effects on known gastric carcinogens such as
N-methyl-N-nitro-N-nitrosoguanidine (MNNG) (Tsugane et al., 2004). High concentrations of salt
destroy the mucus lining in the stomach and can cause inflammation and other negative
impacts (Tsugane et al., 2004). Sodium was also shown to increase the colonization of H. pylori, the bacteria responsible for ulcers, in mice (Fox et al., 1999). High Na: K ratios were also related to the formation of urinary stones in the bladder. These high Na: K ratios were
correlated to the amount of dietary sodium consumed (Cirillo et al., 1994). High urinary Na
is linked to high calcium excretion: which ultimately leads to the development of kidney
stones (Cirillo et al., 1994).
Hypertension
The greatest health effect that a high intake of NaCl causes is its affect on blood pressure
and ultimately hypertension. The body uses a rise in blood pressure to prevent sodium
accumulation (Guyton, 1991). According to the United States Department of Health and
Human Services, 65 million Americans suffer from high blood pressure. Another 59 million
4
Prehypertension is when a person’s blood pressure is above normal but it is not yet elevated
to hypertension levels. Hypertension is when blood pressure levels are above 140/mmHg,
systolic blood pressure, and above 90/mmHg, diastolic blood pressure, (US Department of
Health and Human Services, 2006). The probability of getting hypertension varies from
person to person and within certain ethnic and age groups. Especially prone groups are
African Americans and older Americans (Cutler et al., 2008; Giles et al., 2007; Lionaki et al.,
2012). Also, some individuals have salt sensitivities. A salt sensitivity is a genetic phenotype
which makes someone more likely to develop high blood pressure after long exposure to salt
(Jianjun, 2009).
A series of studies, known as the INTERSALT studies, showed that a high, above the
upper limit of 2400 mg/day, salt consumption was related to increases in blood pressure
(Stamler, 1997). In this study, more than 10,000 subjects worldwide and 52 different
communities were polled. From each community they tested the amount of sodium that was
excreted in the urine and its relation to blood pressure. Some of the areas polled had low
sodium excretion and low blood pressure. For example, in the Yanomamo Indians of Brazil
the amount of sodium they excreted was 0.2 mmol/24 hours or 4.6mg /day (INTERSALT
Cooperative Research Group, 1988). Other areas had as high as 242 mmol/24 hours or 5566
mg/day, such as in North China (INTERSALT Cooperative Research Group, 1988). This
study also showed that blood pressure tended to increase with age. In the centers that had
high salt intake there was a significant relationship between salt intake and the slope of blood
pressure with age, but in areas with low salt intake and low sodium consumption this effect
5
also found a relationship between the amount of potassium excreted in urine and blood
pressure. A negative correlation was found between the intake of potassium and blood
pressure (INTERSALT Cooperative Research Group, 1988).
Because of INTERSALT and many other studies linking high sodium intake to high blood
pressure, the United States Department of Health and Human Services and other
organizations have come up with a diet plan that helps to lower blood pressure and to
ultimately reduce illnesses caused by hypertension. This diet plan is known as the Dietary
Approaches to Stop Hypertension or the DASH diet plan (US Department of Health and
human Services, 2006). The DASH diet plan is low in fats (both total and saturated) and
cholesterol, while encouraging the consumption of fruits, vegetables, and low fat milk (US
Department of Health and Human Services, 2006). The DASH diet reduces sodium intake,
while encouraging the consumption of potassium and other minerals that have been shown to
lower blood pressure (US Department of Health and Human Services, 2006). Table 1.1
outlines the guidelines for the DASH diet. Studies done on the DASH diet have shown
significant reductions in blood pressure. Subjects that were on the DASH diet reduced their
blood pressure by 11.2/7.5 mm Hg (Blumenthal et al., 2010). Although many studies have
shown the correlation between sodium and high blood pressure, people are still hesitant about
low sodium diets (FDA, 2008); 50% of consumers would like to decrease their sodium but don’t want to lose the flavor of their foods (NMI, 2008).A study done by Kim et al. (2012)
characterized consumer knowledge of sodium and sodium reduced food by surveying
consumers. Consumers were aware of a link between certain medical conditions, like
6
relationship, salt was considered a must have by consumers and they preferred a “reduced”
sodium version of the food product compared to a sodium “free” product.
Satiety
Salt has been shown to cause a significant decline in the desire to eat after consumption of
salty foods (Guinard et al., 1998). Appetite has two main components to it: satiation and
satiety. Satiation is when to end the meal when eating, essentially when someone is full
(Geraedts et al., 2010).This helps to prevent overconsumption (Cummings and Overduin,
2007). Satiety determines the amount of time between meals, or how often you eat (Geraedts
et al., 2010). Satiety is controlled by both mechanical and hormonal stimulation (Karhunen et
al., 2008). The major hormones that contribute to satiety are Ghrelin, Cholecystokinn (CCK),
Glucagon- like peptide 1 (GLP-1), and Peptide YY (PYY) (Geraedts et al., 2010). These
hormones are known as satiation signals; they work by limiting the amount of food intake,
and are released at different areas within the GI tract (Geraedts et al., 2010).
Diet composition of macronutrients is known to affect satiation and satiety. A high protein
diet is thought to have the greatest effect on increasing satiety (Geraedts et al., 2010;
Sorerens, 2008; Veldhorst, 2008). However, recent studies have started to show that the five
basic tastes (known as tastants) also contribute to satiety (Garaedts et al., 2011). It is
generally known that there are certain receptors located on the tongue that detect tastants, but
it is thought that these same receptors are located in the gut (Bezencon et al., 2007).Because
of these receptors, the GI tract is able to sense the different tastes (Garaedts et al.,2011).
In a recent study, researchers demonstrated that NaCl had an effect on satiation and satiety
7
CCK and GLP-1 dose dependently; CCK and GLP- 1 reached their highest levels when NaCl
was about 400mM (Garaedts et al., 2011). It was also shown that the release of CCK and
GLP-1 by NaCl increased over time (Garaedts et al., 2011). This is important because if the
salty tastant is lost in the reduction of sodium, then satiety will decrease. If other salts can
replace sodium then the satiety can still be maintained in the food.
Physiology of Salty Taste
Taste buds on the tongue are made up of groups of taste receptor cells. The taste receptor
cells are able to detect a wide range of chemicals by transforming chemical signals into a
series of action potentials for nerve fibers (Bigiani et al., 2003). This is done by two general
processes: transduction and coding (Gilbertson et al., 2000). Transduction is the process of
turning the chemical stimulus into a chemical signal. Coding takes the signal produced from
transduction and turns it into action potential to the nerves. The general mechanism for salt
taste transduction is that the flow of cations, usually Na⁺ though other ions as well (K⁺, Li⁺)
produce membrane depolarization and this triggers action potential firing (Bigiani et al.,
2003). This process can happen by two different channels. The first is the epithelial Na
channel, ENAC (Bigiani et al., 2003). This pathway is Na selective. It is also inhibited by
amiloride (a potassium sparing diuretic): the ENAC channel is amiloride -sensitive (AS)
(Bigiani et al., 2003). Salty taste will be reduced by the presence of amiloride if a salt goes
through this channel. The other pathway is amiloride- insensitive (AI). This occurs through
permeation of a tight junction by a cation into the taste receptor cell through a Na transport
8
vary with the ion; the more similar to NaCl in terms of size and weight, the saltier it is
perceived to be (Ye et al., 1991).A study done on rats showed that Na salts will go through
different channels depending on the size of the anion they are connected to (Ossebaard and
Smith, 1995). Na with large salts will activate only the apical channels, the amilo-sensitive
channels, while salts with small anions like NaCl activate both channels, the amilo-senstitive
and insensitive (Ossebaord and Smith, 1995). K, Ca, Mg, and other salts are part of the
amiloride insensitive channel. Because of the size of amiloride it is not able to fit through
tight junctions in the membrane (Ye et al., 1993), and therefore these minerals are not
affected by it. NaCl and other halide salts like KCl are able to fit through smaller junctions
and will not be affected by amiloride where another larger molecular weight salt such as
Na-gluconate would would not fit through these junctions and would be inhibited by amiloride
(Ossebaard and Smith, 1995). Salts that are able to amiloride insensitive would act more
similar to NaCl and therefore should be able to be perceived as being salty in taste.
Salt Replacers
Many halide salts will give a salty taste. A list of some halide salts and their taste properties
are shown in Table 1.2. Unlike NaCl, however, these salts do not have a purely salty taste
(Schiffman and Erickson, 1970). Most halide salts will have at least two different tastants:
most are salty and bitter or salty and sour. The dominant taste will change depending on the
concentration. For example, NaCl at low concentrations will have a bitter and sour taste, but
at high concentrations NaCl has a purely salty taste (Murphy et al., 1981). Other salts are not
as drastic as NaCl and will not have a pure taste but as the concentrations change different
9
the taste: the heavier the anion/cation, the more bitter tasting the salt will be and the lighter
the anion/cation, the saltier the taste will be (Murphy et al., 1981). The major cations that
have salty taste responses are sodium, lithium, potassium, calcium, magnesium, rubidium,
and caesium. The major anions used are chloride, iodine, and bromide.
The most popular, major halide that has a salty taste and can be used as a salt replacer is
Potassium (K). Potassium, like Na, is an electrolyte and is involved in membrane potential
and electrical excitation of nerve and muscle cells (Vaskonen, 2003). It has been shown to
decrease blood pressure. In one study, an increase of K by 1.9g/day decreased blood pressure
by 4.5 mmHg systolic blood pressure and by 2.5 mmHg for diastolic blood pressure
(Whelton et al., 1997). According to the Dietary Guidelines for Americans, the adequate
intake (AI), the amount that is needed daily for healthy adults, for K is 4700 mg/day (USDA,
2010). The average intake in the United States is below this level. The most popular salt
substitute is potassium chloride (KCl), although, other ionic potassium salts can have a salty
taste. Different anions with K will affect whether the salt is perceived as salty or as more
bitter or sour (Murphy et al., 1981). The salty taste of K salts can be seen in Figure 1.2. KCl
had a bitter taste below 0.108M. Above this concentration it becomes salty. However,
potassium bromate (KBr) is both equally salty and bitter at concentration below 0.108M
(Murphy et al., 1981). K had overall lower salty taste than sodium, but it follows the trend
where having an anion that is an organic acid or other halide salt decreases salty taste more
10
KCl has a bitter/metallic aftertaste (Murphy et al., 1981; Sinopoli and Lawless, 2012).
Sinopoli and Lawless (2012) found that KCl increased in saltiness perception with
concentration but increases in other tastes/flavors were also found. At the highest
concentration of KCl used (0.6%), the tastes/flavors consumers detected in KCl were
bitter,chemical, metallic, plastic, salty, drying, sour, moldy, and no taste. Lower
concentrations had similar taste/flavors just at lower frequencies. KCl is usually used in
conjunction with NaCl to help reduce the bitter taste. NaCl is known to reduce bitterness in
many bitter compounds (Keast and Breslin, 2002; Breslin and Beauchamp, 1995; Kroeze and
Bartoshuk, 1985; Schifferstein, 1994; Sonpoli and Lawless, 2012). A study conducted by
Breslin and Beauchamp (1995) looked at the different interactions between NaCl and
different bitter compounds. NaCl (concentration: 0, 0.05, 0.10, and 0.20M) was added to KCl
in the same concentrations. All concentrations of NaCl inhibited the bitterness of KCl. At the
highest concentration of NaCl, the bitterness of KCl was reduced by 78% (Breslin and
Beauchamp, 1995). A solution of KCl and NaCl was also saltier in taste than just that of
NaCl alone. KCl can provide a 15-20% reduction in salt while still providing acceptable taste
in many foods (Batenburg and Velden, 2011). Other studies showed a higher percentage of
substitution with other K salts or a mixture of K salts were acceptable in bitter taste. A
British study reduced sodium content within bread by using different potassium salts:
Potassium citrate( K-cit) and Potassium Bicarbonate (K-bic). The potassium salts that
produced the highest overall liking in the breads were substituting 30% NaCl with K-bic or
11
the breads that had the best flavor contained 30% substitution of NaCl with KCl and K Bic
(Braschi et al., 2009).
Potassium is already used as a salt replacer in some commercial products. Morton salt has both a “lite” salt and a full salt replacer. These products both replace NaCl with KCl (Morton
Salt, 2011). The lite version is 50% less NaCl. According to the label, in each half teaspoon
it contains 550 mg of sodium and 733 mg of potassium while normal salt has 1200 mg per half teaspoon (Morton Salt, 2011). A study done on Morton “lite” salt compared it to regular
salt in cooking (Kincaid et al., 1976). The taste of the “lite” salt when it was used to cook rice
was identical to consumers as regular salt (Kincaid et al., 1976).
Other halide, non-sodium, salts that have a salty taste and are linked to lowering blood
pressure are calcium (Ca) and magnesium (Mg) salts (Vaskonen, 2003). Calcium has many
health benefits and is recommended to the public to lower many different chronic diseases
(Vaskonen, 2003). The RI for calcium is 800mg/day but up to 2000mg/day is considered safe
(Vaskonen, 2003). According to Vaskonen (2003), if current calcium intakes were increased
by 100mg it could decrease blood pressure by 0.39mmHg systolic and by 0.35mmHg
diastolic (Vaskonen, 2003).
Calcium salts are mostly bitter with low salty taste responses that increase slightly over time.
Calcium lactate was generally less intense then calcium chloride (Lawless et al., 2003;
Tordoff, 1996). At suprathreshold concentrations, calcium salts were considered unpleasant
by subjects (Tordoff, 1996). Tordoff (1996) tested many different calcium salts to determine
12
Calcium lactate also had some salty taste. At low concentrations ( 1mM), calcium chloride
was considered to be 35% bitter, 32% sour, 24% sweet and 4% salty; however, at higher
concentrations ( 100mM) it was 44% bitter, 20% sour, 1% sweet, and 35% salty (Tordoff,
1996). In the higher concentrations of both calcium lactate and calcium chloride, as the
concentration went up and the intensity of non salty tastes such as bitter or sour increased,
the overall liking of the salts went down (Tordoff, 1996). Although the saltiness increased,the
higher perception of bitter taste drove the liking scores down. Calcium salts were more
bitter than sodium salts across all anion combinations.
Magnesium salts also are thought to lower blood pressure (Vasoken, 2003). The RDA for
Mg is 400 mg/day (Vaskonen, 2003). Like Ca, Mg is also salty and bitter. However, Mg
salty taste responses stayed consistently low with concentration (Lawless et al., 2003):
saltiness did not increase as the concentration increased like most of the other salts. Because
of the bitter taste of these salts, like K, if used as salt replacements they would have to be
used with another compound to suppress the bitter taste.
One study tested each of the above mentioned halide salts to try and reduce the sodium
levels in cookies (Bala et al., 2004). They replaced NaCl with KCl, MgCl2, CaCl2, MgSO4,
and Na2SO4. They also replaced the sodium in baking soda with K and a combination of
NaHCO3 and NH4HCO3 (50:50). They found that the cookies made with the substituted salts
were all acceptable. The order of acceptability from highest to lowest was KCl, Na2SO4,
MgSO4 MgCl2 and CaCl2 (Bala et al., 2004). The taste ratings were established in the flours
13
replacement that was most favored was KCl. When NaCl was replaced with these substitutes
it reduced the sodium content by almost one third (Bala et al., 2004).
Lithium (Li) salts have similar salty taste responses as Na (Murphy et al., 1981). LiBr and
LiCl have high salty taste responses with greater concentrations. A study done on sodium
deprived rats showed that rats will ingest Li salts because of the salty taste that it has
(Schulkin et al., 1982). Li salts also follow the same pattern as sodium as far as the anion it is
attached to and salty taste (Schulkin, 1982). Li, like Na, is part of the amiloride sensitive
channel: its salty taste would be reduced by the presence of amiloride. As a pure salt replacer,
Li does not work because Li is toxic at levels above 1.5 mEq/L (Timmer and Sands,
1999)Other salts like caesium and rubidium have a mild salty taste response (Murphy et
al.,1981). These salts are mostly characterized by having bitter or salty taste (Murphy et al.,
1981). Figure 1.3 shows different salts and their saltiness.
Flavor Enhancers
Several studies have suggested that organic acids, amino acids, and nucleotides can add
flavor to foods (Schiffman et al., 1980; Salles et al., 2002; Kang et al., 2007). Amino acids
are present in many foods and are important stimuli for tastes: they provide complex tastes
(Schiffman et al., 1980). Glycine, L-proline, L-serine provided sweet tastes while basic amino acids had a salty taste (Schiffman et al., 1980). 5’-nucleotides also add an agreeable
taste to foods (Sakaguclii, 1963).
Although these compounds (amino acids, nucleotides, and organic acids) may contribute a
unique taste themselves, most work by enhancing the salty taste or suppressing a bitter taste.
14
would be a compound like the halides discussed earlier that are added either to completely
remove NaCl or as a partial replacement of NaCl. A flavor enhancer works not by replacing
the NaCl present but by maximizing a flavor that is already present. In a study done by Breslin (1999), he defined enhancement as “a linear (additive) process that bears direct
analogy with subthreshold hyper additive mixing.” In simple terms, a flavor enhancer is a
substance that heightens a taste that is already present in a food. According to Katsumata et al. (2008), “an ideal enhancer is: tasteless, odorless, non-pungent, stable at high temperatures,
effective at low concentrations, effective in modulating salt receptors, reversible, and additive.”
Several studies have used organic acids such as acetic, citric, malic, and tartaric to enhance
the salty taste of NaCl (Fabien and Blum, 1942; Kamen et al., 1961; Pangborn, 1959;
Pangborn, 1963). Helleman (1992) showed that at low concentrations of NaCl, lactic and
acetic acids were able to enhance saltiness. This experiment was conducted in water and in a
food matrix, bread. In water, the acids increased the salty taste of sodium with increasing
amount of acids. However, at high concentrations of NaCl, salty taste actually decreased with
increasing concentration of the acids. In bread this effect was not observed. At all
concentrations of NaCl in bread, the acids enhanced the taste of NaCl.
Kang et al. (2007) also found that lactic acid increased perceived salty taste in ramen style
soup. At a concentration of 0.0066%, lactic acid increased saltiness and beefiness in soup.
However, at a concentration of only 0.0039%, lactic acid did not enhance salty taste. This
15
taste at the ideal concentrations. The Hellemann (1992) study demonstrated that if the salt
concentration goes above a certain percentage, the enhancement effect is lost. However, if
the acid concentration is not high enough it does not provide any enhancing behavior to the
salt that is present.
One study compared three organic acid sodium salts and the salty taste response they
elicited in blowflies (Murata et al., 2001). The organic acids used were acetic, succinic, and
citric. When tested by themselves the organic acids had no salt response, but when added to
sodium they all yielded salt responses higher than the salt alone. The organic acid which had
the highest perceived salty taste intensity in the flies was acetic acid; it was followed by
succinic and then citric acid (Murata et al., 2001). The same experiment was done to see if
the same organic acids enhanced the saltiness of KCl. The same organic acids enhanced the
salty taste of KCl; however, a higher concentration of the acid was required in the KCl
solutions than in NaCl to enhance salty taste. In this same study, organic acid sodium salts of
the organic acids previously added to NaCl solutions were tested for salty taste intensity
compared to NaCl salts. Sodium acetate had a stronger salty taste response than that of NaCl.
The two other sodium salts, sodium citrate and sodium succinate, did not have as strong of a
salty taste response as that of NaCl. Acetate raises the sensitivity of the salt receptor cells to
sodium ions (Murata et al., 2001). A solution that has an acetate salt in it will taste saltier
than pure NaCl at the same concentration.
US Patent 4,243,691 used a combination of non-sodium salts and sodium enhancers to
10-16
40% by weight flavor enhancer amino acids, 10-40% K phosphate, KCL, and 5’-nucleotides.
The combination of ingredients enhanced the salty taste. There was no bitter taste from the K
because the nucleotides suppressed the bitter taste. A lower amount of K salts were needed to
create a salty taste than would be needed if the nucleotides were not present.
Another patent used lactose or dextrose to mask the bitter taste of a KCl and ammonium
chloride mixture (Eisenstadt, 1975). Small amounts of the sugar and potassium hydrogen
tartrate (cream of tartar), in very small amounts, were needed to suppress the bitter taste that
was associated with both of these salts. Although lactose or dextrose alone can inhibit bitter
taste, when mixed with cream of tartar, bitter taste was further reduced (Patent 3860732).
Umami and Salty taste
Many compounds that contribute to umami taste are salt enhancers. Umami is the fifth basic
taste. It is elicited by glutamates (Fuke and Ueda, 1996). This includes monosodium
glutamate (MSG), guanosine monophosphate (GMP), adenosine monophosphate (AMP), and
inosine monophosphate (IMP). Peptides are also able to produce an umami taste (Lioe et al.,
2006; Schlichtherle-Cerny and Amada, 2002). Examples of synthesized peptides that have an
umami taste are Gly-Asp, Ala-Glu, Gly-Asp-Gly, Val-Asp-Val, Asp-Leu and Val-Glu-Leu
(Ohyama et al., 1988). These produce a lingering umami taste. However, umami taste is most
closely related to monosodium glutamate. In the early 1900s, Ikeda (1912) discovered
metallic salts in brown kelp. He recognized that MSG gave the food a desirable flavor (Ikeda, 1912). Umami has a savory, meaty taste to it and is sometimes known as “the taste of
proteins” (de Araujo et al., 2003). The umami taste is perceived by receptors on the tongue
17
functions similar to the taste receptor cells that generate a sweet or bitter taste (Fuke and
Udea, 1996). MSG is also known to have a synergistic effect when combined with some
ribonucleotides (Hayashi et al., 1994).
MSG and other nucleotide flavor enhancers, AMP, IMP, etc. belong to one of two classes
structurally. The two classes were L-amino acids containing 5 carbon atoms or purine
ribonucleoside 5'-monophosphates having a 6-oxy group: MSG belongs to the first group and
AMP, IMP, and GMP belong to the second class ( Maga and Yamaguchi, 2009). Depending
on the structure, nucleotides change their function and their ability to enhance savory flavors
and salty taste. Figure 4 shows the different structures of the different mononucleotides.
A study tested the different flavor enhancing compounds in sausages (Ruusunen et al.,
2001). In this study, they compared MSG to Ribotide. Ribotide is a commercial flavor
enhancer which is a combination of MSG, IMP, and GMP. The sausages that were made with
MSG alone with no other added mononucleotides were perceived as having the highest
amount of salty taste (Ruusunen et al., 2001). However, after 27 days of storage the sausages
with MSG or Ribotide were not different. This result suggests that other mononucleotides
have the ability to enhance salty taste perception.
MSG was shown to have a similar taste with that of NaCl. In a study on rats, rats were
conditioned to be adverse to the taste of MSG. When the rats were then presented with NaCl,
they avoided consumption (Bellisle, 1999). Yamaguchi and Takanashi (1984) conducted a
18
salty perception: less salt was needed when more MSG was added or vice versa (Yamaguchi
and Takanashi, 1984). The optimal combination was 0.38% MSG to 0.81% salt.
MSG and calcium diglutamate (CDG) were studied for their effect on lower sodium soups
(Ball et al., 2002). MSG had been shown to enhance salty taste in other studies (Okiyama and
Beauchamp, 1998; Roininen et al.,1996; Yamaguchi and Takahashi, 1984) but because it has
a Na ion connected it also adds a small amount of sodium to the food. Because of this, CDG
was tested to see if the effects were the same. CDG would also add the health benefits of the
calcium ion. Researchers found that when NaCl levels were reduced to 85mM and a
glutamate was added the soups had equal or higher salty taste intensity (Ball et al., 2002).
They also found that there was no difference between adding MSG or CDG.
Flavor suppressants
Basic taste compounds in the presence of other basic tastes can alter the way that a substance
is perceived; if one taste lowers the intensity of another it is called suppression. Sweet taste is
the most common suppressant of other tastes, and provides the strongest taste (Green et al.,
2010). Sucrose is known to suppress in binary mixtures the saltiness of NaCl, the sourness of
acids, and bitterness in both caffeine and quinine (Pangborn, 1959; Hopkins, 1953; Breslin
1996). In a binary mixture, sucrose is able to suppress the salty taste intensity of NaCl by
82.6% (Green et al., 2010).
Bitter taste is also known to be suppressed by sodium salts (Breslin and Beauchamp, 1995;
Keast and Breslin, 2002). Keast et al. (2006) evaluated the effect of Na salts on different
bitter compounds using the gLMS scale. The gLMS scale is a logarithmic scale but there are
19
sensation ever experienced. Solutions were made with varying bitter compounds and Na
salts. All the different Na salts decreased the expression of bitter taste in most of the bitter
compounds used except for tetralone, an iso-alpha- acid which is the primary bitter
compound in beer (Keast et al., 2004). In a study conducted on suppression of bitter taste of
whey protein hydrolysate, sodium chloride and some salty taste enhancers suppressed bitter
taste in beverages (Leksrisompong et al., 2012). Whey protein hydrolysates (WPH) at two
different levels of hydrolysis were tested (5% and 32% degree of hydrolysis) with potential
bitter taste by descriptive analysis. The substances that reduced bitterness were then
evaluated in beverage formulations. Sodium chloride suppressed bitterness of the WPH
beverage made from WPH with a higher degree of hydrolysis. Other substances such as
monosodium glutmate and AMP, which are salty taste enhancers, also reduced bitter taste in
WPH beverages (Leksrisompong et al., 2012).
The findings for suppression are dependent upon concentration, technique used, flow directly
over tongue or swallowing motions, and if the panel is trained or untrained so it is difficult to
say that one tastant will always suppress or enhancer another (Breslin, 1996). Most likely, at
one concentration it will enhance/suppress and at another concentration is may have the
opposite effect or no effect at all. A general trend for the basic tastes effect on one another is
presented in Table 1.4.
Dairy studies and sodium reduction
Many studies have been conducted to reduce the sodium content in various foods. A large
number of these studies were done in dairy products, especially cheese. Reducing the sodium
20
et al., 2011). In this study, they reported various Na levels that were present in a variety of
cheeses. In Cheddar cheese, the average sodium content was 615 mg/100g (Agarwal et al.,
2011). Mozzarella had an average Na content of 666 mg/100g (Agarwal et al., 2011), and
processed cheeses had the highest Na concentration with an average of 1,242 mg/100g
(Agarwal et al., 2011). Since cheese is a significant source of sodium in the diet (Albernethy,
1979; Anon, 1980), reducing the sodium levels in these cheeses could reduce the population
sodium intake.
Because sodium plays a large part in natural cheese ripening many studies have been done to
develop low sodium products (Katsiari et al., 1997). When sodium is taken out of natural
cheese, and no replacement is used, problems develop with cheese flavor and texture
(Anonymous, 1992; Johnson et al., 2009). KCl was used to replace some of the sodium to
reduce these problems (Reddy and Marth, 1991). Partial Na reduction with KCl was done in
Minas fresh cheese (Gomes et al., 2011). In the study, four different cheeses had varying
levels of KCl replacement for NaCl: 0,25,50,75 %( wt/wt) (Gomes et al., 2011). The control
product, which had no Na replacer, had the highest liking scores, the 25 %( wt/wt)
replacement was acceptable; it had scores that were not significantly different from the
control (Gomes et al., 2011). The 50% and 75% substituted cheeses were not liked by
consumers. The bitter taste that is associated with K was perceived in these cheeses.
A similar project was done in Feta cheese by Katsiari et al. (1997). Feta cheeses with a 3:1
or 1:1(w/w) mixture of NaCl and KCl were acceptable low sodium products. This study
21
from the control cheeses in sensory evaluation (Katsiari et al., 1997). Although in the 1:1
mixture a slight metallic taste was perceived by some of the panelists; this mixture, however,
still remained acceptable. The 3:1 mixture did not have a bitter taste detected because of the
masking influence of NaCl (Katsiari et al., 1997; Charteris and Keogh, 1991). Texture
evaluation was also done on the reduced sodium Feta cheeses. The cheeses that were made
with the mixture of NaCl:KCl were softer than the control cheese ( Katsiari et al., 1997).
A study on a variety of dairy products was conducted to determine if sodium levels could be
reduced and consumer acceptance maintained (Drake et al., 2011). The dairy products that
were used were milk based soups, cottage cheese, and a Cheddar cheese sauce. The soups
and the cheese sauce had sodium reductions from 5%-35% done in 5% increments. The
cottage cheese started at 3% reduction and went up to 21% reduction in increments of 3%.
Sodium reductions in the soups and the sauces were less detectable than in the cottage
cheese (Drake et al., 2011). These authors reported that consumers were able to detect a
difference in NaCl in the varying products at different percentages. The differences detected
were: 8% reduction in cottage cheese, 15% reduction for the milk based soups, and 14%
reduction in the cheese sauce.
Another unpublished study, used whey permeates as a Na substitute in cream based soups
(Dixon, 2008 MS thesis, unpublished). Permeate was added to two different soup bases:
canned and fresh. The permeate version of the canned soup had 19% of the Na of the full
sodium version and the fresh permeate soup had 11% of the Na in a full Na soup (Dixon,
22
standard content of Na. The permeate soup for the canned version ranked slightly saltier than
50% of the full Na. The fresh permeate soup ranked slightly lower than the 50% standard
soup sample (Dixon, 2008 MS thesis, unpublished).
Permeate
Many foods naturally have flavor enhancers in them; one of these foods is cheese (Maga and
Yamaguchi, 2009). These enhancers include nucleotides, organic acids, and minerals
naturally found in cheeses (Maga and Yamaguchi, 2009). However, only about 10% of these
remain in the finished cheese product. The rest is removed in the whey after curd formation.
The minerals do not remain in the whey. During processing of whey into value added
ingredient, minerals, organic acids, and nitrogenous compounds are filtered and concentrated
by ultrafiltration and end up in the permeate. According to the United States Dairy Export Council, whey permeate is “a source of dairy solids obtained from proteins and some
minerals in whey” (USDEC, 2011). Whey is a greenish- yellowish liquid that is leftover from
the manufacture of cheese. Whey protein is concentrated and used as a protein source in
many products. In order to concentrate the protein, lactose and other minerals are removed;
this is done through ultrafiltration. The lactose and minerals are the compounds that end up in
permeate. Permeate will account for approximately 90% of the whey volume (Chandan et
al., 1982). Figure 1.5 shows the overall process for the production of whey permeate.
There are many types of permeate: whey, milk, and reduced lactose permeate. Milk
permeate is the byproduct of when milk is concentrated to make milk protein
23
leftover is milk permeate (Animal Feed Sources Information, 2011). Milk permeate is
mostly lactose with some soluble proteins and minerals (El-Khair, 2009).
Reduced lactose permeate has about 20-55% of the lactose crystallized removed. The
production of reduced lactose permeate is outlined in Figure 1.7. Permeate is first
concentrated in the evaporator. After concentration it is put into a crystallization tank where
starter lactose seed crystals are added and lactose (20-55%) is crystallized from the permeate.
Once the crystals become a large enough size they are centrifuged from the rest of the
solution. The liquid remaining is reduced lactose permeate.All the varying types of permeate
can be found in both liquid and solid form. The liquid permeate is the liquid left after the
whey/milk has been ultrafiltrated. The solid is the spray dried version. This makes the solid
version slightly more expensive but easier to work with (USDEC, 2011). The production of
permeate has increased from 2005-2009 by 17% each year (Gerdes, 2011). The composition
of permeate is variable (Table 1.5, 1.6).Reduced lactose permeate is higher in mineral
concentration because other components are concentrated before the lactose is removed from
the permeate. Permeate can promote browning, enhance flavor, improve moisture retention,
and reduce sodium (USDEA, 2011). It is currently found in infant formula, instant drinks,
bakery products, confectionary bars, instant soups, milk drinks, sweetened condensed milk,
ice cream, and dessert products (USDEC, 2011).
While very few studies have been done on permeate, many of them have worked with
hydrolyzing the lactose to replace sucrose in products. Hydrolyzed whey permeate replaced
24
(Tweedie and MacBean, 1978). Another project used hydrolyzed and hydrolyzed-isomerized
whey permeate in ice cream (Arndt and Wehling, 1989). Whey permeate was hydrolyzed
and made into syrups of 25% and 50% replacement of sucrose. The ice cream were tested for
overall acceptability, appearance, body, texture, and sweetness. The ice creams made with
25% and 50% syrups were acceptable as a substitute across all attributes. The
hydrolyzed-isomerized 50% resulted in the sweetest ice cream.
More recently, permeate was studied as a component in a sports beverage (Beucler et al.,
2005). The beverages were created using whey permeate and hydrolyzed whey permeate.
Varying percentages of deionized water and permeate were used. The percentages used were
as follows: 0%, 25%, 50%, 75% and 100%. The hydrolyzed permeate had higher sweeter
taste than the non hydrolyzed permeate. The beverages were salty but comparable in salty
taste to a commercial sports beverage. Both permeates were acceptable at 25% and 50% of
the beverage volume. Low levels of permeate could be added to a sports beverage. There are
also some studies that suggest that permeate can potentially be used as a salt replacer (Dixon,
2008 MS thesis unpublished). Although it has had some success as a salt replacer in
products, it is not known what compounds in permeate contribute to salt replacement. The
objective of this study was to determine the sensory properties and composition of whey
permeates, and to demonstrate if components other than Na are responsible for the salty taste.
25
REFERENCES
Albernathy JD. 1979. Sodium and potassium in high blood pressure. Food Technol 33: 57-59.
AnimalFeedsources.Online.http://www.fao.org/ag/AGA/AGAP/FRG/AFRIS/data/343.html. Accessed Oct 2011.
Anderson C, Lawrence J, Appel, Okuda N, Brown I, Chan Q, Zhao L, Ueshima H, Kesteloot H, Curb D, Yoshita K, l Elliott P, Yamamoto M, Stamler J. 2009. Dietary Sources of Sodium in China, Japan, the United Kingdom, and the United States, Women and Men Aged 40 to 59 Years: The INTERMAP Study. J Am Diet Assoc 110: 736-745.
Anon. 1980. Dietary salt. Food Technol 33: 85-91.
Aragwal S, McCoy D, Graves W, Gerard PD, Clark S. 2011. Sodium content in retail Cheddar, Mozzarella, and processed cheeses varies considerably in the United States. J Dairy Sci 94: 1605-1615.
Arndt EA, Wheling RL. 1989. Development of hydrolyzed and hydrolyzed- isomerized syrups from cheese whey ultrafiltration permeate and their utilization in ice cream. J Food Sci 54: 880-884.
deAraujo IET, Kringelbach ML, Rolls ET, Hobden P. 2003. Representation of umami taste in the human brain. J Physiol 90: 313-319.
Bala R, Bakshi AK. 2004. Studies on preparation of low sodium cookies. J Food Sci Tech 41: 668-671.
Ball P, Woodward D, Shoobridge A, Ferrier M. 2002. Calcium diglutamate improves the taste characteristics of lower salt soup. European J Clincal Nutri 56: 519-523.
Batenburg M, Velden R. 2011. Saltiness enhancement by savory aroma compounds. J Food Sci 76: 280-288.
26
Beucler J, Drake MA, Foegeding EA. 2005. Design of a beverage from whey permeate. J Food Sci. 70: S277-S285.
Bezencon C, le Coutre J, Damak S. 2007. Taste signaling proteins are coexpressed in solitary epithelial cells. Chem Senses 32: 41-49.
Bigiani A, Ghiaroni V, Fieni F. 2003. Channels as taste receptors in vertebrate. Biophysics and Molecular Biology 83: 193-225.
Blumenthal JA, Babyak MA, Hinderlier A, Watkins LL, Craighead L, Lin PH, Johnson J, Waugh R, Sherwood A. 2010. Effects of the DASH diet alone and in combination with exercise and weight loss on blood pressure and cardiovascular biomarkers in men and
women with high blood pressure.Arch Intern Med 170: 126-135
BNF (British Nutrition Foundation). 1994. Salt in the diet. Available at: http://www/nutrition.org
.uk/home.asp?siteId=43§ionId=780&subSectionId=341&parentSection=303&which=5# 1275. Accessed Oct 2011
Braschi A, Lakhwinder G, Naismith P. 2009. Partial substitution of sodium with potassium in white bread: feasibility and bioavailability. International J Food Sci Nutri 60: 507-521.
Breslin P, Beauchamp G.1995. Suppression of bitterness by sodium: varaiation among bitter taste stimuli. Chem Senses 20: 609-623.
Breslin P. 1996. Interactions among salty, sour, and bitter compounds. Trends in Food Sci Tech 7: 390-399.
Carey OJ, Locke C, Cookson JB. 1993. Effect of alterations of dietary sodium on the severity of asthma in men. Thorax48: 714–8.
Chandan RC, Uebersax MA, Saylock MJ. 1982. Utilization of cheese whey permeate in canned beans and plums. J Food Sci 47: 1649-1653.
27
Cummings DE, Overduin J. 2007. Gastrointestinal regulation of food intake. J Clin Invest 117: 13-23.
Cutler JA, Sorlie PD, Wolz M, Wolz M, Thom T, Fields LE, Roccella EJ. 2008. Trends in hypertension prevalence, awareness, treatment, and control rates in United States adults
between 1988-1994 and 1999-2004.Hypertension 52:818-827.
Drake SL, Lopetcharat K, Drake MA. 2011. Salty taste in dairy foods: Can we reduce the salt. J Dairy Sci 94: 636- 645.
Eck Pc, Wilson L. 1991. Common misconceptions associated with salt. The Eck institute of
applied nutrition and bioenergetics Ltd. Available at:
http:www/arltma.com/saltcravingdoc.html. Accessed Oct 2011.
Eisenstadt B. 1975. Salt substitute. United States Patent 3860732.
El-khair AA.2009. Formulation of milk permeate for utilization as electrolyte beverages. Aust J of Basic App Sci 3: 572-578.
Fabian BW, Blum HB. 1943. Relative taste potency of some basic food constituents and their competitive and compensatory action. Food Research 8: 179-193.
Fox JG, Dargler CA, Taylor NS, King A, Koh TJ, Wang JC. 1999. High salt diet induces
gastric epithelial hyperplasia and partial cel loss, and enhances Heliobacter pylori
colonization in C5703L16 mice. Cancer Res 59: 4823-4823.
Fuke S, Ueda Y. 1996. Interactions between umami and other flavor characteristics. Trends Food Sci Tech 7: 407-411.
Geraedts MCP, Troost FJ, Saris WHM. 2011. Different tastants and low caloric sweetners induce differential effects on the release of satiety hormones. Food Chem 129: 731-738.
Gerdes S. 2011. Food makers turn to whey permeate. Dairy Foods 112: 42.
28
Gomes AP, Cruz AG, Cadena RS, Celeghini RMS, Faria JAF, Bolini HMA, Pollonio MAR, Granato D. 2011. Manufacture of low sodium Minas fresh cheese : Effect of the partial replacement of sodium chloride with potassium chloride. J Dairy Sci 94: 2701-2706.
Green BG, Lim J, Osterhoff F, Blacher K, Nachtigal D. 2010. Taste mixture interaction: Suppression, additivity, and the predominance of sweetness. Physiology and Behavior 101: 731-737.
Guinard JX, Brun P. 1998. Sensory- specific satiety: Comparison of taste and texture. Appetite 31: 141-157.
Harvard Medical. 2010. Harvard Men's Health Watch. 15:1-5.
Hayashi Y, Tsunenari T, Mori T. 1994. Binding of umami substance to plasma membraneisolated from bocine circumvallate papillae. Bioscience Biotechnology Biochemistry 58: 1403-1406.
Hellemann U. 1992. Perceived taste of NaCl and acid mixtures in water and bread. International J Food Sci Tech 27: 201-211.
Hopkins JW. 1953. Laboratory flavor scoring: Two experiments in incomplete blocks. Biometrics 9: 1-21.
Hutton T. 2002. Sodium technological functions of salt in the manufacturing of food and
drink products. Brit Food J 104: 126-152.
Ikeda, K. 1912. On the taste of the salt of glutamic acid. In Proceedings of the 8th
International Congressin Applied Chemistry38: 147.
Intersalt cooperative research group. 1988. Intersalt: An international study of electrolyte excretion and blood pressure: Results for 24 hour urinary sodium and potassiunm excretion. British Med J 297: 319-328.
Johnson ME, Kapoor R, McMahon DJ, McCoy DR, Narasimmon RG. 2009. Reduction of sodium and fat levels in natural and processed cheeses: scientific and technological aspects. Comprehensive Reviews in Food Science and Food Safety 8: 252-268.
29
Kamen JM, Pilgrim FJ, Gutman NJ, Kroll BJ. 1961. Interactions of suprathreshold taste stimuli. J Experiment Psychology 62: 348-356.
Kang MW, Chung SJ, Lee HS, Kim Y, Kim KO. 2007. The sensory interactions of organic acids and various flavors in Ramen soup systems. J Food Sci 72: S639-S647.
Karhunen LJ, Juvonen KR, Huotari A, Purhonen AK, Herzi KH. 2008. Effect of protein, fat, carbohydrate and fibre on gastrointestinal peptide release in humans. Regul Pept 149: 70–78.
Katsumata T, Nakakuki H, Tokunaga C, Fujji N, Egi M, Phan T, Mummalaleni S, DeSimmone J, Lyall V. 2008. Effect of Maillard Reacted Peptides on Human Salt Taste and the Amiloride-Insensitive Salt Taste Receptor (TRPV1t). Chem Senses 33: 665-680.
Keast R and Breslin P. 2002. Modifying the bitternes of selected oral pharmaceuticals with cation and anion series of salts. Pharm Research 19: 1019-1026.
Keast R, Canty TM, Breslin P. 2004. The influence of sodium salts on binary mixtures of bitter tasting compounds. Chem Senses 29: 431-439.
Kemp S, Beauchamp GK. 1994. Flavor modification by sodium chloride and monosodium
glutamate. J Food Sci59: 682–686.
Kincaid JP, Pollock C, Glisson PA. 1976. Saltiness of Morton “lite- salt” and table salt used in rice. N Eng J Med 294: 788.
Kroeze J, Bortoshuk L. 1985. Bitterness suppression as reveled by split- tongue taste stimulation in humans. Physiol Behav 35: 779-783.
Lachanpal R. 1978. When salt substitutes are required in low-sodium diets. J Nation Med Assoc 70: 255-258.
Lawless H, Rapacki F, Horne J, Hayes A. 2003. The taste of calcium and magnesium salts and anionic modifications. Food Qual Pref 14: 319-325.
30
Lioe HN, Takara K, Yasuda M. 2006. Evaluation of peptide contribution to the intense umami taste of Japanese soy sauces. J Food Sci 71: 277-283.
Maga JA, Yamaguchi S. 2009. Flavor potentiators. Critical reviews in Food Sci and Nutrition 18: 231-311.
Mierson S, Olson MM, Tietz AEE. 1996. Basolateral amiloride sensitive NA transport pathway in rat tongue epithelium. J Neurophysiol 76: 1297-1309.
Murata Y, Kataoka-Shirasugi N, Amakawa T. 2001. Electrophysiological Studies of Salty
Taste Modification by Organic Acids in the Labellar Taste Cell of the Blowfly. Chem Senses
27: 57-65.
Murphy C, Cardello AV, Brand JG. 1981. Tastes of fifteen halide salts following water and Nacl: Anion and Cation effects. Physio and Behavior 26: 1083-1095.
Mohlenkamp MJ, Hiler GD. 1981. Sodium-free salt substitute. US Patent 4,243,691.
Morton Salt INC. 2012. Available at: http://www.mortonsalt.com/for-your-home/culinary-salts/food-salts/3/morton-lite-salt-mixture. Accessed Oct 2012.
NMI. 2008. The 2008 health and wellness reports. 9th Ed. Harleysville, Pa.; Natl. Marketing
Inst.
Ohyama S, Ishibashi N, Tamura M, Nishizaki H, Okai H. 1988. Synthesis of bitter peptides composed of aspartic acid and glutamic acid. Agricultural and Biological Chem 52: 871-872.
Okiyama A, Beauchamp GK. 1998. Taste dimensions of monosodium glutamate (MSG) in a
food system: role of glutamate in young American subjects. Physiol. Behav. 65: 177-181.
Ossebaard C and Smith D. 1995. Effect of Amiloride on the Taste of NaCl, Na-gluconate and KCl in Humans: Implications for Na+ Receptor Mechanisms. Chem Senses 20: 37-46.
Panborn RM. 1959. Taste interrelationships. J Food Sci 29: 245-256.
31
Prescott J, Ripandelli N, Wakeling I. 2001. Binary taste mixture interactions in PROP non- tasters , medium- tasters, and super-tasters. Chem Senses 26: 993-1003.
Roininen K, Lahteenmaki L, Tuorila H. 1996. Effect of umami taste on pleasantness of low-salt soups during repeated testing. Physiol. Behav 60: 953-958.
Ruusunen M, Simolin M, Puolanne E. 2001. The effect of fat content and flavor enhancers on the perceived saltiness of cooked Bologna type sausages. J Muscle Food 12: 107-120.
SACN (Scientific Advisory Committee on Nutrition). 2003. Salt and Health. Available at: http://www.sacn.gov.uk/pdfs/sacn_salt_final.pdf. Accessed 13 Oct 2011.
Sakaguclii K, Kibi M, Kuninaka A, Chibaken C. 1963. Process for improving the flavor of foods by the addition of 5’nucleotides. Patent 3104171.
Sako N, Tokita K, Sugimara T, Yamamoto T. 2003. Synergistic responses of the Chorda Tympani to mixtures of umami and sweet substances in rats. Chem Senses 28: 261-266.
Salles C, Sommerer N, Septier C, Issanchou S, Chabanet C, Garem A, Le Quere JL. 2002. Goat cheese flavor: sensory evaluation of branched fatty-chain fatty acids and small peptides. J Food Sci 67: 835-841.
Schiffman SS and Erickson RP. 1970. A psychophysical model for gustatory quality. Physiol Behav 7: 617-633.
Schiffmann SS, Sennewald K, Gagnon J. 1981. Comparison of taste qualities and thresholds of D- and L- amino acids. Physio and Behavior 27: 51-59.
Schlichtherle- Cerny H and Mado R. 2002. Analysis of taste- active compounds in an enzymatic hydrolysate of deamidated wheat gluten. J Agri and Food Chem 50: 1515-1522. Schufferstein H. 1994. Contextual effects in the perception of quinine HCl/NaCl mixtures. Chem
Senses 19: 113-123.
32
Pangborn RM. 1964. Relative taste intensities of selected sugars and organic acids. J Food Sci 29: 726-733.
Sinopoli D and Lawless HT. 2012. Taste properties of potassium chloride alone and in mixtures with sodium chloride using a check-all-that-apply method. J Food Sci 77: S319-322.
Stamler J. 1997. INTERSALT studies: Background, methods, findings, and implications. Am
J Clin Nutr65: S626-S642.
Tordoff M. 1996. Some basic psychophysics of calcium salt solutions. Chem Senses 21: 417-424.
Tsugane S and Sasazuki S. 2007. Diet and the risk of gastric cancer: review of epidemiological evidence. Gastric Cancer 10: 75-83.
Tweedie LS, MacBean RD. 1978. The effect of partial replacement of sucrose by hydrolyzed whey lactose on quality of canned peaches and pears. Food Tech Aust 12: 128-131.
United States Dairy Export Council. 2011. Whey products definition, composition, and function. In U.S. Dairy Export Council (Ed.), Reference manual for U.S. whey and lactose products(pp. 37).
United States Department of Health and Human Services. 2006. Your guide to lowering your blood pressure: DASH eating plan. NIH publication No. 06-4082.
USDA. 2010. Dietary Guidelines for Americans 2010: Chapter 8 sodium and potassium. U.S.
Department of Health and Human Services; U.S. Department ofAgriculture.
www.healthierus.gov/dietaryguidelines
Van der Klaauw N, Smith D. 1995. Tastes quality profiles for 15 organic and nonorganic salts. Physiology & Behavior 58: 295-306.
33
Whelton PK, He J, Cutler JA, Brancati FL, Appel LJ, Rollmara D. 1997. Effects of oral potassium on blood pressure. Meta Analysis of randomized controlled clinical trials. J American Medical Association 7: 1624-1632.
Yamaguchi S, Takahasi C. 1984. Interaction of monosodium glutamate and sodium chloride on saltiness and palatability of clear soup. J Food Sci 49: 82-85.
Ye Q, Heck GL Desimone JA. 1991. The anion paradox in sodium taste reception: resolution by voltage- clamp studies. Science 254: 724-726.
34
TABLES
Table 1.1 Daily Nutrient Goals Used in DASH Studies. Based off of 2100 calorie diet. (US Department of Health and Human Services, 2006)
Total fat 27% of calories
Saturated fat 6% of calories
Protein 18% of calories
Carbohydrate 55% of calories
Cholesterol 150 mg
Sodium 2300 mg
Potassium 4700 mg
Calcium 1250 mg
Magensium 500 mg
35
Stimulus Approximate taste
NaCl Pure Salty
LiCl Salty
NH4Cl Salty-sour or salty-bitter
KCl Salty-bitter
MgCl2 Salty-bitter
CaCl2 Salty-bitter
NaAc Salty or salty- sour
36 Compou
nd
Taste Salt replacer Flavor enhancer
Used in Studies
Organic acids -Acetic - Lactic - Citric -Bitter -Sour -Salty Yes Organic salts
Yes -Can be used to suppress a tastant
-Providesalty taste on own
-Soup as enhancers (Kang et al., 2007)
Potassiu m - KCl - KBr
- K-cit - K-bic
-Bitter
-Metallic
-Salty
Yes No -Sodium replacers (Morton Lite salt)
- Food products- partial replacement
-Breads
(Braschi et al., 2009)
-Non sodium salts (Braschi et al., 2009)
-Cookies
( Bala et al., 2004)
-Meats (Ruusunen and Puolanne, 2004) -Processed Foods Calcium - Cal ciu m La cta te - Ca Cl2 -Bitter - Salty
Yes No -Food products partial replacement
-Cookies
(Bala et al., 2004) -Meats
(Ruusunen and Puolanne, 2004)
-Processed foods Magnesi um - MgCl2 -MgSO4 -Bitter -Salty
Yes No -Food product partial sodium replacement (30% of NaCl)
- Processed foods
-Meats
-Cookies
( Bala et al., 2004)
Lithium -Salty N o No -Can be toxic
37 Table 1.4 Supression/enhancement of the basic tastes
Taste Suppressed by Enhanced by
Salty Sweet ( Pangborn, 1959) Sour (Breslin,1996), Umami
(Ball et al., 2002)
Sweet Sour ( Pangborn, 1961),
Bitter (Prescott,2001)
NaCl (Pangborn, 1959)
Sour Sweet, Salty, Bitter
( Pangborn, 1959)
______
Bitter Salty, Sweet, Umami (Keast
et al., 2004)
______