Study Sobel Edge Detection Effect on the
ImageEdges Using MATLAB
Elham Jasim Mohammad, Mohammed JawadKadhim, Waleed Ibrahim Hamad, Sundus Yasser Helyel,
AsmaaAbdAlstarAbdAlrsaak, Farouk Khalid Shakir Al-Kazraji, Anaam Musa HadeeAbud
University of Mustansiriyah, Collage of Science, Physics Department, Baghdad, Iraq
Abstract:The areas of this work are in digital image process and telecommunication engineering, which are very wide fields. This work is intended to implement the edge detection for digital image, so that it may be carried out to a big contour identification of an image.
Edge detection is one of the most fundamental operations in image processing and computer vision. It is defined as the process of locating the boundaries of objects or textures depicted in an image. Knowing the positions of these boundaries is critical in the process of image enhancement, recognition, restoration and compression. The edges of image are considered to be most important image attributes that provide valuable information for human image perception. The data of edge detection is very large, so the speed of image processing is a difficult problem.
Sobel operator is commonly used in edge detection. In the edge function, the Sobel method uses the derivative approximation to find edges. This paper mainly used the Sobel operator method to do edge detection processing on the images. Our paper is focused on software used to detect edges of image employing mainly the MATLAB program for solving this problem.
Keywords:Edge, Edge Detection, Sobel Operator, Image Processing.
I. INTRODUCTION
Edge detection is a very important area in the field of computer vision. Edges define the boundaries between regions in an image, which helps with segmentation and object recognition. They can show where shadows fall in an image or any other distinct change in the intensity of an image. Edge detection is a fundamental of low-level image processing and good edges are necessary for higher level processing [1].
The problem is that in general edge detectors behave very poorly. While their behavior may fall within tolerances in specific situations, in general edge detectors have difficulty adapting to different situations. The quality of edge detection is highly dependent on lighting conditions, the presence of objects of similar intensities, density of edges in the scene, and noise. Since different edge detectors work better under different conditions, it would be ideal to have an algorithm that makes use of multiple edge detectors, applying each one when the scene conditions are most ideal for its method ofdetection. In order to create this system, you must first know which edge detectors perform better under which conditions [1].
In digital image, the so-called edge is a collection of the pixels whose gray value has a step or roof change, and it also refers to the part where the brightness of the image local area changes significantly. The gray profile in this region can generally be seen as a step. That is, in a small buffer area, a gray value rapidly changes to another whose gray value is largely different with it. Edge widely exists between objects and backgrounds, objects and objects, primitives and primitives. The edge of an object is reflected in the discontinuity of the gray. Therefore, the general method of edge detection is to study the changes of a single image pixel in a gray area, use the variation of the edge neighboring 1st order or 2nd order to detect the edge. This method is used to refer as local operator edge detection method.
The basic idea of edge detection is as follows: First, use edge enhancement operator to highlight the local edge of the image. Then, define the pixel "edge strength" and set the threshold to extract the edge point set. However, because of the noise and the blurring image, the edge detected may not be continuous. So, edge detection includes two contents. First is using edge operator to extract the edge point set. Second is removing some of the edge points from the edge point set, filling it with some another and linking the obtained edge point set into lines [3].
The four steps of edge detection are:
1. Smoothing: suppress as much noise as possible, without destroying the true edges. 2. Enhancement: apply a filter to enhance the quality of the edges in the image (sharpening).
3. Detection: determine which edge pixels should be discarded as noise and which should be retained (usually, thresholding provides the criterion used for detection).
4. Localization: determine the exact location of an edge (sub-pixel resolution might be required for some applications, that is, estimate the location of an edge to better than the spacing between pixels). Edge thinning and linking are usually required in this step [4].
Paper is organized as follows. Section II describes the edge detection techniques. After that, the Soble edge detection is discussed in Section III. Section IV presents simulation results showing results of images tested and the results discussion. Finally, Section V presents conclusion.
II. EDGE DETECTION TECHNIQUES
There are many ways to perform edge detection. However, the majority of different methods may be grouped into two categories:
1. Gradient: The gradient method detects the edges by looking for the maximum and minimum in the first derivative of the image.
2. Laplacian: The Laplacian method searches for zero crossings in the second derivative of the image to find edges. An edge has the 1D shape of a ramp and calculating the derivative of the image can highlight its location. Suppose we have the following signal, with an edge shown by the jump in intensity Fig. 1 below [5], [6]:
Fig 1 Intensity graph of a signal [2], [5].
Fig 2 First derivative of the signal [2], [5].
Furthermore, when the first derivative is at a maximum, the second derivative is zero. As a result, another alternative to finding the location of an edge is to locate the zeros in the second derivative. This method is known as the Laplacian and the second derivative of the signal is shown in Fig. 3 [7]:
Fig 3 Second derivative of the signal [7].
The process of edge detection attenuates high fluctuations in color, i.e. dramatic change in intensity [8]-[10]. Matlab includes the built-in function edge designed for edge detection. It supports the following types of edge detectors: Sobel, Prewitt, Roberts, Log (Laplacian), Canny and Zerocross.
III.SOBEL EDGE DETECTION
Edge detection is the process of localizing pixel intensity transitions. The edge detection has been used by object recognition, target tracking, segmentation, and etc. Therefore, the edge detection is one of the most important parts of image processing. There mainly exist several edge detection methods: Sobel, Prewitt, Roberts and Canny. In this paper, Sobel which is an edge detection method is considered.
The Sobel edge detector uses two masks, one vertical and one horizontal. These masks are generally used 3×3 matrices. Especially, the matrices which have 3×3 dimensions are used in matlab. Sobel has two main advantages: it has some smoothing effect to the random noise of the image [11]:
i) Since the introduction of the average factor, it has some smoothing effect to the random noise of the image.
ii) Because it is the differential of two rows or two columns, so the element of the edge on both sides has been enhanced, so that the edge seems thick and bright.
𝐺 = 𝐺𝑥2+ 𝐺𝑦2 (1) and is often approximated with [12], [13]:
𝐺 = 𝐺𝑥 + 𝐺𝑦 (2)
In many implementations, the gradient magnitude is the only output of a gradient edge detector.After having calculated the magnitude of the 1st derivative, we now have to identify those pixels corresponding to an edge. The easiest way is to threshold the gradient image, assuming that all pixels having a local gradient above the threshold must represent an edge. An alternative technique is to look for local maxima in the gradient image, thus producing one pixel wide edges. A general problem for edge detection is its sensitivity to noise, the reason being that calculating the derivative in the spatial domain corresponds to accentuating high frequencies and hence magnifying noise [14]. For a continuous function 𝑓(𝑥, 𝑦), in the position (𝑥, 𝑦), its gradient can be expressed as a vector (the two components are two first derivatives which are along the X and Y direction respectively) [15]:
∇𝑓 𝑥, 𝑦 = 𝐺𝑥𝐺𝑦 𝑇
= 𝜕𝑓
𝜕𝑥 𝜕𝑓
𝜕𝑥 (3)
The magnitude and direction angle of the vector are [16], [17]:
𝑚𝑎𝑔 ∇𝑓 = ∇𝑓(2) = 𝐺𝑥2𝐺𝑦2 1/2
(4) 𝜙 𝑥, 𝑦 = 𝑎𝑟𝑐𝑡𝑎𝑛 𝐺𝑥/𝐺𝑦 (5)
The partial derivatives of the formulas above need to be calculated for each pixel location. In practice, we often use small area template convolution to do approximation. 𝐺𝑥and𝐺𝑦 need a template each, so there must be two templates
combined into a gradient operator. The two 3×3 templates used by Sobel are showed as (a) and (b) in Fig. 4 below [13]:
Fig.4 Sobel edge masks [13].
Every point in the image should use these two kernels to do convolution. One of the two kernels has a maximum response to the vertical edge and the other has a maximum response to the level edge. The maximum value of the two convolutions is used as the output bit of the point, and the result is an image of edge amplitude.Their convolution is as follows [17], [18]:
𝑔1 𝑥, 𝑦 = 1𝑘=−1 1𝑖=−1𝑆1 𝑘, 𝑙 𝑓(𝑥 + 𝑘, 𝑦 + 𝑙) (6)
𝑔2 𝑥, 𝑦 = 1𝑘=−1 1𝑖=−1𝑆2 𝑘, 𝑙 𝑓(𝑥 + 𝑘, 𝑦 + 𝑙) (7)
𝑔 𝑥, 𝑦 = 𝑔12 𝑥, 𝑦 + 𝑔22(𝑥, 𝑦) (8)
If 𝑔1(𝑥, 𝑦) > 𝑔2(𝑥, 𝑦), it means that there is an edge with a vertical direction passing through the point (𝑥, 𝑦).
Otherwise, an edge with a level direction will pass through the point. If the pixel value of the point (𝑥, 𝑦)is 𝑓(𝑥, 𝑦), and this point is judged as an edge point if 𝑓(𝑥, 𝑦) satisfy one of the following two conditions [17], [18]:
1) 𝑔(𝑥, 𝑦) > 4 × 𝑙𝑖𝑠𝑡𝑔2(𝑖, 𝑗)/𝑟𝑜𝑤 × 𝑙𝑖𝑠𝑡 𝑗 =1
𝑟𝑜𝑤
𝑖=1 (8)
𝑔1 𝑥, 𝑦 > 𝑔2(𝑥, 𝑦) (9)
𝑔(𝑥, 𝑦 − 1) ≤ 𝑔(𝑥, 𝑦) (10) 𝑔(𝑥, 𝑦) ≥ 𝑔(𝑥, 𝑦 + 1) (11)
2) 𝑔(𝑥, 𝑦) > 4 × 𝑙𝑖𝑠𝑡𝑔2(𝑖, 𝑗)/𝑟𝑜𝑤 × 𝑙𝑖𝑠𝑡 𝑗 =1
𝑟𝑜𝑤
𝑖=1 (12)
𝑔1 𝑥, 𝑦 > 𝑔2(𝑥, 𝑦) (13)
In the formulas above, row and list refer to the number of rows and columns of the image respectively [17], [18].
IV.SIMULATION RESULTS AND DISCUSSION
We proceed with the Sobel edge detector. MATLAB is a great and easy tool to use to simulate image process. The main steps in edge detection using masks are:
First derivative: Sobel operators.
1. Smooth in one direction, differentiate in the other. 2. Apply Sobel mask for x-direction.
3. Apply Sobel mask for y-direction. 4. Found the absolutes value.
5. Found the arctan= gradient direction. 6. Found the gradient of the image. 7. Defined a threshold value.
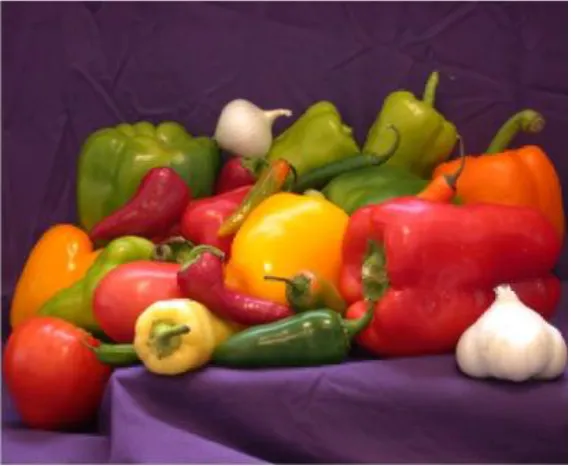
The edge detection techniques were implemented using MATLAB, and tested with (Vegetables) image. The objective is to produce a clean edge map by extracting the principal edge features of the image. The masks of the Sobel edge detection 3×3 are constructed in this work. The original image and the image obtained by using different threshold Sobel edge detection technique are given in Fig. 5, Figs. 6 and Figs. 7 below.
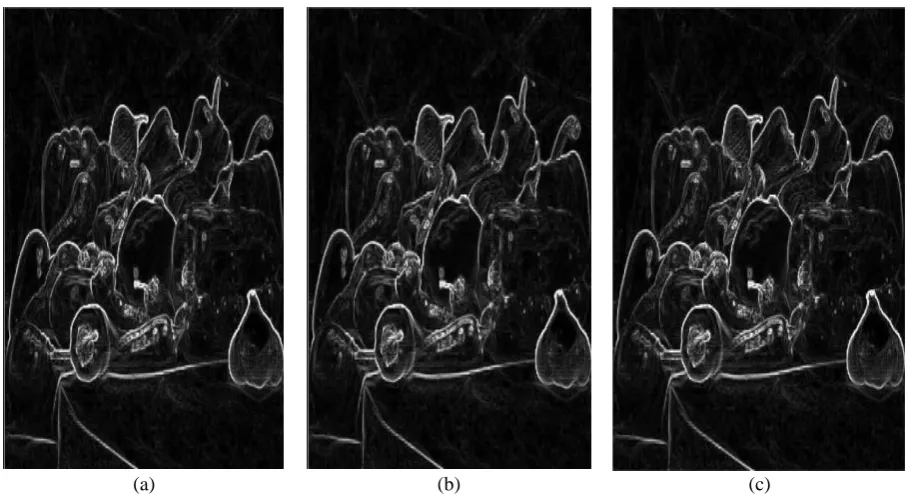
As mentioned before, the Sobel method finds edges using the Sobel approximation to the derivative. It returns edges at those points where the gradient of the image is maximum, Figs. 6 and Figs. 7 displays the results of applying the Sobel method on the original images:
Fig. 5Vegetables Original image
The MATLAB function for this step is:
functioncreatefigure (cdata1)
% Create figure
figure1 = figure;
% Create axes
%Uncomment the following line to preserve the Y-limits of the axes; ylim([0.5 603.5]);
box('on');hold('all');
% Create image
image(cdata1,'Parent',axes1,'DisplayName','data 1');
Figure 5 is about Vegetables image. The statistical value for Vegetables image is:mean =111.5, median =111.5, mode =1 and the standard deviation (STD) =156.3.For recognizing edge and edge direction, Sobel function is used (Figs. 6):
(a) (b) (c)
Figs. 6Vegetables image after used Sobel gradient. (a) Threshold Value= 100, (b) Threshold Value= 150, (c) Threshold Value= 200.
The MATLAB function for this step is:
functioncreatefigure (cdata1)
% Create figure
figure1 = figure;colormap ('gray');
% Create axes
axes1 = axes ('Visible','off','Parent',figure1,'YDir','reverse','TickDir','out','Position',[0.1215 0.1148 0.7567 0.8238],'Layer','top','DataAspectRatio',… [1 1 1],'CLim',[0 255]);
% Uncomment the following line to preserve the X-limits of the axes; xlim([0.5 765.5]); % Uncomment the following line to preserve the Y-limits of the axes; ylim([0.5 603.5]);
box('on');hold('all');
% Create image
image(cdata1,'Parent',axes1,'DisplayName',dataccc1','CDataMapping','scaled');
(a) (b) (c)
Figs.7Edge detected for Vegetables image.(a) Threshold Value= 100, (b) Threshold Value= 150, (c) Threshold Value= 200.
The MATLAB function for this step is: functioncreatefigure(cdata1)
% Create figure
figure1 = figure;colormap('gray');
% Create axes
axes1 = axes('Visible','off','Parent',figure1,'YDir','reverse','TickDir','out','Position',[0.1215 0.1148 0.7567 0.8238],... 'Layer','top','DataAspectRatio',[1 1 1],'CLim',[0 1]);
% Uncomment the following line to preserve the X-limits of the axes; xlim([0.5 765.5]); % Uncomment the following line to preserve the Y-limits of the axes; ylim([0.5 603.5]);
box('on');hold('all');
% Create image
image(cdata1,'Parent',axes1,'DisplayName','data… 1','CDataMapping','scaled');
These edge detection operators can have better edge effect under the circumstances of obvious edge and low noise. There are various edge detection methods in the domain of image edge detection, each having certain disadvantages.As edge detection is a fundamental step in computer vision, it is necessary to point out the true edges to get the best results from the matching process. That is why it is important to choose edge detectors that fit best to theapplication.
V. CONCLUSION
The advantage of Sobel edge operator is its smoothing effect to the random noises in the image. And because it is the differential separated by two rows or two columns, so the edge elements on both sides have been enhanced and make the edge seems thick and bright.
Calculate the magnitude and the argument value of the image horizontal and vertical 1st order or 2nd order gradients, at last calculate modulus maxima along the angular direction and obtain the edge of the image. But when the image has lots of white Gaussian noises, it is very difficult to get the peak value of the first derivative; the reason is because that the noise points and the useful signals mix up.
This paper mainly used the Sobel operator method to do edge detection processing on the images. It has been proven by the results we have obtained, that the edge detection mathematical method by simulation using MATLAB software is very good in the analyzing the image.
REFERENCES
[1] N. Ehsan, S. Sara and H. Hamid, "Edge Detection Techniques: Evaluations and Comparisons", Applied Mathematical Sciences, vol. 2, no. 31, pp. 1507 – 1520, 2008.
[2] A. D. Jepson and D. J. Fleet, "Edgel Detection", 2011.
[3] G. Wenshuo, Y. Lei, Z. Xiaoguangand L. Huizhong, "An Improved Sobel Edge Detection", IEEE, 2010. [4] Trucco and Jain et al., "Edge detection", Chapter 4 and 5.
[5] J. P. G. Abel, "Edge Detectors: Visual Computing and Multimedia", Departamento de Informática, Universidade da Beira Interior Portugal, 2011.
[6] C. John, "A Yariational Approach To Edge Detection", AAAI-83 Proceedings, 1983.
[7] J. M. Elham J. M., "Segmentation of SAR Images Using Edge-Detector Method," Al-Mustansiriya Journal of Science, vol. 19, no. 7, pp. 21-31, 2008.
[8] B. Saketand M. Ajay, "A Survey on Various Edge Detector Techniques", Published by Elsevier Ltd.doi: 10.1016/j.protcy. 2012.05.033, 2212-0173, 2012.
[9] K. J. Anil, “Fundamentals of Digital Image Processing”, pp. 347-353.
[10] K. B. Samir, "Edge Detection from CT Images of Lung", (IJESAT) International Journal of Engineering Science & Advanced Technology vol. 2, Issue 1, pp. 34–37, ISSN: 2250–3676, 2012.
[11] A. Elif, "Sobel Edge Detection Method for Matlab", Assistant Professor ElifAybar Is With Porsuk Vocational School, Anadolu University, Eskisehir. E-Mail: [email protected]. Fax: 0 222 224 1390.
[12] S. A. Salem, N. V. Kalyankar and S. D. Khamitkar, "Image Segmentation By Using Edge Detection", (IJCSE) International Journal On Computer Science And Engineering, vol. 2, no. 3, pp. 804-807, 2010.
[13] T. A. Al-Aish, "Edge Detection in Sensor Networks using Image Processing", Diala , Jour., vol. 31 , Iraq, 2008.
[14] R. Fisher, S. Perkins, A. Walker and E. Wolfart, "Edge Detectors", 2003.
[15] G. Wenshuo, Y. Lei, Z. Xiaoguangand L. Huizhong, "An Improved Sobel Edge Detection", IEEE, 2010.
[16] M. A. Fari, "Study Of Image Segmentation By Using Edge Detection Techniques", International Journal of Engineering Research & Technology (IJERT), vol. 1, Issue 9, 2012.
[17] K. V. Manojand S. U. Nimbhorkar, "Edge Detection of Images Using Sobel Operator", International Journal of Emerging Technology and Advanced Engineering Website: www.ijetae.com, ISSN 2250-2459, vol. 2, Issue 1, 2012.
[18] J. M. Elham, J. M. Ahmed, J. M. Zainab and et. al., "Design Study Sobel Edge Detection", International Journal of Application or Innovation in Engineering & Management (IJAIEM), ISSN 2319 – 4847, Vol. 2, Issue 12, pp. 248-253, December 2013.
BIOGRAPHY
Elham Jasim Mohammad, was born in Iraq, she received her Ph.D. degree in Optoelectronics Physics Science from Al-Mustansiriyah University, her M.S. degree in Image Process, Physics Science from Mustansiriyah University. She received B.S. degree in Physical Science from Al-Mustansiriyah University. She works as a University Professor in the Department of Physics Science from Al-Mustansiriyah University, Baghdad, Iraq.
![Fig 1 Intensity graph of a signal [2], [5].](https://thumb-us.123doks.com/thumbv2/123dok_us/1695338.1214648/2.595.165.430.497.643/fig-intensity-graph-signal.webp)
![Fig 2 First derivative of the signal [2], [5].](https://thumb-us.123doks.com/thumbv2/123dok_us/1695338.1214648/3.595.174.423.358.493/fig-derivative-signal.webp)