A QUANTITATIVE STUDY OF VARIATIONS I N INTENSITY OF GENOTYPES OF THE GUINEA PIG AT BIRTH'v2
SEWALL WRIGHT
Department of Genetics, University of Wisconsin, Madison, Wisconsin
Received February 16, 1959
HE major uniform color varieties of the guinea pig can be put most conven-
T
iently into seven series, each of which ranges from barely distinguishable from white to full intensity.1. Dark eyed dark sepia 2. Pink eyed pale sepia 3. Brown eyed dark brown
4. Pink eyed pale brown
5. Pink eyed pale brownish cream
6. Stable yellow e e - - - F
7. Fading yellow e e - - - f f
Genes F , f make no difference in dark sepias (1) or dark browns ( 3 ) (with a minor qualification in the latter). No difference between B and b b has been de- tected in the pale brownish creams ( 5 ) . Neither of the pairs B, b or P , p make any difference in coat colors of yellows (6,7) at birth but do make a difference in the sootiness that often develops later in yellows. They also make a difference in the color of the skin especially in the ears, feet and nose which are dusky to black with B P , brown with bbP and very pale with pp. Skin color is similar in quality in yellows and nonyellows but less intense in the former. Eye color in yellows depends on B,b, P,p in the same ways as in nonyellows, (CBP Dark,
C b b P brown, C-pp pink).
Any of the eumelanic colors (1 to 5 ) may be combined with the correspond- ing yellow in a tortoise-shell pattern by substitution of e* for E . These same colors may be combined in a banded pattern in each hair (agouti) by substituting A for aa. This substitution has no effect on yellows at birth, but the presence of A is revealed in adult sooty yellows by a clear yellow subterminal band, like that in agoutis. Much of the data of the present paper is derived from tortoise-shells but none from agoutis.
The variations in intensity of these seven series depend primarily on the com- binations of the C alleles ( C , ck, 6 , c7, p ) that are present. C (dominant) deter- mines the highest intensity (with qualifications in the case of the dark brown). With c a p there is albinism, white with pink eyes, irrespective of anything else.
E a a B P - E aa B p p F E a a b b P - E aa b b p p F E aa - p p ff
1 Paper No. 740 from the Department of Genetics, University of Wisconsin.
2 This investigation was aided by a grant from the Wallace C. and Clara A. Abbott Memorial
Combinations crc? and crcn reduce yellow to white in the coat but leave the eu- melanic colors of coat and eye at intermediate grades. Combinations in which
cd or ck are the highest alleles bring about different grades of intensity of eu- melanin ( P more intense, cd somewhat less intense, than c') but almost the same grade of yellow at birth. Heterozygotes among ck, cd, cr and ca are intermediate.
I n the colony here studied (largely self contained since 1916) animals have been assigned grades indicating intensity at birth and later. on the basis of stand- ard squares of dorsal skin. chosen so that each grade is barely distinguishable from the preceding. The yellows in the experiments described here ranged from grade 1 barely distinguishable from white to grade 11 for the most intense "red". Modifying factors that increased intensity of eeCCFF to grades 12 or 13 at an earlier period, were absent. The sepias and browns are enough alike to be graded on a single scale ranging from 1 to 21 for intense black.
There has been considerable residual variability about the averages established in terms of the preceding factors (WRIGHT 1949). Analysis in the preceding paper (WRIGHT 1959b) indicated that most of this in stable yellows, dark sepias and lower c genotypes of dark brown has been due to two pairs of alleles Si& and
Dm.dm. I n the pale sepias and pale browns the effects of these have been over- shadowed by unanalyzed factors. The situation in C dark browns is peculiar (WRIGHT 1947). The present paper will be concerned with putting the analysis of the effects of gene replacements especially at the Si and D m loci on a quanti- tative basis.
Gene si ("silvered") has three somewhat different effects (WRIGHT 1959a). It tends to bring about silvering (a sprinkling with white hairs, most pronounced on the posterior belly, least on cheeks and feet). This effect is most conspicuous in blacks (EBCP) but is also pronounced in intense browns (EbbCP) and pale sepias (EBCpp). somewhat less in reds (eeCFF). fading yellows (eeC8) and dilute sepias (EcdcdP). It is usually unrecognizable in the more dilute dark sepias
iEcdcaP, Ec'c"P etc.) and light yellows (pecdcRF-). Even in blacks the degree of silvering is greatly affected by modifiers and may range from mere traces on the belly to almost white, except for silvered patches on the head and scattered dark hairs on the back. In a typical cross about half the heterozygotes are unsilvered and about half have slight silvering restricted to the belly. In a segregating progeny, heterozygotes overlap both homozygotes. A second effect is dilution i n unsilvered as well as silvered areas. There is an inverse relation to degree of silvering. Dilution is barely appreciable in blacks, intense browns and pale sepias with C . It is more conspicuous in reds and fading yellows and such dilute dark sepias as E B c V P and dilute yellows as e e c V F F . It is most conspicuous in the light sepias ( EBcdc"P) and light yellows (eecdc"FF). While decidedly less intense than with
SiSi,
these are often as uniform except perhaps for especial lightness of the belly. As a third effect, it is convenient to recognize blotchiness.I N T E N S I T Y O F GENOTYPES 1003
Blotchiness in intensity may suggest the presence of sisi in reds and yellows where no silvering is apparent.
The gene d m , "diminished," has little or no effect in the presence of C but in lower c genotypes brings about a diminution of intensity similar to that due to si but lacking the silvering and blotching effects of the latter. I n the combination sisidmdm, however, the coat becomes pure white, except, in some cases, for spots on the head that are of much reduced intensity and, if C is present, strongly silvered. Even eye color is slightly reduced. These "silver-whites'' may be looked upon as animals in which the blotching, silvering and dilution effects of si have all been carried to an extreme. Silver-whites are anemic and low in viability. The males, as far as known, are always sterile from absence of spermatogenesis and the females are less than half as productive as their normal sisters.
The effects of si and d m were found to be approximately equal and cumulative in diminishing color in combinations with lower c alleles. It will often be con- venient to designate the plus alleles of si and d m merely by J- signs, and, for cer-
tain purposes to group the combinations according to the number of plus factors: sisit-dm and +sidmdm as class 1, sisi
++,
+si +dm and 4 - S d m d m as class 2, +si++ and +++dm as class 3, and++-t+
as class4.
The conclusions on si and d m indicated above were based largely on the analy- sis of a large network of matings descended from one (L254) between two ex- treme dilute yellows that produced silver-whites (both eeBbcdc"PpFF, one +sidmdm, the other sisi+dm) and another mating (L263) between an extreme dilute offspring of the preceding and a dilute tortoise-shell of about normal in- tensity (eecdc"BbPpFF+sidmdm x ePecdcaBBPpFF t+ + d m )
.
Later outcrosses, especially to an established silvered black-red strain (ePePBBCCPPFFsisi++) also played an important role in the analysis.All of the matings in this network, including the outcrosses, were assigned formulae in &,si and D m , d m consistent with the intensities of the mated animals and the formulae assigned their parents, with the mean grades and indications of segregation of intensities among the offspring, including especially the occur- rence or not of silver-whites, and finally the formulae assigned to all offspring that were mated.
The assignment of genotypes on the basis of routine visual grades was rendered difficult by the smallness of the effects attributed to replacement of a single plus factor by its allele. About one unit was indicated in the dilute yellows, about twice this in the dilute sepias, complicated in the latter by more residual vari- ability. As a difference of one unit is just recognizable by definition, even in direct comparisons, there is room for considerable subjective error.
As litters were graded without reference to the grades in the previous litters, the records for several litters from a mating were deemed reasonably satisfactory in indicating the average level of intensity and in indicating whether segrega- tion, other than that due to c genotypes, was or was not occurring within litters.
Even where such grades were available, however, there was often doubt about the assignment of formulae. The greatest difficulty was in deciding between si and d m in parents. A wrong tentative decision would usually be revealed sooner or later by inconsistencies if several off spring were mated, but in the case of a peripheral mating there was often nothing that could be done but compare probabilities. Thus in cases in which it was clear that a n animal was transmitting a diminution factor but there was no direct evidence on whether it was d m or si, the former was preferred on the basis that its frequency was undoubtedly much greater both in the above network of matings and in outcrosses to the main color experiment (in which overt silvering had always been selected against in the rare cases when it appeared). Test matings with the intense silver strain were, however, often made to determine whether key animals were transmitting si.
I n an earlier series of studies (RUSSELL 1939; HEIDENTHAL 1940; WRIGHT and BRADDOCK 1949) colorimetric determinations had been made of weighed hair samples of animals of many genotypes and these had been correlated with the visual grades of the same animals. These led to formulae by means of which the averages for the much more numerous visual grades for given genotypes could be transformed into quantities of pigment, relative to appropriate standards.
This method of grading was, however. much too slow to be useful in the present connection. The method that was used was that of obtaining galvanometer read- ings of the intensity of the color in the middle of the back by means of a reflec- tionmeter (cf. WOLFF 1955; BLAIR 1947). It is possible to transform these to ap- proximate relative quantities of pigment by way of the relation of the visual grades to them and of the colorimetric values to the visual grades.
The purpose of the present paper is to provide estimates based on a large num- ber of readings of this sort for newborn animals of a great variety of genotypes. The results are most complete with respect to the effects of combinations of the c genotypes. Si,si and Dm,dm on dark sepia ( (E,eP)BP) and stable yellow The use of the reflectionmeter in our laboratory (University of Chicago) has been described by WOLFF (1955) who studied the effects of temperature and aging on the coat colors of guinea pigs of many genotypes from these same experiments.
A photovolt photoelectric reflectionmeter. Model 61 0, was used. This consists of a galvanometer and a search unit containing a light bulb. a photoelectric cell and a choice of three filters, amber, green and blue. It is set to give a reading of zero in the absence of reflected light and 100 for light reflected from a standard enamel plate. A white standard was used for the lighter colors, a gray one for the darker colors. Before taking readings of a litter of guinea pigs with a given filter, checks were made on a darker standard plate and on a black slide box. A freshly washed glass slide was placed on the back of the guinea pig and the search unit was put against this. Light from the bulb reflected from the smoothed hairs to the photoelectric cell resulted in a galvanometer reading. Two readings were taken with each filter and averaged.
INTENSITY O F GENOTYPES 1005
The effect of the double passage of the light through the glass slide was found by repeated tests of standard plates, with and without the slide. The relation be- tween the gray and white standards was similarly studied. There were two times during the three years during which records were taken, in which changes in the bulb or wiring required a careful comparison of series of readings made on standard plates before and after. Tables were prepared by means of which a read- ing made under any set of conditions could be transformed to that for the white standard, no slide on the object and the original bulb and wiring.
On comparison of the galvanometer readings with the visual grades, it was apparent that the scale of the former was a very awkward.one. With the darker colors a difference that was very conspicuous to the eye registered only a slight difference on the galvanometer while the opposite was true of the pale colors, from which much light was reflected. The difference from the scale of actual quantities of pigment, as determined colorimetrically, is still greater.
The amounts of variability of single genotypes were found to be more alike at all levels of intensity on the intermediate visual scale than on either the galva- nometer readings or the actual amounts of pigment. It accordingly seemed better to transform the galvanometer readings to a scale roughly proportional to the former rather than to the latter. It was found that this could be done by finding the average of the logarithms of the galvanometer readings for the 62 whites that were graded and then subtracting from this the logarithm of the reading for the guinea pig under consideration. This was multiplied by 10 to give numbers of more convenient size.
I,
= 10 (log R, - log R,) Tables were pre- pared for transforming the readings with each filter after reduction to a common standard as described above. As a check: another set of tables was prepared to transform each original reading directly to the scale I, at a single step. The final figure was thus obtained in every case by two different routes.The indices from the three filters give a means of describing the qualitative differences among the various coat colors in quantitative terms. The present paper, however, is concerned merely with intensity within each series of colors. The three indices have been added to obtain a single index. I =
la
+
I C+
I,
where
I,
andI,
are the indices from the amber, green and blue filters respectively.The reflectionmeter indices, I , were used in two ways to get estimates of the mean indices for the various genotypes. The first is based on the assignment as accurately as possible of genotypes with respect to si and dm to each graded in- dividual of a given color series and c genotype. The method can be illustrated by considering the case of grades of yellow of genotype cdcdFF. Grades were taken of tortoise-shells with sufficiently large yellow spots on the back as well as of self yellows.
INTENSITY O F GENOTYPES 1007 always pure white in the middle of the back). I t also shows the number of off- spring of genotype CdCdFF from which readings of yellow were taken, and the means of the indices. Totals of the expected numbers of each of the si d m geno- types are shown below in two categories “pure” and “mixed,” and “grand total.” Class totals are also shown. The last refers to the number in each class, 1 to 4, ac- cording to the number of plus factors. The category “pure” refers to the expecta- tion from matings expected to produce only the genotype in question within its class. The expectations from the matings that could produce two or three si d m
genotypes in the class in question are called “mixed.” I n the case of cdcdFF yellow, about 53 are expected to have one plus factor (+sidmdm or sisi+dm),
about 184 are expected to have two, about 96 three and about 36 four in the total of 369 graded individuals.
Among these 369 individuals, 77 were mated and accordingly assigned geno- types which took into account their offspring and descendants as well as their own grades and the genotypes assigned their parents. These were entered under the appropriate si d m genotype. All of the unmated offspring from matings be- tween homozygotes were next entered under the appropriate genotypes. Among those left, those with the lowest indices from matings expected to produce class 1 were assigned to +sidmdm, sisi+dm or mixed according to the possibilities from the mating in question until the quota of 53 for class 1 was filled. The pure and mixed subdivisions of class 2 were then filled with those of the lowest indices not already assigned, from matings expected to produce this class, until its quota of
153 was complete. The classes with three plus factors were filled similarly, up to its quota of 96, leaving 36 in class 4.
I n spite of the somewhat arbitrary assignment, in part by rank, there was considerable overlap because of mated individuals whose assigned genotypes were somewhat out of line, and because of individuals that were somewhat out of line with respect to possibilities provided by the genotypes assigned their parents. Nevertheless one might expect this method to be subject to a systematic error in the direction of spreading the averages. What it gives are upper limits to the es- timates of the differences among the means, apart from errors in the assignment of genotypes to thematings.
Table 2 shows for yellows of each c genotype, the assigned number ( n o ) , the expected number (n,) and the mean index pertaining to each class and subclass with respect to si and d m . The sampling errors for intense yellows (C) may be taken as d1.73/n0 and for all lower c combinations as d . 7 9 / n O on the basis of pooled variances presented in Table 4.
It may easily be seen that there are highly significant differences between classes under any given c genotype. There are, however, few differences within classes on which any confidence can be based. The most striking is between the silvered reds of genotype Csisi
++
(20.8 2 .38) and the unsilvered ones of geno- types C++dmdm (23.9*
.58) and C+si+dm (22.5 IfI .58). These unsilvered reds of class 2 are as intense as reds of classes 3 or 4. Genotype C++dmdm,INTENSITY O F GENOTYPES 1009
. . . . . . . . . . .
a m : : : : h
. . . . . . . .
. . .. . . . . .
wa m : : : : a w
. . . . . . . . . . . . .
n m : : : : w
n m
-h-7
Y : q m "
.
$.
. W O O 1 ' m d m 'A
3
: : : : : :E 1 : ' . . '
g : :
a z a
c _y_jQ
n
cc! . . . . . .
-
. . .E?
-
romz
3 z
: $ W c f u ) Mh
i
T A B L E 4
Intruelass variances ( u 2 ) and degrees of freedom for indicated genotypes
Dark sepia ( E B P )
Genotype d . f . o2 Genotype d.f. U2 Genotype d.f. U?
Palc sepia ( E R p p F F )
Yellow ( r e )
C FF 134 1.73 C 78 1.70 C 62 13.79
c W F F 38 .65 CkcAdr 88 1.07 CkCkd 28 5.31
&cdFF 44 .79 C , ch@dT 166 1.36 22 4.76
c d C d 37 1.80
CkC5 69 1.38
chcr(IFF 119 .36
cdca 66 3.25
cdcd 75 1.95
cdcdFF 365 .82
crcr 40 4.33
CdCl 34 143
cdcraFF 268 .94
CrCa 16 2.85 FF(exc1C) 834, .79 Cdc" 168 2.11
38 2.76 crcr 544 2.00 excl C 209 3.60
ckdCkdFf 5 1.66 cyeo 169 2.08
C f f 54 2.94 excl C,c'c&dT 569 1.94
c
F fCkdCkdff 12 4.55
Pale brownish cream ( E p p f f ) Darh brown I E b b P Pale brown ( E b b p p F F )
Genotype d f 6 Cenot\pe d E o? Genotype d f U2
E C p p f f 121 3.49 C ( n o n d n ) 197 3.57 C 37 4.80
Ck- 10 1.07 cdcdr 31 3.32
Cdd' 25 3.95 CdCQ 37 3.60
cdca,crdJ 47 1.94 C'C7U 25 2.36
excl C 82 2.46 excl C 93 3.13
intense than yellows of any other category. It seems that ++dmdm and probably
+si+dm cause no diminution of intense yellow whatever while sisi++ causes
appreciable diminution even in the unsilvered areas in which the grades were taken. There is a parallel difference between s i s i t d m (1 7.8 2 .43) and S s i d m d m
(19.8 2 .77) but it is of doubtful significance. Among the
CdCd
yellows there is an apparently significant difference between the silvers ( 13.1 f .21) and the othersof class 2 (12.1 .07) but it is in the opposite direction from that in the C yel- lows. There is a suggestion here that d m interacts specifically with the lower c alleles in diminishing their intensity while si acts more uniformly with all c al- leles. The scanty data in other cases do not, however, add support to this idea. Table 3 presents similar data for the dark sepias. The standard errors of blacks (C,CkCkdr) may be taken as \/1.36/na and for the other dark sepias as d l . 9 4 / n 0 from the pooled variances in Table 4. There are no differences within classes of the same c genotype that are significant. This holds also for the scanty data from the remaining color series.
From this point all data will be grouped by classes except in the one case of intense yellows of class 2 (sisi++ vs. +si+dm and ++dmdm collectively).
INTENSITY O F GENOTYPES 1011
TABLE 5
Marings that produce yellows of gemtype cdcdFF, classified according to the expected ratios with respect to modifier classes, the obserued mean indices from each, the expected mean
from estimation of the effects of the modifiers and the differences between described in the text
obserued and expected means. The weights (w) are as
Yellow c V F F Class (no. of plus factors)
n W (4) (3) ( 2 ) ( 1 ) mo m, mo-m,
21 21.0 . . . m4 . _ . . . . . . , = 16.31 16.41 - .10
14 6.7 .500m,
+
.500m, . . . . . . = 15.97 15.47+
.5017 5.3 .%Om,
+
.500m,+
.250m2 . . . = 14.74 14.36+
.3817 4.1 .125m,
+
.375m,+
.375m,+
.125m, = 13.55 13.35+
.2O19 4.5 .067m,
+
.266m,+
.@Om,+
.267m, = 12.42 12.65 - .2317 17.0 . . . . . . m3 . . . . , . = 14.86 14.52
+
.34 83 39.5.
..
.500m,+
.500m2 .. .
= 12.88 13.26 - .38 42 14.0 . . . .250m,+
.500m,+
.250m, = 12.05 12.34 - .29 5 1.7 . . . .143m,+
.428m,+
.429m, = 12.26 11.86+
.4070 70.0 .
. .
. . . . . . m2...
= 12.09 12.00+
.09 59 31.1 . . . . . . .500m,+
.500m, = 11.58 11.41+
.17 4 2.2 . . . . . . ,333 m2+
,667 m, = 10.92 11.22 - .30 1 1.0 . . . . . . . . ..
. . m, = 9.60 10.83 -1.23Bnp269 . . . 35.7 96.6 183.7 53.0
Z w p . . 218.1 26.5 49.2 118.4 24.0
form of a series of observation equations i n each of which the sum of the un- known means for the various classes (ml, m,, m3, m4), each multiplied by the expected proportion of offspring in its class (excluding sisidmdm) is equated to the observed mean for the type of mating in question. The weights to be as- signed these equations should be proportional to the reciprocals of the squared standard errors of their means. As some of the theoretical variances are based on very small numbers, it seemed best to use estimates of the theoretical variances, taking account of both the variances within and among classes. Estimates of the latter were obtained by using the estimates of the means obtained by the first method. As variances of these were expected to be somewhat too large and those within the classes somewhat too small, because of the mode of assignment of in- dividual genotypes, the estimates of the variance within classes were arbitrarily increased 25 percent. The results seem to indicate that this was too large a correc- tion, but the effect of slight difference in the relative weights of the equations can have no appreciable effect on the result, at the level of precision that the data permit. The most important factor in a weight remains the number of offspring from the type of mating in question, The intraclass variances used were 2.2 for intense yellows ( C )
,
1.O
for the dilute yellows, 1 . 7 for the blacks (C, CkCkd") andcases with the widest segregation, to equality with the number in the cases with no segregation at all.
This method, in contrast with the first, has no systematic error. On the other hand, it loses all of the information given by the actual segregation among the offspring of the types of mating. Both methods are of course affected by mistakes in the assignment of genotypes. Since this assignment is partly based on the mean intensities of the off spring there is to some extent circular reasoning in deducing the means of genotypes from them. This is greatly mitigated, however. by the fact that the progeny means of the reflectionmeter indices with respect to a par- ticular color (here yellow) and a particular c genotype (here cdcdFF) is, as previously noted, only a small part of the information on which genotypes are assigned to the parents.
The commonest type of error in assigning si dm genotypes was probably in replacing one of the same class by another (e.g., +si++ by f f f d m )
.
Such er- rors would blur the differences in the effects of si and dm indicated by the first method, but would have little effect on the class means estimated by the second method, assuming that these differences are small.The least square method tends to break down where the total expected number of any class is very small, since in this case this class may not actually have been present at all, or if present from one or two types of mating, its effect on the means may be overbalanced by accidental difference in the ratio of the other genotypes. Thus in the Ckcd yellows the expected number in class 1 is only 0.9. Just one +sidmdm was probably present, as indicated by a single outstandingly light segregant (index 9.4) but the mating type in which this occurred had such an unexpectedly high average that the solution for m, comes out higher than for
mz and m3. It seems best to drop m, from the parameters to be estimated in this case and revise the expected proportions from the mating type expected to pro- duce 12.5 percent +sidmdm in accordance and revise the mean by omitting the one probable representative of this genotype. Similarly the expected number of
tsidmdm for CkCkdr blacks is 0.6. There was again one offspring from the one mating type expected to produce this that was much lighter than all others (37.2). Again class 1 and its probable representative were omitted from the least square estimate.
In a number of cases the least square estimates for m, and even m? came out about the same or slightly larger than m4. These were cases in which there was probably little or no real difference and also ones in which the evidence for as- signing genotypes was most deficient. It seemed best, accordingly, to group classes 2, 3 and 4 in the case of CFF yellows (except for sisi++). Similarly classes 3 and 4 are grouped in
ckck
yellows, classes 2, 3 and 4 in the case of C-blacks and classes 3 and 4 in the cases of sepias of genotypes c'Y+~', @cn, cdcr, crcT and c'cu. These are also grouped in the final estimate by the first method since the small difference found originally could well have been imposed by the method.
INTENSITY O F GENOTYPES 1013 SE =
.\/Zw
(mo-mc)a/K Z w p where K is the number of degrees of freedom among mating types, p is the proportion of the given class expected from each mating type, w is the weight and no and m, are the observed and estimated means for the mating types. The values of Zwp are shown in the bottom row of Table 5 (case of cdPFF yellows).Tables 6 and 7 give comparisons of the mean indices for the various genotypes of yellows and dark sepias respectively derived by the two methods. The results
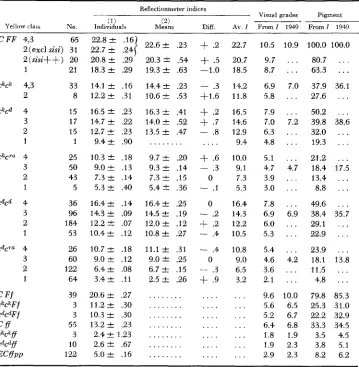
TABLE 6
Comparison of estimates of mean indices for the various genotypes of yellows based ( 1 ) on indi- vidual assignment of genotypes and ( 2 ) on least squares from the means of mating types.
The differences and a weighted average are shown. The corresponding visual grades are estimated from these averages and compared with 1949
uisual grades. The amounts of pigment are estimated from these. Reflectionmeter indices
Visual grades Piament Diff. AV. I Froml 1949 F r o m l 1949
( 2 )
Means
(! 1
Yellow class No. Individuals
C FF 4,3 65 22.8 f .I6
2(excl sisi) 31 22.7 f .2+
1
22.6 f .23+
.2 22.72(sisi++) 20
1 21
ckck 4,3 33
2 8
CkCd 4 15
3 17
2 15
1 1
ckcva 4 25
3 50
2 43
1 5
CdCd 4 36
3 96
2 184
1 53
Cdc'a 4 26
3 60
2 1 22
1 64
c
F f 39ckcliFf 3
c@Ff 3
c f f
55ckchff 3
C @ f f 10
E W P P 1 22
20.8 & .29 18.3 k .29 14.1 f .I6 12.2 f .31 16.5 f .23 14.7 f .22 12.7 f .23 9.4 a .90 10.3 f .18 9.Of .I3 7.3 f .I4 5.3 & .40 16.4 f .I4 14.3 f .09 12.2 IT .07 10.4 -C .I2 10.7 & .18 9.0
c
.12 6.4 f .08 3.4 -t .I1 20.6 f .27 11.2 f .30 10.3 f .30 13.2 f .23 2.4 f 1.23 2.6 k .67 5.0 f .I620.3 f .54 19.3 & .63 1 4 . 4 f .23 1 0 . 6 f .53 16.3 f .41 14.0 & .52 13.5 f .47 . . .
9.7 f .20 9.3 & .14 7.3 .I5 5.4 t .36 1 6 . 4 f .25 14.5 f .I9 12.0 f .12 10.8 f .27 11.1 f .31 9.0 f .25 6.7 f .15 2.5 f .26 . . . . . . . . . . . . . . . . . . . . .
+
.5 -1.0- .3 +l.6
+
.2+
.7- .8 . . . .
+
.6-
.3 0- .I
0
- .2
+
.2- .4
- .4
0
- .3
+
.9 . . . . . . . . . . . . . . . . . . . . . . . . . . . . 20.7 18.5 14.2 11.8 16.5 14.6 12.9 9.4 10.0 9.1 7.3 5.3 16.4 14.3 12.2 10.5 10.8 9.0 6.5 3.2 . . . . . . . . . . . . . . . . . . . . .TABLE 7
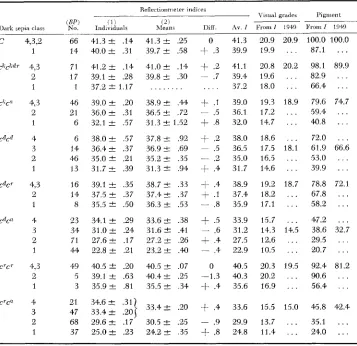
Meun indices for uurious genotypes of dark sepia and derived estimates as in Tnble 6
Reflectionmeter indiws
~ Y~qual grades I'ignient
( 1 1 123
Ildrk sepia class Individuals &lean5 Diff. AV. I From I 1949 From I 1949 C 4.3.2 , , 66 41.3 -C .14 41.3 2 .25 0 41.3 20.9 20.9 100.0 100.0
1 4,3 2 1 4.3 2 1 4 3 2 1 4.3 2 1 4 3 2 1 4.3 2 1 4 3 2 1
14 40.0 2 .31 71 4 1 . 2 2 .I4 17 39.1 2 .28 1 37.2 t 1.17 46 39.0 ? .20 21 36.0? .31 6 32.1 t .57 6 38.0 t .57 14 36.4? .37 46 35.0 ? .2l 13 31.7-C .39 16 39.1 ?z .35 14 37.5 ? .37 8 35.5
*
.50 23 34.1 ? .29 34 31.0 2 .24 71 27.6-C .I7 44 22.8 & .21 49 40.5 t .20 5 39.1 t .63 3 35.9 -C 3 1 21 34.6 ? .31 47 33.4 t .20 68 29.6 2 .I7 37 2 5 . 0 k .2339.7 t .58 41.0 4 .14 39.8 t .30 . . .
38.9 4 .44 36.5 4 .72 31.3 4 1.32 37.8 4 .92 36.9 4 .69 3 5 2 4 .33 31.3 4 .94 38.7 4 .33
37.4c 4 .37 36.3 4 .53
33.6
+-
.38 31.6 2 .41 27.2+-
.26 23.2 4.a
40.5 t .07 40.4 t .25 35.5 4 .3433.4 & 2 0 30.5 -C- .25 24.2 4 .33
+
.3+
.2 - .7. . . .
+
.I - .5+
.8+
.2~ .5
- .2
+
.4+
.4+
.I - .8+
.5- .6
+
.4- .4 0 -1.3
+
.4+
.4+
.8 - .939.9 41.1 39.4 37.2 39.0 36.1 32.0 38.0 36.5 35.0 31.7 38.9 37.4 35.9 33.9 31.2 27.5 22.9 w.5 40.3 35.6 33.6 29.9 24.8
19.9 . . . 20.8 20.2 19.6 . . . 18.0 . . . 19.3 18.9 17.2 . . . 14.7 . . . 18.6 . . . 17.5 18.1 16.5 . . . 14.6
.
. . 19.2 18.7 18.2 . . . 17.1 . . . 15.7 . . . 14.3 14.5 12.6 . . . 10.5 . . . 20.3 19.5 20.2 . ..
16.9 . . .
15.5 15.0 13.7 . . . 11.4 . . .
87.1
. . .
98.1 89.966.4 . . . 79.6 74.7 59.4 . . . 40.8 . . . 72.0 . . . 61.9 66.6 53.0 . . . 39.9
.
. . 78.8 72.1 67.8 .. .
58.2 . . .47.2 . . . 38.6 32.7 29.5 . . . 20.7 . . . 92.4 81.2 90.6 . . . 56.4 . . ,
45.8 42.4 35.1
.
..
24.0
.
. . 82.9 . . .of the least square estimate from mating type means may be seen to be rather close to those obtained from assignment of genotypes to individuals, in both tables.
I n most cases, the sampling standard errors are much larger for the least square estimates as expected from the loss of information. I n some cases, however, they came out about the same, presumably because of accidentally small values of Bw (m,-m,) in the least square standard errors.
INTENSITY O F GENOTYPES 1015
I t is desirable to obtain a single estimate for each genotype. The estimates from the individual assignments use all the data but are subject to systematic error. On the other hand those obtained by the method of least squares are not subject to systematic error but do not use all the information. The differences are, how- ever, so slight (after making the groupings noted above) that it makes little difference in most cases which is used. There is so little indication of systematic error in the first estimates that they might well be used. The averages weighted by the reciprocals of the squared standard errors of sampling make considerable use of the least square estimates where these are most reliable and make little use of them otherwise. These are shown in Tables 6 to 10 (AV. I ) . They do not differ in any case from those from the first method by amounts that can be considered important but may be supposed in general to give a slight correction of the systematic error of the method. The sampling standard error cannot of course be less than by the first method, based on individuals.
Visual grades in relation to reflectionmeter indices
It is desirable to compare these estimates with those obtained previously
(WRIGHT 1949) from visual grades and from colorimetry in which the si d m
TABLE 8
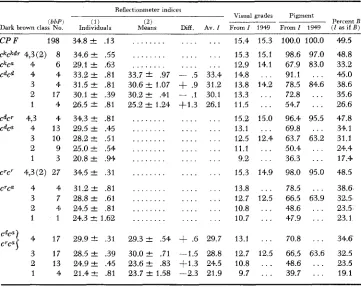
Mean indices for various genotypes of dark brown and derived estimates as in Table 6
Reflectionmeter indices
( 2 )
Visual grades Pigment
_____ ~ Percent B
Means Diff. AV. I From I 1949 From1 1949 ( I a s i f B )
( b b P i
Dark brawn class No.
C P F 1 98
&9. 4,3(2) 8 c k c a 4 6 CdCd 4 4
3 4
2 17
1 4
c d c " 4,3 4s
C d P 4 13 3 10
2 9
1 3
crcr 4.3(2) 27
c"P 4 4
3 7
2 4 0
1 1
34.8 f .I3 34.6 & .55 29.1 2 .63 33.2 2 .81 31.5 2 .81 30.1 ? .39 26.5 2 .81 34.3 & .81 29.5 2 .45 28.2 & .51 25.0 & .54 20.8 2 .94 34.5 2 .31 31.2 2 .81 28.8 f .61 24.5 2 .81 24.3 f 1.62
. . .
. . . 33.7 -+ .97 30.6 I+ 1.07 3 0 . 2 2 .41 25.2 2 1.24 . . . . . . . . . . . . . . . . . . . . . . . . . . . . . . . . . . . - .5
+
.9- .1 t 1 . 3 . . . . . . . . .... . . . . . . . . . . . .
... 15.4 15.3 . . . 15.3 15.1 . . . 12.9 14.1 33.4 14.8 . . .
31.2 13.8 14.2 30.1 13.3 . . . 26.1 11.5 . . . . . . 15.2 15.0 . . . 13.1 . . . . . . 12.5 12.4 . . . 11.1 . . . . . . 9.2 . . . . . . 15.3 14.9
. . . 13.8 . . . . . . 12.7 12.5 . . . 10.8 . . .
. . . 10.7 . . .
100.0 100.0 4.9.5 98.6 97.0 48.8 67.9 83.0 33.2 91.1 . . . 45.0 78.5 84.6 38.6 72.8 . . . 35.6 54.7 . . . 26.6 96.4 95.5 47.8 69.8 . . . 34.1 63.7 63.2 31.1 50.4 . . . 24.4 36.3 . . . 17.4 98.0 95.0 48.5 78.5 . . . 38.6
48.6 . . . 23.5 47.9 . . . 23.1 66.5 63.9 32.5,
4 17 29.9 f .31 29.3 2 .54
+
.6 29.7 13.1 . . . 70.8 . . . 34.6 3 17 28.5 f .39 30.0& .71 -1.5 28.8 12.7 12.5 66.5 63.6 32.5TABLE 9
Mean indices for various genotypes of pale sepia and derived estimates as in Table 6
Pale Fepia class C F F 4.3.2 c ' 4 4,3 c w 4.3
ChC' 4.3 ckcn 4 3
cdcd 4 3 2
1
cdcn 4 3 2 1
Reflectionmeter indices Pigment
______ Visual grades percent black
Diff. AV. I From I 1949 From I 1949
( 2 )
Means
( IlPP 1 ( 1 )
S o . Individuals
. . .
60 2 3 . 7 2 .25 . . . 10.9 9.7 22.1 17.1
26 18.4-C .37 . . . 8.5 9.0 14.2 15.1 4 1 9 . 7 2 .95 . . . 9.1 7.4 15.9 10.9 13 1 3 . 7 2 .53 . . . . . . 6.3 6.7 9.0 9.1 11 1 3 . 5 C .57 . . . 6.2 5.2 8.8 6.2
6 1 5 . 9 e .78 16.1 2 .75 - .2 16.0 7.4 . . . 11.3 . . . 7 13.4 I+ .72 12.9 f. .72
+
.5 13.2 6.1 4.7 8.5 5.3 17 13.0 -C .46 1 2 . 9 e .45+
. I 12.9 5.9 . . . 8.2 . . . 11 11.1 ? .57 11.5 2 .55 - .4 11.3 5.2 . . . 6.8 . . .19 8.9 2 .44 8 . 6 e .42 - . 3 8.7 4.0 . . . 4.8 . . . 16 8.1 2 .47 7.9 & .17
+
.2 8.0 3.7 2.7 4.3 2.4 22 8.1 .40 8.0 . 4 0 f . I 8.0 3.7 . . . 4.3 . . .. . . . . .
. . .
13 6.1 2 .53 6.7 i .5l - .6 6.4 2.9 . . . 3.3 . . .
41 7 . 7 k .30 . . . . . . 3.5 2.4 4.1 2.0 17 2.8-C .46 . . . . . . 1.3 0.7 3.3 0.5
67 2 0 . 4 e .41 . . . . . . 9.4 7.7 16.9 11.4
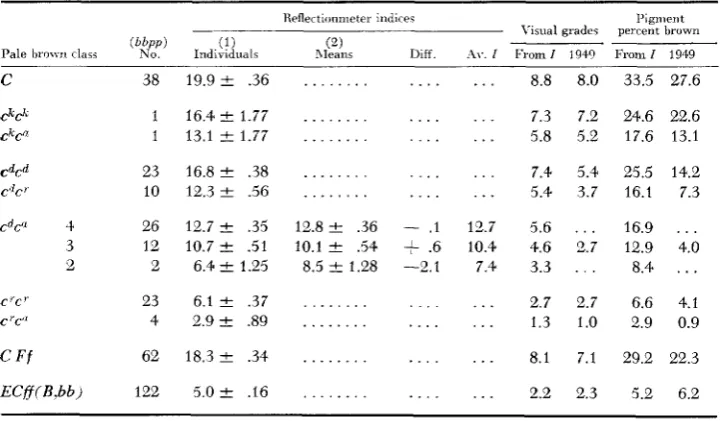
TABLE 10
Mean indices f o r various genotypes of pule brown und deriued estimates as in Trrble 6
Reflectionmeter indice< Pigment
-~ Visual grades percent bruwn Diff. .\I.. I From I 1940 From I 1949 (2)
Rleans (1)
Pale l i r o w i class N o . Individualr
C'C'
c "c"
c
F fECff(B.66)
38 19.9 & .36
1 16.4 2 1.77 1 13.1 C 1.77
23 16.8 2 .38 10 12.3 2 .56
26 12.7 ? .35 12 10.7 +- .51 2 6.4 ? 1.25
23 6.1 -C .37 4 2.9 ? .89
62 18.3 .34
122 5 . 0 2 .16
. . . . . .
. . . . . .
12.8 2 .36 10.1 e .54 8.5 I+ 1.28
. . .
. . .
. . . .
. . . .
- . I
+
.6 -2. 1. .
. . . 8.8 8.0
. . . 7.3 7.2 . . . 5.8 5.2
. . . 7.4 5.4 . . . 5.4 3.7
12.7 5.6 . . .
10.4 4.6 2.7
7.4 3.3 . . .
. . . 2.7 2.7 . . . 1.3 1.0
8.1 7.1
2.2 2.3
33.5 27.6
24.6 22.6 17.6 13.1
25.5 14.2 16.1 7.3
16.9 . . . 12.9 4.0
8.4 . . .
6.6 4.1 2.9 0.9
29.2 22.3
INTENSITY O F GENOTYPES 1017
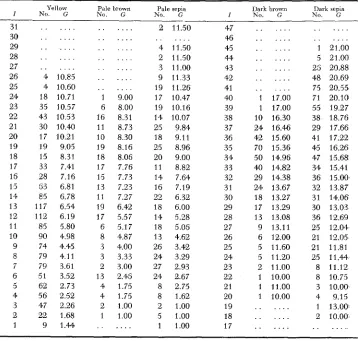
classes were not distinguished. Table 1 1 shows the mean visual grade (G) of the animals for each reflectionmeter index, to the nearest unit, for the various colors. Thus the 90 reflectionmeter indices for yellow that fell in the range 9.5 to 10.4
had an average visual grade of 4.98.
There is a qualification in that 0.60 is added to visual yellow grades 9, 10 and
1 1 . It was noted in a previous paper (WRIGHT 1949) that the gap between visual grades 8 and 9 mas too great, probably because at the time the standards were set up, grades 8 (unusually intense eecdccdFF) and 9 (unusually dilute eeCFF) were rare. It was found that in order to establish a reasonably good linear rela- tion between a simple function of the colorimetric values and the visual grades it was necessary to add at least 0.25 to grades 9, 10 and 11. The data were com- pstible with a la-ger correction by altering the value of an arbitrary constant.
TABLE 11
Mean visual grades ( G ) of yellows, browns and sepias with the indicated reflectionmeter indices, I
Ye1 low Pale brown Pale sepia I)ark brown Dark sepia
I No. G No. G No. G I KO. G No. G
31 30 29 28 27 26 25 24 23 22 21 20 19 18 17 15 13 14 13 12 11 10 9 8 7 6 5 4 3 2 1 . . . . . . . . . . . . . . .
4 10.85 4 10.60 18 10.71 35 10.57 43 10.53 30 10.40 17 10.21 19 9.05 15 8.31 33 7.41 28 7.15 63 6.81 85 6.78 117 6.54 I12 6.19 85 5.80 90 4.98 74 4.45 79 4.11 79 3.61 51 3.52 62 2.73 56 2.52 47 2.26 22 1.68 9 1.44
. . . . . . . . . . . . . . . . . . . . . 1 9.00
5 8.00 16 8.31 11 8.73 10 8.30 19 8.16 18 8.06 17 7.76 15 7.73 13 7.23 11 7.27
19 6.42 17 5.57 6 5.17 8 4.87 3 4.00 3 3.33 2 3.00 13 2.45 4 1.75 4 1.75 2 1.00 1 1.00
. . .
2 11.50 47 . . . 46 4 11.50 45 2 11.50 44 3 11.00 43 9 11 33 42 19 11.26 41 17 10.47 40 19 10.16 39 14 10.07 38
25 9.84 37
18 9.11 36
25 8.96 35
20 9.00 34
11 8.82 33
14 7.64 32
16 7.19 31
22 6.32 30
18 6.00 29
14 5.28 28
18 5.05 27
13 4.62 26
26 3.42 25
24 3.29 24
27 2.93 23
24 2.67 22
8 2.75 21
8 1.62 20
2 1.00 19
5 1.00 18
1 1.00 17
. . . . . . . . . . . . . . . . . . . . . 1 17.00 1 17.00 10 16.30 24 16.46 42 15.60 70 15.36 50 14.95 40 14.82 29 14.38 24 13.67 18 13.27 17 13.29 13 13.08 9 13.11 6 12.00 5 11.60 5 11.20 2 11.00 1 10.00 1 11.00
1 10.00 . . . . . . . . .
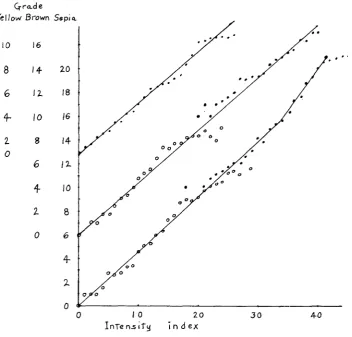
A reasonably good linear relation is found in plotting the mean visual grades of dilute yellows against reflectionmeter indices, but the mean grade for intense yellows ( C F F ) can only be made to fall on a continuation of this line by adding about 0.6 to visual grades 9,lO and 11 (Figure 1 ) . The regression equation comes out:
G y
.430674Z+ .7606 (O<Z<26)It may be seen that the regression line does not pass through visual grade 0 for index 0. It appears that there was very little difference between white and yellow grade 1. It is probable that grade 1 was usually applied to animals that showed traces of yellow on the cheeks but not on the middle of the back where the re- flectionmeter reading was taken.
On plotting the mean visual grades of browns, including both pink-eyed and dark-eyed, against reflectionmeter reading it is apparent (Figure 1 ) that no curve
Grade
I O 16
8
I4 206 12 18
4-
IO 162 8 14
Q
6
iz
4
102 8
0 6
4
2
0
/
I O
0 1 0 20 3 0 40
InTensify i n d e x
INTENSITY O F GENOTYPES 1019 can be expected to fit better than a straight line passing through the origin. There is, indeed, considerable irregularity among more intense pink-eyed browns and the more dilute dark-eyed ones. These apply, however, to only a very small pro- portion of those graded. The regression line is as follows.
On plotting the mean visual grades of pink-eyed and dark-eyed sepias against reflectionmeter reading, it is found that there is a good linear relation up to about index value 35 apart from a few of the more intense pink-eyed sepias which do not seem to have been given sufficiently high visual grades. The regression line, which can be made to pass through the origin satisfactorily is as follows (based on values 1 from 1 to 35).
Gs = .459864 I (0<1<33.4)
The more intense sepias and blacks do not, however, fall on a continuation of this line. The device used in the case of the intense yellows is not convenient here since a simple function of the colorimetric values was related linearly to the visual grades over the entire range 1 to 21 with deviations no greater than could be expected from sampling (as was also true of the browns and of the yel- lows on adding anything from 0.25 to 0.60 to grades 9, 10 and l l )
.
It has seemed best to use a different line, fitted to Z = 33 to 39 through the means for 226 blacks (mean index 41.28 mean visual grade 20.9).Gs 1.7059131 - 8.2401 (33.4<1<45)
These equations make it possible to transform the indices into mean visual grades. These are shown for the various colors in Tables 6 to 10 (visual grades from I ) .
The previous averages of the visual grades for the c genotypes (WRIGHT 1949) are given in the next column in these tables for comparison. I n the case of intense yellow ( C F F ) the mean is given as 10.9 instead of 10.6 because of the addition of 0.60 instead of 0.25 to grades 9, 10 and 11.
Equations were derived in a previous paper (WRIGHT and BRADDOCK 1949) for transforming visual grades into quantities of pigment ( M ) as indicated by colorimetry. That for yellow has been modified for reasons discussed above.
The equations for amount of melanin ( M ’ ) (including melanoids found i n white hair) are as follows.
Sepia Zoglo(M;
+
6) = .05644 GS+
.8768 ( M i = 1.53 is white)Brown ( M i = 1.024 is white)
Yellow ( M i = 13.12 is white)
loglo(Msr
+
6) = .05579 Ge,+
3466 Zoglo(Mi+ 20) = .09354 Gy+
1.4490Sepia M S loglo-' [.025955 I
+
.8768] - 7.5300 0<1<33.4iW8 = loglo-' [.03984 I
+
.4117] - 7.5300 33.4<1Brown MBr = loglo-' [.024686 I
+
.8466] - 7.02425 Yellow M y = Z0gl0-l [.040285 I+
1.52011 - 33.12All of these quantities of melanin are in terms of the arbitrary standards of the 1949 paper (M,; for blacks of grade 21, 112.9; f o r yellows of grade 11, 285.1). They can, however. readily be reduced to percentages of the average amounts of any desired genotype. Such percentages are presented, relative to yellows of genotype eeCFF in the last two columns of Table 6, to blacks ( E B C P ) in Tables 7 and 9, and to browns (EbbCP) in Tables 8 and 10. Those in the next to the last column are deduced from the average reflectionmeter indices while those in the last column are those given in the 1949 paper modified slightly in the case of yellow by the use of the new transformation equation.
On comparing the visual grades, estimated from the reflectionmeter indices with the 1949 averages, it is apparent that the latter is usually less than the former for 4 plus factors both with respect to yellow and sepia. The main reason is undoubtedly the high frequency which dm turned out to have in the general stock. Dilutes with one or even two doses of d m or occasionally si had evidently been considered as typical and only those with three doses of these factors (prin- cipally +sidmdm) had attracted much attention as outside the normal range of variability.
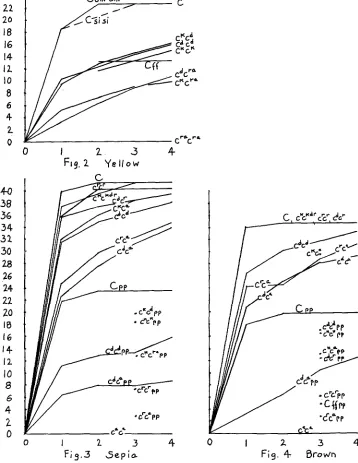
Yellow
Figure 2 and Table 6 show the indices and Figure 5 the estimated relative quantities of pigment for yellows with various c genotypes and numbers of plus modifiers. The former indicates best the differences to the eye.
There is no great difference between the effects of ck and ca. There is a sugges- tion on comparing ckcr" with cdcla that ch produces slightly less pigment in the presence of four modifiers but that there is somewhat less reduction in the pres- ence of only one. The assignment of modifiers was, however, based on less ade- quate information than in the case of cd, a consideration which might tend to confound the means for the different numbers of plus modifiers.
The percentage of reduction by si or d m is much greater in cdcTa than in CV
but the absolute reduction is somewhat greater in the latter. As already noted there is no evidence that ++dmdm causes any reduction at all in the presence of C. On the other hand sisi++ causes about as much absolute reduction with C
as with cdcd. The percentage reduction is much less, but this refers to the middle of the back in a spot where there was no overt silvering. On taking into account the decrease of pigment from silvering (less in cdcd than in C, least in cdcTa) it is possible that sisi may produce about the same percentage reduction in all cases. In class 1 (based largely on + s i d m d n ) the percentage reduction from class 4 is clearly much the greatest in and least in C. There seems no doubt that dm
at least interacts specifically with the lower c alleles.
INTENSITY O F GENOTYPES 1021
22
26
18
16 14 12 10
8 6
4 2 0
4 4
38
3634
32
3028
26 24 22
20
10 16
14
12
10 9
6
4 2
0
C
crecr,
0 I
2
3
4
Fig.2 Y e I I o w
t
v
0 I 2 3 4
Fig.
4-
B r o ~ n FIGURES 2-4.-Mean indices for various genotypes of yellow (Figuree),
sepia (Figure 3)much pigment as
69
( 3 or 4 plus modifiers) while cdcra produces less than 48 percent as much in comparison with Ad.The amount of residual variability with lower c alleles is small (standard de- viation about 0.9 on the index scale on which the range from one to four PIUS modifiers is 6 or 7). There was considerably more residual variability among the intense yellows (about 1.3) during the period in which the readings were taken and much more earlier when different inbred strains with the genotype
CCFF ranged from visual grades 10 to 13. The very intense reds of grade 13 which had a somewhat brownish hue at birth are probably the same as what
IBSEN (1932) has referred to as cherry reds. Crosses between strains at opposite extremes gave intermediates. There was no clear segregation in F, indicating multifactorial heredity.
Returning to Table 6, the rather scanty information from reflectionmeter indices on yellows that were not F F is summarized in the lower rows. Genes si
and d m were not present as far as known. The principal points brought out are the incomplete dominance of F over f, and lack of appreciable difference between
ckck and cdcd when subject to slight dilution by Ff or extreme dilution by f f .
Dark sepia
Table 7 and Figures 2 and 6 give the principal results for the dark sepias. We note the absence of appreciable diminution of pigment in blacks ( C ) by si and
d m except for a slight effect in the extreme combinations
+
sidmdm and sisi-+
d m , and of course the silvering by sisi which is not here considered. With lower c genotypes, there is, as with the yellows, a closer approach to uniform absolute amounts of diminution by si, d m combinations than to uniform per- centage effects, If allowance were made for the diminution of pigment by overt silvering, there would be a closer approach to constant percentage diminution by si than by d m which as in the case of the yellows must be supposed to interact specifically with the lower c alleles (except in the combination Csisidmdm).
The dominance relations are again of interest.
C
seems to be completely dominant over all of the lower alleles. In the presence of three or four plus modifiers, ckcn produces about 80 percent as much pigment as c k 9 , c a p produces some 64 percent as much as cdcd but c T 6 , which produces slightly more pigment than cdF, produces only 51 percent as much as crc7. The dominance relations ofcr are more in line with its position among the alleles in other respects than in
its effectiveness in producing sepia pigment. A similar statement coiild be made of ch with respect to yellow.
Dark brown
Table 8 gives the reflectionmeter indices, estimates of visual grade and esti- mate of pigment for dark brown. The entries for C are here restricted to indi- viduals which do not show the “dingy” type of dilution. The indices are shown in Figure 4 and relative quantities in Figure 7.
100
80
60
40
20
0
100
SO
6 0
40
20
0
INTENSITY O F GENOTYPES 1023
0 I
2
3 4Fig. 5 Yellow
I
c
r P,
c c,
CdC'0 I 2 3
4
fig. 7 B r o w n
estimates were made for cdcd and for cdca and cTca combined, these being closely similar. There has been no clear evidence for effects of Si& or Dm,dm on in- tensity in C brown, although this is subject to silvering in the presence of sisi
to about the same extent as in C black (WRIGHT 1959a). These loci affect the intensity of lower c combinations (cdcd, cdcQ, c7ca) in much the same way in browns as in sepias.
The index for C brown indicates only about half as much eumelanin as in C
black. The lower c genotypes, however, have much more than half as much as the corresponding sepias. As suggested previously (WRIGHT 1942) this can be accounted for by the hypothesis that there is a much more restricted limiting factor for possible amount of brown than of black so that the lower c alleles approach closer to the ceiling value in the former (e.g., bbcdca = 84 percent bbC
while Bcdcd = 67 percent B C ) . Not surprisingly, there is also a closer approach of Cdc" to cdcd as the ceiling is approached (e.g., bbcdca = 79 percent b b c V while
Bcdca = 64 percent of B&cd). These figures refer to the average estimates for three or four plus modifiers (SiSiDmDm)
.
The same conclusion is indicated by comparisons with one o r two plus factors in spite of some irregularities among the rather inadequately based figures for the browns. Thus with only one plus factor, bb&cd = 56 percent bbC as opposed to B c V = 40 percent BC and bbcdca == 69 percent bbcdcd while Bcdca = 52 percent B c V . There is virtually no indica- tion of any damping in the last case in which one dose of cd produces just about half as much pigment as two doses.The residual variability of the indices f o r brown genotypes (standard devia- tion 1.57 for brown genotypes excluding C and c k ) is somewhat greater than for sepia genotypes (1.39 also excluding C and c"). Nevertheless with a range of some 7 or 8 units between the average with one dose and that with four doses of the second order modifiers Si and D m , their residual variability is decidedly of :third order and probably hardly capable of analysis. We will not consider here the dingy browns in which the combination of genes C, P, and F is beyond the optimum and intensity reduced in a very variable fashion.
Pale sepia
Table 9 and Figures 3 and 6 present the results from both methods of estima- tion. The effect of si and dm in pale sepias with cdcd and cdca are roughly similar on a percentage basis to those in dark sepias. The fact that the effects are not much greater and that no effects on intensity have been detected in C pale sepia indicates that the dilution effects are specifically related to the c alleles rather than to amount of pigment. The markedly higher intensity of most of the geno- types in the present data as compared with the 1949 estimates is undoubtedly due in the main to selection for intensity modifiers independent of Si, si; D m , d m .
Pale brown
I N T E N S I T Y O F G E N O T Y P E S 1025 estimates of most genotypes are again much higher than in 1949, undoubtedly for the same reason as with the psle sepias.
Pale brownish cream
No data are available on possible effects of
Si,
si; D m , d m on ECppff. Com- parison of a few carrying B and segregating groups of which three fourths or one half are expected to carry B , with a considerable number known from ancestry to be bb, gives no indication of any difference. Notes indicate that most animals in all of those categories showed appreciable deviation from the pure pale cream that had been attributed to this genotype when first described.S U M M A R Y
A large proportion of the combinations of genes E , e; B, b; C, ck, cd, c", Ca; P,
p , F , f, Si, si and D m , d m of the guinea pig have been studied with respect to the intensity of pigmentation indicated by reflectionmeter readings. A simple index has been obtained that gives results that vary linearly or nearly so with grades based on skin samples, chosen so that each grade is barely distinguishable from the preceding. These indices and visual grades are converted into estimates of relative quantities of each kind of pigment (yellow, sepia, brown) by means of previously established relations of visual grades to colorimetric determinations. The results are presented in tables.
The results for combinations of the first five of the above loci agree reasonably well with the previous results based on the visual grades. Combinations of
Si,
si; D m , d m have roughly additive effects on intensity of lower c combinations, according to the number of plus factors, except that sisidmdm is pure white on the back where the grades were taken. Replacement of Si by si, however, brings about silvering as well as dilution. Its total effect seems to be approximately constant on a percentage basis. Replacement of D m by dm on the other hand has little or no effect in the presence of C except in combination with si. It has maxi- mum effect in association with lower c combinations.L I T E R A T U R E C I T E D
BLAIR, W. F., 1947
HEIDENTHAL, G., 1940
2 5 : 197-214. IBSEN, H. L., 1932 RUSSELL, E. S., 1939
24: 332-355. WOLFF, G. L., 1955
WRIGHT, S., 194.2
An analysis of certain genetic variations i n pellage color of the Chihuahua
A colorimetric study of genic effect on guinea pig coat color. Genetics
Modifying factors in guinea pigs. Proc. 6th Intern. Congr. Genet. 2 : 97-101. A quantitative study of genic effects on guinea pig coat colors. Genetics
The effects of environmental temperature on coat color in diverse geno-
The physiological genetics of coat color of the guinea pig. Biol. Symposia
On the genetics of several types of silvering in the guinea pig. Genetics 32: 115-141. deer mouse. Univ. Mich. Contr. Lab. Vert. Biol. 35: 1-18.
types of the guinea pig. Genetics 40: 90-106.
1949
1959a
1959b
Estimates of the amounts of melanin in the hair of diverse genotypes of the guinea pig
On the genetics of silvering in the guinea pig with special reference to interaction and
Silvering (si) and diminution ( d m ) of coat color of the guinea pig and male sterility
Colorimetric determination of the amounts of melanin from transformation of empirical grades. Genetics 34: 245-271.
linkage. Genetics 44: 387405.
of the white o r near-white combination of these. Genetics 44: 563-590. WRIGHT. S., and Z. I. BRADDOCK, 1949