STUDIES I N QUANTITATIVE INHERITANCE. XIII. INTERRELATIONS BETWEEN GENETIC BEHAVIOR AND DEVELOPMENT IN THE
CELLULAR CONSTITUTION OF T H E DROSOPHILA WING
FORBES W. ROBERTSON
A.R.C. Unit of Animal Genetics, Institute of Animal Genetics, Edinburgh
First received J a n u a r y 5, 1959
H E preceding paper of this series (ROBERTSON 1959) and the present one Tdeal with different parts of a single study of the relations between cell size and number in the wing of Drosophila melanogaster. The reasons for examining this problem together with details of procedure and statistical analysis are given in the earlier paper but a brief resunik will help the reader to appreciate what follows.
Wing size is highly correlated with body size. Since it is possible to escmate cell size and number in the wing, we can follow changes i n the cellular constitu- tion of the wing which accompany the alteration of body size for either genetic or environmental reasons. The wing is made up of a double layer of cells, each of which carries a tiny bristle so that the bristle density i n a given area on one surface of the wing provides an estimate of cell area. The evidence presented in the earlier paper showed that variation in the pattern of bristle density in differ- ent regions of the wing is relatively unimportant in the material studied in these experiments and that the bristle density in a central region of the wing provides a n adequate measure of general cell area or cell size. The records of wing and cell area are expressed in natural logarithms of squared hundredths of a millimeter. Cell number can be estimated from the difference between log wing and log cell area.
The effects of environmental variation were studied by growing larvae at different temperatures and also on chemically defined, aseptic media, deficient in some essential nutrient, which led to smaller wing and body size. Lower temper- ature during growth results in larger body size; the observed differences in wing size are expressed almost entirely by changes in cell size and the average esti- mated cell number is about the same at high and low temperatures, which are responsible for big differences in wing area. On the other hand, when the larval diet is suboptimal, provided it is not too deficient, there is a distinct tendency for cell size to remain constant and cell number to decline. But with more extreme conditions, cell size declines as well. Thus equivalent changes i n total wing and body size, resulting from different kinds of environmental change are associated with different relations between cell size and number.
1114 F. W. ROBERTSON
corresponding estimates based on genetically uniform crosses between inbred lines. Most of the variance is genetic and it was inferred that genetic variation of wing size is associated primarily with variation in cell number, but there is also an appreciable genetic correlation with cell size as well; the status of this correlation was left for consideration in the present paper.
Interpretation of the relations between cell size and number and variation of wing size is complicated by the fact that genetically different individuals of identi- cal wing and body size, may differ in cell size and number in the wing. Genetic variation in such inverse relations between cell size and number was studied by selecting for large and small cell size in three different wild populations. It was pcssible to shift the cell size and number relation more easily in favor of larger cells and fewer of them than in the opposite direction. Whereas continued selec- tion for larger cells failed to effect a permanent increase in body size, selection for small cells lead to a decline. Furthermore, in a cross between a small strain selected for small cells and the unselected stock, the genetic differences in body size behaved as entirely recessive or hypostatic. Such behavior contrasts with the more nearly additive behavior found when strains selected for small body size are backcrossed to the unselected population. It was suggested that the selection for small body size, and selection for small cell size involve different kinds of developmental change which is reflected i n genetic behavior. It was suggested that selection for small cell size provides a direct way of breaking up epistatic gene combinations which normally ensure the stability of body size in a population.
Evidence of this kind provides a valuable link between the methods and con- cepts of population genetics and developmental genetics, extends the depth of analysis and brings various dynamic aspects of growth within reach of genetic study.
The present paper continues the analysis and is concerned especially with the changes in cell size and number which are associated with different kinds of genetic change in wing size.
ANALYSIS O F DATA
Selection for body size
I t has been noted that the estimates of total genetic variance and covariance described in the preceding paper suggested that most of the genetic variation of wing size is due to variation of cell number. It is now necessary to test this infer- ence more directly. To produce differences for comparison, mass selection for long and short thorax length was carried out for three generations i n three differ- ent populations-Pobla de Lillet, Renfrew and Crianlarich, in which two similar selection experiments were carried out at different times.
WING CELL S I Z E A N D NUMBER 1115 for five generations. It is convenient to consider them separately, so we shall deal first with the lines selected for three generations. The general procedure in such selection experiments, in which 20 pairs of parents are selected each generation from 100 pairs, together with the effects of long term selection, have been de- scribed elsewhere (ROBERTSON 1955).
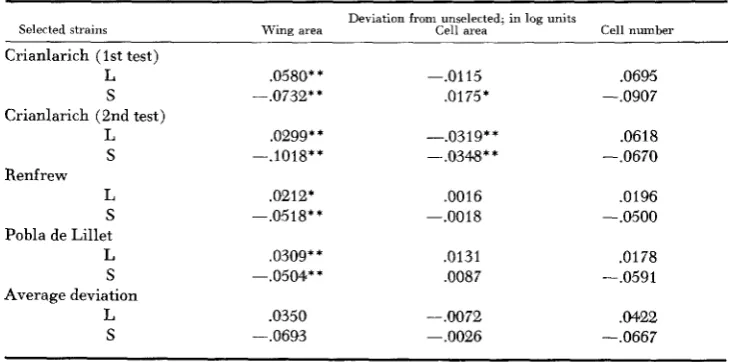
Strains selected for three generations: As expected, selection was immediately effective in both directions and, at the time of comparison, the wing size of the selected strains differed appreciably from the control levels (Table 1 )
.
There wasTABLE 1
Effects of three generations of selection for large and small body size
Deliation from unselected; in log units
Selected strains Wing area Cell area Cell number
Crianlarich (1st test)
L .0580* * -.0115 .0695
S -.0732* * .0175* - ,09087
Crianlarich (2nd test)
L .0299* * -.0319* * .0618
S -.1018** --.0344** -.0670
Renfrew
L .a2121 ,0016 ,0196
S -.0518** -.a018 --.0500
Pobla de Lillet
L .0309** .0131 .0178
S -.0504** ,0087 -.0591
L .0350 -.0072 .M22
Average deviation
S -.0693 -.0026 -.0667
* Indicates the difference significant at .05 level of probability,
* * Indicates the difference significant at .01 level of probability.
a distinct tendency for selection downward to be more effective than selection upward-a familiar experience from the earlier selection experiments. Although wing and hence general body size changed with selection, cell size failed to show any consistent tendency to change in the same direction as the wing size. In the first Crianlarich test, cell size was significantly greater in the small strain; i n the second test both selected strains had smaller cells while in the Renfrew and Pobla de Lillet series the changes in cell size were trivial, Averaging wing and cell size deviations f o r the strains selected in the same direction, it appears that a difference of about ten percent in wing area leaves cell size unchanged. Since there is plenty of variation which can alter the cell size and number relations, independently of
1116 F. W. R O B E R T . S O N
there is no evidence of this in the comparisons between selected strains. It may be inferred, therefore, that this correlation is due to nonadditive effects. Naturally, effective selection depends primarily on additive effects and this suggests that the variation of wing size in a wild population is influenced by qualitatively different kinds of developmental variation with characteristically different genetic prop- erties.
The evidence from these experiments agrees with the observation of ZARAPKIN
( 1934) who found that selection for large and small wing size in
D.
funebris was accompanied by change in cell number. But it does not agree with the results of two-way selection for wing length, reported in the first number of this series(ROBERTSON and REEVE 1952)
,
which resulted in correlated changes in cell size.However, selection for small wing size lead to a disproportionate reduction of that organ, compared with thorax length, due especially to sex-linked effects. It is fairly certain now that the observed differences in cell size were associated with this disproportionate change of wing size, whereas, in the present experiments, selection has been for changes in general body size.
Crosses between strains: The selected and unselected strains were intercrossed after selection in the Pobla de Lillet and the second Crianlarich series and reared along with the parent strains; generally ten females from each of five cultures were scored. Previous work (ROBERTSON and REEVE 1954a) has shown that crosses between such selected strains, while roughly intermediate in size, usually depart from the midparent value in the direction of larger size and so it is of some interest to discover how this departure is related to cell size and number. Table 2 shows the differences in wing size in log units between the parent populations, together with the deviations from the midparent value for wing cell size and cell number. There is evidently a strong correlation between wing and cell area in the degree of departure from intermediacy, Averaging the values for the six available crosses
TABLE 2
The departure from intermediacy in wing and cell size and cell number in crosses between strains: in log units
Ilfferenccr brlwwn parent strains
Wing area
Fl-midparen t Wing area (.ell area
Crianlarich
U X L 0.029
u x s
0.103L X S 0.131
U X L 0.055
u x s
0.054L X S 0.109
Pobla de Lillet
Average
0.010 0.006
0.024 0.024
0.034 0.033
0.009 0.016
0.022 0.028
0.029 0.019
0.021 0.021
Cell number
0.004 0.000 0.001
-.007
-.006 .010 0.000
WING CELL SIZE A N D NUMBER 1117 gives the same figure of 0.021 for both dimensions. Hence the departure from intermediacy in wing size is characterized by the relatively larger cell size of the crosses. Thus cell number behaves in additive fashion-on a log scale-whereas cell area apparently shows heterosis? which varies according to the type of cross and which is sufficient to account for the departure of wing area from the mid- parent value.
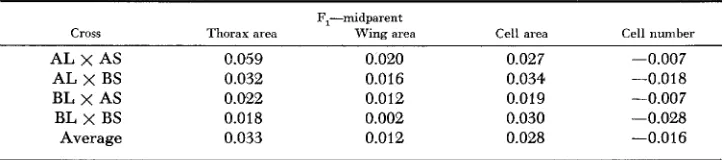
The Pacific strains: After five generations of selection in either direction? the four possible crosses between a large and small strain were compared with the parent strains and the unselected stocks. Thorax size was also recorded in these tests, and has been expressed in terms of log squared length, to provide a more suitable scale for comparison with differences in wing area. Table 4 shows the differences between the series in terms of average deviations from the unselected stock. The main points of interest are as follows:
(i) Although selection has led to a striking difference in thorax and hence general body size, the changes in wing size are proportionately less. This is evident in the end column of Table 3 which shows the wing/thorax ratio for the different series (log wing area-log squared thorax length) and is brought out clearly in Figure 1 in which the regression of log wing area on log squared thorax length is fitted to the mean values of the different groups. Although there is virtually complete ge-
TABLE 3
Selection for body size in Pacific population: in log units
Deviations from unselected
Squared Wing-thorax
Strains thorax length Wing area Cell area Cell number area
A 0.032 0.016 -0.009 0.027 0.489
B 0.088 0.027 0.015 0.012 0.444
Large
A -0.072 -0.018 0.007 -0.025 0.559
B -0.060 -0.007 -0.002 -0.005 0.558
average 9.390+-.010 9.895-tO.004 0.557-t-.010 9.338f.010 0.505 Small
Unselected
TABLE 4
Crosses between selected Pacific strains (log units)
Fi-midparent
Cross Thorax area Wing area Cell area Cell number
AL x AS C.059 0.020 0.027 -0.007
AL x BS 0.032 0.016 0.034 -0.018
BL x AS 0.022 0.012 0.019 -0.007
BL x BS 0.018 0.002 0.030 -0.028
Average 0.033 0.012 0.028 -0.016
1118 F. W. ROBERTSOlY
WING/THORAX RELATION IN PACIFIC STRAINS
9.94
X - CROSSES
...I
I
9 . 3 0 9.32 9 . 3 4 9.36 9.38 9 . 4 0 9.42 9.44 9.46 9
LOG SQUARED THORAX LENGTH
FIGURE 1.-The allometric relation between wing and thorax size in Pacific strains.
netic correlation between the two dimensions, a unit change on the thorax scale is accompanied by only 0.3 unit change in wing size. This particular allometric relation is unexpected since previous experience of selection, the comparison of wild populations (in the preceding paper) and the effects of the alteration of body size by nutritional means would lead us to expect a regression line fairly close to unity.
(ii) The changes in wing size produced by selection are correlated with changes in cell number. Thus the average deviation from unselected for cell size works out at 0.003 and 0,002 log units for the pair of large and small strains respectively, and so the evidence from these selection experiments falls into line with the data from the other tests described in Table 1.
(iii) The crosses between the large and small strains introduce a new feature. All the crosses exceed the unselected in body size and the wing/thorax ratio conforms to the same allometric relationship as the parent and control strains. Thus, whereas an increase beyond the normal level of body size by selection leaves average cell size unchanged, a comparable increase, when encountered in a cross between strains, is associated with an increase in cell size. Judged by the corresponding deviations from unselected, thorax and cell area behave very similarly, and the average deviation works at about the same value of 0.03 log units for both With such an increase in cell area, the allometric relationship can only be preserved with a proportional reduction of cell number, as is indeed the case.
WING CELL SIZE A N D NUMBER 1119 area is associated with a proportionately greater increase in cell area and, of course, an inverse change in cell number unlike the crosses considered in Table 3 ,
where log cell number was intermediate. It seems likely that the latter situation is typical of crosses between strains with the usual allometric relationship be- tween wing and thorax. With this qualification in mind the association between deviation from intermediacy and relative increase in cell size stands out as the most striking property of crosses between strains.
CELL SIZE AND NUMBER IN INBRED LINES
CELL-. O-CELL
NO. SIZE
0 . 0
0
0 0 0 .
0
0
0
0
0
0 0
0 0
t I
0 9 8 0 9 . 9 0
WING AREA LOG UNITS
1.70
8.60
50
FIGURE 2.-Cell size and number in inbred lines derived from unselected wild populations.
The comparison of inbred lines
1120 F. W. ROBERTSON
Crcsses between inbred lines
Another situation has been examined by crossing inbred lines, derived either from unselected stocks or strains selected f o r large or small body sizes; aniy lines derived from the same foundation population were intercrossed. The parent lines were all cultured at the same time and eight females were measured from each of five replicated cultures. The symbols I, R, E and C refer to the origin of the lines from the original foundation population: Ischia. Renfrew, Edinburgh and Crianlarich; the subscripts L and S or a numeral refer to their deviation from selected large or small strains or the unselected populations.
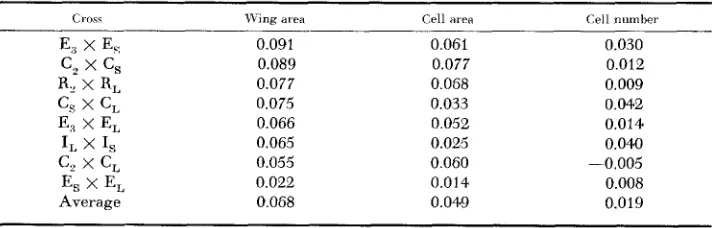
The deviations from the midparent value are listed in order of diminishing magnitude in Table
5.
On the average, changes in cell a r m contribute more to the observed heterosis than change of cell number, since the mean deviation works out at 0.049 units for cell area compared with 0.019 for cell number. Also the regression of wing area deviation on cell area deviation works out at 0.71 2 0.29 compared with 0.49 2 0.49 for the regression on cell number deviation. Inseveral instances, especially in crosses between the unselected lines and lines de- rived from large strains, the F, deviation is almost entirely reflected in the dis- proportionate increase in cell size.
This relation between heterosis and cell size recalls the behavior of the crosses between the strains which have been considered earlier. There is a new feature in that log cell number also tends to exceed the intermediate value. There is no instance of a negative deviation, as in the Pacific strain crosses, and this supports the hypothesis that such a deviation is directly related to the peculiar allometric relationship between wing and thorax in these strains. The tendency for cell number to show a positive deviation may be especially characteristic of crosses between highly inbred lines. In the crosses between the Crianlarich and Pobla de Lillet strains, in which average log cell number was intermediate, the parents were highly heterozygous and it may be assumed that three generations of mass selection are unlikely to produce much disturbance in the original genetic equi- librium.
TABLE 5
Deviation from midparent ualue in crosses between selected and unselected inbred lines; in log units
Crosc \\-iing ai-ea Cell iirea Cell number
0.091 0.089
0.077 0.075
0.066
0.065 0.055
0.022
0.068
0.061
0.077
0.068 0.033 0.052 0.025
0.060 -
0.014 0.049
0.030 0.012 0.009 0.042 0.014 0.041)
0.005 0.008
WING CELL SIZE A N D NUMBER 1121
Aberrant genotypes
It is clear now that genetic differences in wing size arrived at in different ways, are associated with characteristic changes in cell and/or number. To throw fur- ther light on these interrelations between development and genetic behavior genotypes have been created, which may be regarded as aberrant in the sense that they represent arrays of genes unlikely ever to be encountered in wild popu- lations. In the first of the two series of experiments a long inbred line (E,) de- rived from the Edinburgh population had the third pair of chromosomes replaced by different homozygous or heterozygous pairs of chromosomes drawn from the Renfrew population; four such homozygous and two heterozygous combinations are available for comparison with the line E,; eight females from each of five cultures for each genotype were scored as usual. These genotypes were prepared by
DR.
E. C. R. REEVE for other purposes, and I wish to thank him for making them available.The average values of wing and cell size for the different genotypes are plotted in Figure 3. Two of the homozygous substitutions did not have much effect al- though wing size is a little smaller; the other two reduced size below the E, level by respectively six and 12 percent. The two heterozygous substitutions increased size; the differences between E, and either of these types is highly significant statistically. The line of proportional increase is drawn through the point for E,
and this demonstrates very clearly that the variation in wing area is associated
THE SUBSTITUTION OF THIRD CHROMOSOMES IN UNRELATED
HOMOZYGOUS BACUGROUND.
9'
N
Q
o r )5
4
w
4
(3
s
(3 a
z 9
s
9
/
0
0 - E 3
0
-
HOMOZYGOUSx
-
HETEROZYGOUSm
LOG CELL AREA ')m,&!(
1122 F. W-. R O B E R T S O N
with parallel changes in cell area, only one of the seven points departs much from this line. In addition it is interesting that different homozygous third chromo- somes differ so much in effect when substituted in the unrelated genetic back- ground.
I n the last series of tests atypical genotypes have been produced by making the third chromosome pair homozygous in a genetic background which could be regarded as representative of a gentically variable wild population. Using the Curly ( C y ) inversion for I1 and Moir6 (Me') and Moirk Stubble (Me' Sb) for 111,
Cy Me' and also C y Me' Sb males were backcrossed for several generations into the wild population, then the C y marker was discarded and the backcrossing continued, using only Me' or Me' Sb males. A number of such Me' Sb males were crossed individually to groups of 8-10 virgin
1114
females drawn from the back- cross stock; these females were divided into two equal groups labelled a and b.Me' males and virgin females were collected from the progeny of each male and these carried the same wild third chromosome originally present in the Me' Sb
parent. The Mk males of group a were crossed to the Me' females of group b and
vice versa, to diminish the risk of inbreeding in the genetic background; and, as far as possible, equal numbers of eggs from the two groups were set up together in replicated cultures. The resulting wild type progeny were scored and these provide estimates of the effects of making I11 homozygous but keeping the rest of the genotype about as variable as is normally the case in flies of the wild popu- lation. Such experiments have been carried out on both the Gabarros and Pacific populations. I n the former, there was little or no evidence of a tendency for size to decline when the third pair of chromosomes was made homozygous, and so the data are not of much interest in the present context. In the Pacific population, however, a decline in size was more evident although not especially striking. The comparatively small average effect of making the longest pair of chromosomes homozygous, in a n otherwise highly heterozygous background recalls the results of earlier experiments in which a variety of homozygous and heterozygous com- binations were compared by interchanging chromosomes between lines (ROBERT-
SON and REEVE 1954b), and emphasises the extent to which heterozygous can be
replaced by homozygous combinations before body size is affected. A number of lethals were encountered, especially in the Pacific tests.
WING CELL SIZE A N D NUMBER 1123
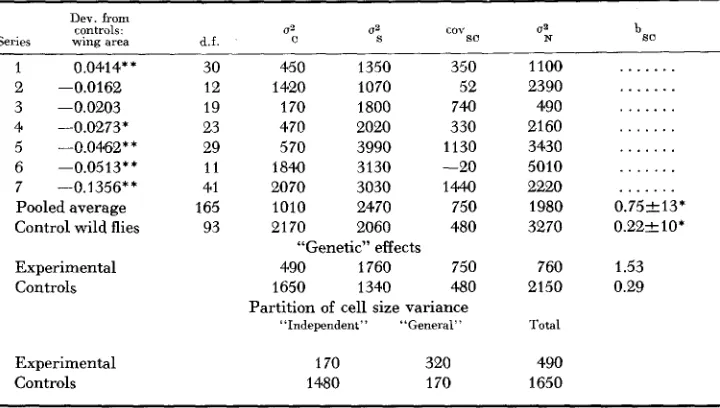
TABLE 6
The effects of making the third pair of chromosomes homozygous in the Pacific population
C Qa cov so
Dev. from controls.
Series wing area d.f.
1 0.0414* * 2 -0.0162 3 -0.0203 4 -0.0273* 5 --0.0462** 6 -0.0513** 7 -0.1356** Pooled average Control wild flies
Experimental Controls Experimental Controls 30 12 19 23 29 11 41 165 93
450 1350 350
1420 1070 52
170 1800 740
470 2020 330
570 3990 1130
1840 3130 -20
2070 3030 1444)
I010 2470 750
2170 2060 480
490 1760 750
1650 1340 480
“Genetic” effects
Partition of cell size variance “Independent” “General”
170 320
1480 170
1100 2390 490 21 60 3430 5010 2220 1980 3270 760 2150 Total 490 1650 . . .
. .
. ..
..
. ..
. . . . . .. .
.. .
. ..
. .. .
. . . ..
. . 0.752 13* 0.22210’ 1.53 0.29C, S and N refer to cell and wing area 2nd cell number. Variance components are multiplied by 106 and rounded off * Indicates the difference significant at 0.05 level of probability,
* * Indicates the difference significant at 0.01 level of probability.
t o nearest 10.
able reduction in variance is expected for additive genetic effects when I11 is made homozygous. There is clear evidence of this in the variance estimates for both cell area and cell number which are reduced from respectively 2170 and 3270 units to respectively 1010 and 1980 units. But the variance of wing size is not reduced and is actually somewhat higher in the experimental than the con- trol series. There is also a distinct suggestion that as average wing size declines so does its variance increase.
1124 F. W. ROBERTSON
wing size declines.Thus the evidence from this test falls nicely into line with the other data.
The analysis can be taken a little further by estimating purely genetic effects from the differences between components of total variance with corresponding estimates of environmental variance. For the latter we can use the estimates de- rived from the within-culture variance of the genetically uniform crosses be- tween inbred lines, quoted in the preceding paper (ROBERTSON 1959). Although these were considered valid for wild flies, they probably underestimate the effects of environmental variation in the present instance, since the general sensitivity to environmental variation is likely to be higher than average in the subpopula- tions. However, such differences are probably secondary to the contribution of genetic variation to the total phenotypic variance. After subtracting the estimated environmental variance, the estimates of genetic variation of cell size work out at 490 and 1650 units for experimental and control series respectively, while for wing size the corresponding estimates are 1760 and 1340. The genetic regression of wing on cell size is estimated as 1.53 and 0.29 for the two series. These estimates can be used to partition the total genetic variation of cell size into what may be termed, purely for convenience, “general” effects which are responsible for a correlation between wing and cell size and “independent” effects i.e., variation in the inverse relations between cell size and number. Too much reliance cannot be placed on the figures arrived at in this way, since they involve a number of assumptions which are probably only partly justified. At least they serve to make a relevant point.
I t appears that the variance of the so-called “independent” effects is drastically reduced by making I11 homozygous, in an otherwise normal genetic background, but the contribution of “general” effects to cell size is increased. Hence the com- position of the variance of cell size in experimental and control series is different -apparently 65 percent of the variance of the former is associated with wing size, compared with a mere ten percent in the latter. Hence, in spite of the out- ward similarity of total genetic variance of wing size in the two series, the nature of this variation differs with respect to the development of the wing. In the wild stock most of the genetic variance of wing size is associated with cell number, while in the experimental series, the predominant association is with cell size and this is clearly related to the increased effects of segregation, which, in turn, is a direct consequence of the atypical gene arrays produced by fixing different third chromosomes.
DISCUSSION
WING CELL SIZE A N D NUMBER 1125
cally interrelated and subordinated to hormonally regulated processes which con- trol final body mass, change due apparently to only one or other type of change should be regarded as a property of special conditions, both genetic and environ- mental, rather than as evidence for genetic independence of cell size or cell num- ber. It remains for future work to specify these conditions more precisely, but there is now sufficient evidence to set down some of the rules of behavior of cell size and number in the wing of Drosophila melanogaster at 25"C, and point to relations between the genetic behavior of differences in wing and body size and the cellular make-up of the wing.
The comparisons between a series of wild populations, described in the earlier paper, showed that the average cell size in the wing is similar in different popula- tions, so that differences in wing size are expressed by differences in cell number. Selection for large and small body size in four of these wild populations showed that striking differences in wing size left average cell size virtually unchanged. Also when larvae are reared on media deficient in some essential nutrient there is a well-marked tendency for smaller body size to be reflected in a reduction of cell number in the wing, unless the conditions are too unfavorable when cell size is reduced as well. Hence a general feature of wild population is the lability of change via cell number, coupled with stability of cell size, in the presence of both nutritional variation and the genetic changes produced by short term selection for large and small body size.
There is nevertheless considerable variation in the observed wing cell size, which has been demonstrated by comparing the variance components derived from wild flies with the corresponding estimates for genetically uniform crosses between inbred lines (ROBERTSON 1959). Such variation presents two aspects. Firstly, genetically different individuals of the same wing size may differ in cell size and number, and selection for large and small cells showed that it was possible to shift the cell size and number quite strikingly without affecting wing size. I t was suggested that such variation in the inverse relations between cell size and number is tangible evidence of genetic differences in growth which are regulated to ensure stability of final body or wing size.
1126 F. W. ROBERTSON
in cell number, but a comparable deviation above the normal size in the crosses was associated with change in cell size. The deviations from intermediacy in the Pacific crosses showed fair agreement between wing cell area and squared thorax length, but cell number declined below the intermediate level. This was attributed to the unusual allometric relationship between wing and thorax size i n these strains, and the relations found in the other crosses were considered more typical. The F, deviation from intermediacy in wing area could be attributed either to:
( a ) a general tendency to dominance of larger over smaller size, or
(b) the creation in the F, of a novel gene combination with the property of increasing wing size in a characteristic way i.e., by increase of cell size.
If, ( a ) is correct it seems a strange coincidence that the dominance deviation should tally so closely with the deviation for cell area, instead of being reflected in cell number as well, especially as the parent strains differ in cell number. Hence the second hypothesis is preferred. If interactions of this sort also occur among the gene arrays of the normal wild population, although on a less dramatic scale, this could account for the nonadditive genetic correlation between wing and cell size.
So far the most effective way of increasing body and cell size together is by crossing strains in which one or both parents have been selected for large or small size. Hence gene combinations can be created which involve developmental changes which differ from those which are associated with selection for larger body size. The level of heterozygosity in crosses between large and small strains will be higher than in the unselected population, but this effect is probably due to the particular changes which have accompanied the selection of the parental strains rather than merely to increased heterozygosity in the F,. The nature of these changes is being studied in further experiments.
It may be inferred from the genetic analysis of body size, described in earlier numbers of this series, that nonadditive effects on body size are minimal in a population in equilibrium and that disturbance of the equilibrium by selection, inbreeding or other means is likely to increase the relative contribution of non- additive effects to the total genetic variance. If such interactions are especially associated with developmental changes which are finally expressed by parallel changes in wing and cell area, factors which disturb the equilibrium or balance
(MATHER 1954) will result in greater apparent determination of wing by cell
size.
WING CELL SIZE A N D NUMBER 1127
effects are associated with a striking increase in the covariance between wing and cell size, and there is a general tendency for the covariance to be higher in the subpopulations with the smaller average wing size.
The highly abnormal genotypes created by substituting diff erent third chromo- somes from one strain in the homozygous background of an unrelated inbred line lead to considerable differences in wing size which were closely associated with parallel changes in cell size. The unselected inbred lines follow the same pattern since the regression of log wing area on log cell areas is close to unity. They make a striking contrast with the comparisons between wild populations in which differences of wing size were correlated with cell number. Inbred lines may be classified as abnormal genotypes, compared with the gene arrays which are present in a n outbreeding species.
The heterosis in crosses between inbred l i n e s w h i c h represents a return to more normal gene arrays-is expressed by relative increase in cell area and to a lesser degree by increase in cell number, suggesting that the decline in wing size due to inbreeding is particularly associated with parallel changes in cell size. Naturally this general trend may be partly obscured by random fixation of genes which influence the inverse relations between cell size and number.
It has been noted above that the genetic correlation between wing and cell size in wild populations is nonadditive in behavior. Selection for large cell size, failed to effect a permanent increase in wing size. whereas selection for small cells lead to a decline in wing size. I n the earlier paper (ROBERTSON 1959) it was shown that an eight percent difference in body size, produced by selection for small cells, behaved as entirely recessive in a backcross to the unselected stock. Previous experience and unpublished data relating to the genetic behavior of comparable differences due to a few generations of selection for small body size-as opposed to small cell size-has indicated more nearly additive behavior in such crosses. Evidence for such recessive or hypostatic behavior has been detected in strains subjected to prolonged selection (ROBERTSON 1954). Since genetic changes which influence the stability of body size in a population-as measured by the level of phenotypic variation due to segregation and recombination-are more likely to be associated with changes in cell size rather than number, the reduction of body size by selecting for smaller cells apparently affords a direct way of destroying the essential conditions which underlie the stability of body size. Possibly gene combinations are favored which lower the capacity for regulation during growth. Short-term selection for smaller body size is much less effective i n this respect. Thus different criteria of selection may lead to an equivalent reduction of body size by different kinds of developmental change which are also distinguished by characteristic differences in genetic behavior.
1 I 2 8 F. W. ROBERTSON
From the analysis presented in earlier papers of this series (ROBERTSON 1954;
ROBERTSON and REEVE 1954b; ROBERTSON 1955), it may be inferred that genetic changes which disturb the equilibrium, especially after prolonged selection are also responsible for greater evidence of epistasis. Body size behaves in some respects like a character which varies about an intermediate optimum and, in others, like one held to an upper level. The latter property derives from the ge- netic conditions which favor stability of body size in a genetically variable popu- lation. Genetic changes which lead to increased effects of segregation and recombination-most commonly, but not inevitably, associated with inbreeding -also tend to reduce body size so that there is an inverse relation between mean and variance. They will also involve a n increase in the covariance between wing and cell size, which provides a sort of empirical index of the loss of balance or coadaptation, to use different terminologies. In such situations, gene combina- tions which tend to repair the damage to the pre-existing capacity for regulation of growth will lead to larger body size, and they will behave as epistatic over gene combinations which are less effective in this respect. Often such interaction looks like simple dominance, but when analysed, generally turns out to depend on the joint action of a number of genes. Thus the stability of body size rests on epistatic interaction which minimizes the effects of segregation on key develop- mental processes.
It follows that a high level of additivity, associated with variation of cell num- ber, is only possible if these key processes are comparatively unaffected by segregation and recombination, otherwise epistatic effects will dominate the genetic variance, as is probably the case in the subpopulations created by making the third chromosome pair homozygous. Hence the property of additive genetic behavior on body size is conditional on the rest of the genotype and there are no grounds for gratuitous speculation about the primary effects of the gene differ- ences in question.
It is clear therefore that the characteristic differences in the cellular make-up of the wing can be reconciled with the conceptual scheme founded on purely genetic methods of analysing the variation of wing and body size. This is en- couraging since it suggests fresh experimental approaches to the study of genetic variation in populations and offers the prospect of establishing further inter- relations between the statistical properties of variation and development.
SUMMARY
1. The relations between cell size and number in the wing of Drosophila nelanogaster have been studied in different genetic situations which involve differences in wing and body size. Estimates of cell size and number are derived from the cell density in the central region of one surface of the wing. Details of procedure have been given in the preceding paper of this series.
WING CELL SIZE A N D NUMBER 1129 3. When selected large and small strains from the same population were inter- crossed or backcrossed to the parent strains, F, wing size exceeded the mid- parent value, especially in crosses between strains selected in the opposite direc- tion. The average departure from intermediacy for log wing and log cell area was the same and log cell number was intermediate. In a series of crosses between large and small strains derived from another population the deviation from intermediacy for log squared thorax length and log cell area showed good agree- ment.
4.
Such heterosis which influences development in this characteristic way is attributed to interaction arising from the novel gene combinations created in theFl of such crosses. Similar interaction, of lower order of magnitude, probably accounts for the low genetic correlation between wing and cell size which is regularly found in wild populations and is consistent with the nonadditive prop- erties inferred from the average constancy of cell area when large and small strains are created by selection.
5. The regression of log wing area on log cell area for a number of inbred lines was close to unity.
6. The heterosis in crosses between inbred lines derived from selected as well as unselected lines was predominantly associated with relative increase in cell area, and to a lesser degree with increase in cell number.
7. Cell size and number relations were studied in an array of genotypes in which homozygous and heterozygous pairs of third chromosomes from a wild population were substituted in the background of an unrelated inbred line. Most of the considerable variation in wing area between different types was expressed by change in cell area.
8. Another genetic situation was examined by making a number of third chromosomes homozygous in the otherwise normal, genetically variable back- ground of a wild population. The expected substantial loss of variation was reflected in a drastic reduction in the variance of cell size and number, which could be partly attributed to lower variance of the inverse relations between cell size and number, which appear to be independent of total wing size. But the variance of wing size was just as great as in the wild flies. Also the covariance between wing and cell size was greatly increased in the experimental series. Thus although the variance of wing size was about the same in control and experi- mental group, in the former variation in cell size was relatively unimportant compared with variation in cell number, whereas in the latter the situation was reversed. The disturbance of the genetic equilibrium due to making I11 homozy- gous evidently increased the effects of segregation and recombination in the genetic background4ue to greater contribution of nonadditive eff ects-and this was associated with increased covariance between wing and cell area.
1130 I?. W. ROBERTSON
genetic behavior. Put briefly, changes which are expressed by alteration of cell number behave more or less additively whereas changes due apparently to alteration of cell size are nonadditive.
10. The data are discussed with reference to the findings described in the preceding paper of this series. It is suggested that the processes which underlie the association between wing and cell size play a key role in maintaining the stability of wing and body size in a genetically variable population. Gene arrays which make for higher stability are epistatic over those which are less effective in this respect. Genetic changes which interfere with such processes increase the covariance between wing and cell size, and, at the same time lead to an increase in the contribution of nonadditive effects to the total variance.
A C K N O W L E D G M E N T S
I wish to thank EVELYN DAVIDSON, ALEXA HUNTER and MARGUERITE WILSON
for valuable technical assistance and MARY THOMPSON for assistance in compu- tation.
L I T E R A T U R E CITED
GOWEN, J. W., 1952
MATHER, K., 1954 The genetical units of continuous variation. Proc. 9th Intern. Congr. Genet. 1: 106-123.
ROBERTSON, F. W., 1954 Studies in quantitative inheritance. V. Chromosome analyses of crosses between selected and unselected lines of different body size i n Drosophila melanogaster.
J. Genet. 52: 494-515.
Selection response and the properties of genetic variation. Cold Spring Harbor Symposia Quant. Biol. 20: 166-177.
Studies in quantitative inheritance. XII. Cell size and number in relation to genetic and environmental variation of body size in Drosophila. Genetics 44 : 869-896.
Studies in quantitative inheritance. I. The effects
of selection of wing and thorax length in Drosophila melanogaster. J. Genet. 50: 416448. Studies in quantitative inheritance. VII. Crosses between strains of different body size in Drosophila melanogaster. Z. Ind. Abst. Vererb. 86: 424438.
Studies in quantitative inheritance. VIII. Further analyses of heterosis in crosses be- tween inbred lines of Drosophila melanogaster. Z. Ind. Abst. Vererb. 86: 439-458.
Analyse der genotypisch und durch Aussenfaktoren bedingten Grossen- unterscheide bei Drosophila funebris. 11. Verhaltnis zwischen Korpergrosse und Zellenzahl. 2. Ind. Abst. Vererb. 68: 172-184.
Hybrid vigor in Drosophila. Heterosis. Ames, Iowa.
1955
1959
ROBERTSON, F. W., and E. C. R. REEVE, 1952
1954a
1954b