Measure of Heat Conduction through Copper
Er. Pal Riya Bipradas Sanchita
1, Prof. Devendra Panchal
2M.E Research Student [Power Electronic Devices], Dept. of ETRX, PIIT, Mumbai University, India 1 Professor, Dept. of ETRX, PIIT, Mumbai University, India 2
ABSTRACT:Wheneverthe term ‘Thermal Conductivity Materials’ occurs, the two main names that strikes our mind are ‘copper’ and secondly the ‘aluminium’ as they are best and highly used metals for thermal management not only for mechanical systems but also for cooling of electronics and electrical systems/devices. This research paper demonstrates the practical test done on Copper strip to test for its thermal conductivity and its validity in terms of mathematical proof.
KEYWORDS: Thermal Conductivity (k), Thermal Resistivity (RTH), Heat Flux (HF), Watts per meter Kelvin
(W/m_K) ,Copper (Cu)
I.INTRODUCTION
Simplest definition of Thermal conductivity is the transfer of heat from one location/point/place to other location/point/place with which it is in contact. It has been already proved that copper conductivity (k) is 400W/m_K. Some experiments also indicate a value of 380 W /m_K. Even though standard value is 400 W /m_K, we obtain such variation in values is only because of the fact that thermal conductivity is not always constant. It varies depending on the density of the material, temperature of the surrounding air (ambient temperature), thickness of the material, moisture content in the surrounding, level of purity of the material and the amount of pressure applied (not needed in this experiment).
Searle’s apparatus setup and Dr.Bock’s apparatus setup are two highly used ‘k of Copper’ measuring technique. But the setup complexity is the main disadvantage. Guarded Hot Plate uses the infinite slab as heat transfer model. Since sample dimensions are finite, guard heaters are used to facilitate uni-directional heat flow. The sample is sandwiched between a heat source and a heat sink. Guarded Hot Plate technique needs steady state condition to arise. Since steady state conditions may take several hours to develop, this method is unsuitable for use. Radial Heat Flow technique is used to test thermal conductivity of materials which are basically in the powdered form. A cylindrical test device employs a central line (or cylindrical) heat source. End effects are assumed negligible due to either the large length to diameter ratio of the test apparatus or the use of end guard heaters. After steady state has been established, the thermal conductivity can be calculated from the heating power. This technique also relies on steady state achievement. Hence it is time consuming technique. This research paper provides simple innovative technique for testing Copper’s thermal conductivity.
II.THERMAL CONDUCTIVITY: SIMPLEST DERIVATION
The below figure 1 illustrates two necessary cases/conditions for heat transfer to take place. The point p1 is at higher temperature T1 than pint p2 which is at lower temperature T2 than T1. The flow of heat (Q) will always happen from higher temperature location to lowest temperature location which is in contact to it.
Thus Q = f1(T1, T2, strip geometry, material) (1) The relation between T1 and T2 is in the form of temperature difference (T1-T2)
Q = f2 (T1-T2, strip geometry, material) (2) Case 1:
If (T1-T2) = 0 (i.e.: when T1 = T2)
Then Q = 0 (means no heat/ thermal transfer rate is being taking place between p1 and p2 points) Case 2 :
If T1>T2
Then Q>0 (means heat transfer rate increases) Q α 𝐴.(𝑇1−𝑇2)
Q = 𝐾.𝐴.(𝑇1−𝑇2)
𝐿
Q = - 𝐾.𝐴.(𝑇2−𝑇1)
𝐿 (unit: watts)
Qx = - K.A
𝑑𝑇
𝑑𝑥 (3)
This is the heat transfer at x direction.
Fig1. Simple diagram of Copper strip heat conductivity
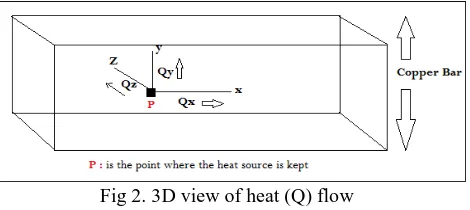
Figure 2 given below shows how heat transfer will happen for a 3D representation. For y and z direction (in 3D representation), Q is given as:
Qy = - K.A
𝑑𝑇
𝑑𝑦 (4)
Qz = - K.A
𝑑𝑇
𝑑𝑧 (5)
Note: for a very thin copper strip, heat conduction in 3D form can be neglected. Heat flow in any 1 direction can be considered for simplicity.
Fig 2. 3D view of heat (Q) flow
Heat Flux (HF) is defined as the ‘rate of flow of heat’ and Critical heat flux is the ‘thermal limit of a phenomenon where a phase change occurs during heating’.
HF = 𝑄
𝐴
III.ROLE OF INDIVIDUAL PARAMETERS ON THERMAL CONDUCTIVITY
Thermal Conductivity (K) = 𝑄.𝐿
𝐴.△𝑇 (6)
1. Temperature difference (△ 𝑇) :
Greater the temperature difference between the two ends of the bar or the strip, greater will be the rate of heat flow.
Q α △ 𝑇 (7)
2. Cross-sectional area (A):
A bar twice as wide conducts twice the amount of heat.
Q α A (8)
3. Separation length/ distance (L) :
Rate of heat transfer is always inversely proportional to the length of the bar. Q α 1
𝐿 (9)
4. Time (t):
Q α t (10)
IV. REQUIREMETS
For the thermal conductivity test conducted, requirements are: i. Copper Strip.
ii. Temperature sensor to measure the temperature surrounding the setup at initial and final time. iii. Heat source (solder iron).
iv. 2 Thermometers to measure T1 at P1 and T2 at P2.
V. BLOCK DIAGRAM OF THE EXPERIMENTAL SETUP
Below Figure 3 is the simple diagrammatic representation of the complete experimental setup. Two thermometers T1 and T2 placed at 2 points P1(20mm) and P2 (50mm) respectively. The complete copper strip taken is of 50mm long. Thickness of the copper strip is 0.2mm. Solder iron is placed at the heat source location as marked in below figure.
Fig 3. Simplest diagram of the experimental setup
VI. REPRESENTATION OF THE EXPERIMENT THROUGH FLOW DIAGRAM AND PICTURES
1. FLOW DIAGRAM :
Fig 4. Flow diagram of the experiment performed.
2. PICTORIAL ILLUSTRATION: 1. It explains about measuring initial room temperature near the setup (fig 5).
Fig 5. Initial Temperature near the setup
Fig 6: Surrounding Temperature rise during the experiment
3. Note down the temperatures T1 and T2 at 20mm and 50mm points respectively. Heat flow happens during the experiment due to the fact that T1 is always at higher temperature than T2 (Fig7).
Fig 7: Figure showing T1(high:510c),T2 (low:420c) as mentioned in the table1
Fig 8.Rate of Cu cooling 5. Note the final room temperature (fig.9)
Fig 9: Surrounding Temp at the end of the experiment
VII. TABLES AND CALCULATIONS
Below table1 represents the measurements of T1 and T2 for every 3 seconds for two sections i.e. for ‘Heating rate of Cu’ and ‘Cooling rate of Cu’
TABLE 1. READINGS TAKEN DURING THE EXPERIMENT
TIME (min) T1 (0C) T2 (0C) Temperature around the setup
Nature of Experiment
3 37 35
Initial: 29 0C To measure thermal rise of
Cu
6 44 37
9 53 40
12 55 42
15 57 43
18 41 39
Final : 33 0C To measure Cooling rate of Cu
21 39 38
24 37 36
CALCULATIONS
We know that
Thermal Conductivity (K) = 𝑄.𝐿
𝐴.△𝑇 , Heat flow rate (HF) = 𝑄
𝐴 and Thermal resistance (RTH) = 𝐿 𝐾.𝐴
Now see the measurements from TABLE1.
Q (heat flux) = (V𝖷I) in watts, for solder iron it is 25W Cross-sectional area A = (0.03 × 0.0002) in m2
△T = (370C – 350C) = (20C+273.15) = 275.15Kelvin
k = 25×0.03
0.03×0.0002×275.15 = 454 W/m_K
RTH = 11.0 0C/W
For further T1 and T2 readings taken, we need to proceed with the same calculation as illustrated above. Below table2 illustrates that as thermal conductivity increases, thermal resistance decreases and vice versa.
TABLE2.THERMALCONDUCTIVITY(K)ANDTHERMALRESISTANCE(RTH)WITHRESPECTTO
TIME
Time (min)
k(W/m_K)
R
TH(
0
C/W)
Nature of
Expt.
3 454 11.0
Thermal rise of Cu
6 446 11.2
9 437 11.4
12 437 11.4
15 435.5 11.7
VIII. GRAPHS
Below graph is the plot of thermal conductivity of Cu on y axis with respect to time on X axis. As time increases, K decreases. After certain time, K will become constant.
Fig 10. Graph showing thermal conductivity of Cu with respect to time (t in minutes)
Fig 11.graph showing thermal resistance offered by Cu with respect to time
IX. CONCLUSION
We got the positive result in ‘Thermal Conductivity Test of Copper’ conducted by us using simple technique and easily available experimental tools. No high cost instrument is used for our experiments but still we have obtained a clear result. Values of RTH from table2 illustrates that at the beginning of this experiment thermal resistance offered by Cu is
less when compared with the last reading taken after 15minutes of initial start up. Plot of Graph 10 and 11 proves that there always exist a inversely proportional relation between thermal conductivity and thermal resistivity.
REFERENCES
[1] D.D.L Chung, ‘Material for thermal conduction’, Composite Materials Research Laboratory, 31 January 2001. [2] Schonholzer, ‘Thermal Design Of Electronic Equipment’, 1980.
BIOGRAPHY
Er. PAL RIYA BIPRADAS SANCHITA received Bachelor Of Engineering in Electronics from PIIT (Pillai Institute Of Information Technology, Engineering, Media Studies & Research) under Mumbai University. Currently pursuing Master of Engineering. Her research areas are Power Electronics and Optical Communication. She is the author of (1) ‘Free Space Light Communication’. (2) ‘Negative Role of Atmosphere On Free Space Light Communication’. (3) ‘Heat in Electronic Circuits and Material Selection Criteria for Cooling Solutions’. She has designed Electronics PCB project for HPST POWER COMPANY in KBR.