Models for calculating monthly average solar radiation
from air temperature in Swaziland
Mgidi D. Dlamini
1, Alakaparampil J. Varkey
1, Simiso K. Mkhonta
11
Department of Physics, University of Swaziland, P/Bag 4, Kwaluseni. M201, Swaziland.
ABSTRACT
Solar radiation is the main energy source for mankind and an accurate data of solar radiation levels for a particular location is vital for the optimum operation of solar energy transducers such as photovoltaic cells and solar thermal collectors. In this work, we show that there is a linear relationship between recorded monthly average temperatures and solar radiation in Swaziland. The correlation can be utilized to develop two mathematical models for the estimation of solar radiation: one from the measured monthly average temperatures and the other based on the square-root of the difference between measured maximum and minimum monthly average temperatures. Both models fit the data well and can be applied to estimate solar radiation in other parts of the region
Keywords: solar energy; solar radiation; climatic data; solar radiation estimation.
1. INTRODUCTION
An accurate knowledge of solar radiation levels for a particular location is a prerequisite in the determination of the performance of various solar energy transducers such as photovoltaic cells and solar thermal collectors. Solar radiation data is also important in disciplines such as building designs and agricultural processes, e.g. evapo-transpiration of plants. However, weather stations will, at times, not have data on solar radiation because the instruments for radiation measurement, such as pyrometers and solarimeters, may not be available. As a result, mathematical models have been developed and calibrated to estimate solar radiation in different parts of the world such as in Brazil (Dos Santos, 2014), Iran (Saffaripour, 2013), India (Bajpai, 2009), Algeria/Spain (Chegaar,1998), China (Li, 2014a; 2014b), Bangladesh (Datta, 2013), Chile (Meza, 2000), USA (Allen, 1997) and Nigeria (Umoh, 2013). These models estimate solar radiation as a function of meteorological parameters such as temperature, atmospheric pressure, relative humidity, the number of sunshine hours, wind speed, cloud cover, and rainfall.
Minimal empirical models require an input of only one meteorological parameter to estimate solar radiation and they include sunshine-hours based models (Angstrom, 1924; Chibani, 1998), air-temperature based models (Hargreaves, 1982; Bristow, 1984; Allen, 1997, Dos Santos, 2014) and cloud cover based models (Kostic, 2017). There are also intermediate models that require the input of two or more inputs of meteorological parameter (Okundamiya, 2016).
In Swaziland, a number of meteorological stations do not measure solar radiation, and the frequently available meteorological records are the daily maximum and minimum temperatures and precipitation. For this reason this paper evaluates two air-temperatures based for predicting monthly solar radiation in four locations within Swaziland. At one location, measured solar radiation values are available to correctly adjust the empirical coefficients of the models and also to compare with results from other parts of the world.
2. CLIMATIC CONDITIONS IN SWAZILAND
Swaziland is a small, landlocked country in Southern Africa and is located between South Africa, on the southern, western and northern side and Mozambique on the eastern side. The map of Swaziland is shown in Fig. 1. On the western side of the country is the Highveld. The Lubombo plateau lies on the eastern side whilst the Middleveld and Lowveld lie between the Highveld and the Lubombo plateau.
The areas of interest in this study, in connection with solar radiation, are Big Bend and Mhlume, both of which lie in the Lowveld, Matsapha (Middleveld) and Mbabane (Highveld). The altitude, latitude and longitude in the various locations are shown in Table 1. The country consists of four seasons, namely, spring (September-October), summer (November-February), autumn (March-May), and winter (June-August).
Table 1. Areas of interest in the solar radiation estimation project.
Location Climatic Region Altitude[m] Latitude[◦S] Longitude[◦E]
Big Bend Lowveld 150 26.82 31.93
Mhlume Lowveld 258 26.00 31.90
Matsapha Middleveld 640 26.50 31.32
Mbabane Highveld 1150 26.30 31.13
There are 11 weather stations in Swaziland, but solar radiation levels are recorded in only one, that is in Mhlume. However, daily maximum and minimum temperatures are routinely measured in all the weather stations. In this work, we use the solar radiation data from Mhlume as a reference to develop and calibrate two mathematical models that define solar radiation as a function of temperature. The data is for the year 2004 to 2014.
Fig. 1: Topographic map of Swaziland.
Fig. 2: Monthly average solar radiation [MJ/m2] and air temperature [◦C] in Mhlume
3. AIR TEMPERATURE BASED MODELS
Given that the most commonly available climatological data in Swaziland is air-temperature, we consider air temperature based models to predict solar radiation at different locations within the country. We first consider that that monthly average solar radiation Hav (MJ/m2) is a linear function of
the monthly average temperature Tav (◦C):
1
1T c
m
Hav av (1)
whereTav (Tmax Tmin)/2, Tmax and Tmin are the average daily maximum and minimum air temperature (◦C) for a period of one month, m1 and c1 are empirical constants. The relationship expressed in Eq.(1) or model 1 is motivated by the observation in Fig. 2, that the measured solar radiation values are proportional to the observed average temperatures, throughout the year. Previous studies have considered similar linear equations to predict solar radiation, for example, the classical Angstrom model (Angstrom, 1924) that assumes that the magnitude of solar radiation is proportional to sunshine (Angstrom, 1924; Meza, 2000; Liu, 2012; and Yakubu, 2012).
Most temperature-based models in the literature (Meza, 2000; Liu, 2012) assume that solar radiation is a function of the difference between daily maximum and minimum air temperature. This is based on the assumption that the difference generally indicates daily cloudiness. Clear skies corresponds to higher solar radiations levels at the earth surface and cloudy skies corresponds to lower solar radiation levels. In this work, we would compare results of Eq. (1), with the classical model of Hargreaves and Samani (1982) that assumes that:
min max 0
2H T T
m
Hav (2)
where H0 extra-terrestrial radiation andm2 is an empirical constant that usually ranges from 0.15 to 0.19, depending whether the location has an arid or a coastal climate (Allen, 1997). The extra-terrestrial solar radiation H0 is a function of latitude can be easily evaluated or obtained in the literature (Duffie, 2013). As the solar radiation passes through the earth’s atmosphere, it is further modified by processes of scattering and absorption due to the presence of cloud and atmospheric particles. Hence, the solar radiation at the earth surface is always less than H0.
3.2 Evaluation of model parameters
We evaluated the empirical constants for Models 1 and 2 using the measured data of monthly average solar radiation and monthly temperature at Mhlume during the period 2004 to 2014. These parameters were calculated using Marquardt-Levenberg algorithm for curve fitting in Gnuplot. The curve-fitting results are also shown graphically in Fig. 3 and the best fits are described by m1 = 1.02 ±
recommended for this model for locations with arid or semi-arid climates (Hargreaves, 1994; Allen 1997).
Fig.3: Evaluation of parameters of the two models. Monthly average solar radiation against monthly average temperatures from 2004 to 2014 in Mhlume (model 1). Monthly average solar radiation against the square-root of the differences between the maximum and minimum monthly
average temperatures from 2004 to 2014 in Mhlume (model 2).
4. RESULTS AND DISCUSSIONS
Performance of the Models against measured data
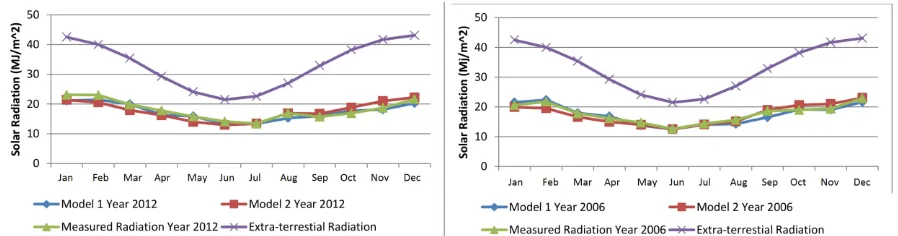
The calculated values parameters were then utilized to estimate solar radiation levels at for each year in the period between 2004 and 2014. The estimated values were then compared to measured values Fig. 4 shows a sample of these results and both models predicted values that are consistent with the observed data. In Fig. 4, a plot of the extra-terrestrial solar radiation on a horizontal surface H0 for Swaziland or regions located
at the latitude 26.00◦S as given in the literature (Duffie, 2013). As expected, the magnitude of the measured or estimated solar radiation is less than the extra- terrestrial solar radiation at the same location since gases and dusts in the atmosphere changes the magnitude and spectral composition of the solar radiation that reaches the earth surface.
Fig. 4: Monthly average solar radiation in Mhlume.
In addition, the performance of the models can be quantified by evaluating the root-mean-square-error (RMSE) and the mean-percentage-error (MPE). These are fundamental measures of accuracy in solar energy calculations (Saffaripour, 2013; Li, 2014, Muzathik, 2011; Okundamiya, 2016). They are respectively defined as
1/21
2 , ,
1
n
j
meas j calc
j H
H n
RMSE (3)
% 100 1 1 , , ,
nj jmeas
meas j calc j H H H n
MPE (4)
Where n=12 is the number of data pairs, Hj,calcis the j-th calculated value and Hj,measis the j-th
measured value. Both models give an absolute MPE that is less than five percent as shown in Table 2 which is considered acceptable in scientific calculations. Model 1 was found to give a lower value of RMSE, an indication of a better performance.
Table 2. Error analysis between estimated and measure solar radiation data for in 2006 and 2012 at Mhlume.
Error Measure Model 1 Year 2006 data
Model 1 Year 2012 data
Model 2 Year 2006 data
Model 2 Year 2012 data
RMSE 0.93 1.11 1.11 1.58
PME (%) -1.94 -3.28 -1.60 -1.86
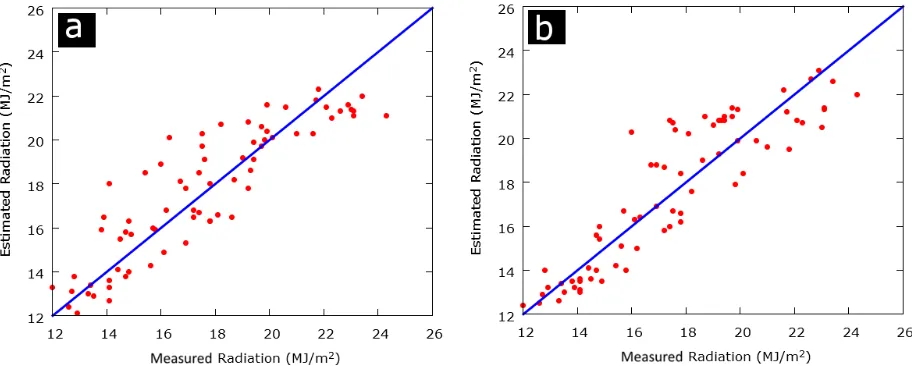
The behavior of the two models is further explored through a scatter plot of the estimated data against the measured data collected for over a decade from 2002 to 2014. Fig. 5 shows that both models are consistent with the measured data over this period
Fig. 5: Comparison between measured and predicted monthly average solar radiation from year 2004 to 2014 in Mhlume. The estimates were obtained using Model 1 and Model 2 for (a) and (b),
respectively.
Prediction of solar radiations in other locations
We then utilized the two models with their coefficient calibrated with the measured from Mhlume to estimate monthly average solar radiation levels at Big Bend, Matsapha, and Mbabane. The results are shown in Fig. 6 for the year 2012. Both models give consistent results for Mhlume and Matsapha. Model 2 predicts slightly higher radiation levels than Model 1 for Mbabane. The prediction from the two models were then explored over longer period, using air-temperature data collected between the year 2002 and 2013. The results are given in scatter plot in Fig. 7 for the four locations. These results show that both models are consistent in all the locations except in Mbabane, where Model 1 generally predicts lower values than model 2. This could be due to the fact that the altitude of Mbabane is higher than that of Mhlume by one order of magnitude (see Table 1). If were considered that value of
Fig. 6: Estimate monthly average solar radiation in four different regions in Swaziland: Mhlume, Big-Bend, Matsapha, and Mbabane. Mhlume also includes measured data.
5. CONCLUSIONS
Air-temperature based models for estimating solar radiation are useful for quantifying solar radiation levels in different locations around the world because they are based on commonly available meteorological data. In this study, a simple linear model that uses average monthly air-temperatures and the classical Hargreaves-Samani Model have been shown to accurately predicted solar radiation levels at Mhlume in Swaziland with an acceptable mean percentage error. The parameter of the Hargreaves-Samani Model calibrated with measured data from Mhlume is consistent with the value of 0.16 that was recommended by Heagreaves (1994) for inland regions.
For other locations within Swaziland with a slight variation of climatic conditions from Mhlume, the same model parameters can be applied to predict their solar radiation levels. In this regard, we have found that the two models produce consistent results for two locations: Matsapha and Big Bend. However for a third location, Mbabane, which has a wider variation in climatic conditions than Mhlume, the models do not produce consistent results and therefore there is a need to correctly adjust the model parameters for Mbabane or similar regions.
Fig.7: Comparison between estimated average solar radiation for year between 2002 and 2013 in Big Bend, Matsapha, Mbabane, and for years between 2004 and 2013 in Mhlume.
6. ACKNOWLEDGEMENT
The authors are grateful to the Royal Swaziland Sugar Corporation, Department of Geography, Environmental Science and Planning at the University of Swaziland (UNISWA), and the Swaziland Meteorological Services Department for providing the data used in this work. The authors also acknowledge the valuable suggestions from Dr. W. H. Liao of the Department of Physics (UNISWA).
7. REFERENCES
Allen RG (1997). Self-calibrating method for estimating solar radiation from air temperature. J. Hydrol. Eng. 2(2): 56-67.
Angstrom A (1924). Solar and terrestrial radiation. Q. J. R. Meteorol. Soc. 50: 121- 126.
Bajpai U, Singh K (2009). Estimation of instant solar radiation by using instant temperature. Acta Montanistica Slovaca 14(1): 189-196.
Chegaar M, Lamri A, Chibani A (1998). Estimating global solar radiation using sunshine hours. Rev. Energ. Ren. : Physique Energetique pp. 7-11.
Saffaripour MH, Mehrabian MA, and Bazargan H (2013). Predicting solar radiation fluxes for solar energy system applications. Int. J. Environ. Sci. Technol. 10: 761-768.
Datta D, Datta BK, (2013). Empirical model for the estimation of global solar radiation in Dhaka, Bangladesh, IJRET 2(11): 649-653.
Dos Santos CM, De Souza JL, Ferreira-Junior RA, Tiba C, de Melo RO, Lyra GB, Teodoro I, Lyra GB, Lemes MAM (2014). Modelling global solar irradiation using air temperature for Alagoas state, northeastern Brazil. Energy 2014:1-11.
Duffie JA, Beckman WA (2013). Solar Engineering of Thermal Processes, John Wiley, New Jersey.
Hargreaves GH(1994). Simplified coefficients for estimating monthly solar radiation in North America and Europe. Dept. Biol. And Irrig. Engrg. Utah State Univ., Logan, Utah.
Hargreaves GH, Samani ZA (1982). Estimating potential evapo-transpiration. J.Irrig. and Drain. Engr. 108: 223-230.
Kostic R, Mikulovic J (2017). The empirical models for estimating solar insolation in Serbia by using meteorological data on cloudiness. Renew. Energy 114: 1281-11293.
Li H, Cao F, Bu X, Zhao L (2014). Models for calculating daily global solar radiation from air temperature in humid regions–a case study. Environ. Prog. Sustain. Energy 34(2): 595-599.
Li H, Cao F, Wang X, Ma WA (2014). A temperature-based model for estimating monthly average daily global solar radiation in China. Sci. World J. 2014: 128754, 1-9.
Liu J, Liu J, Linderholm HW, Chen D, Yu Q, Wu D, Haginoya S (2012). Observation and calculation of solar radiation on the Tibetan Plateau. Energ. Convers. Manage. 57: 23-32.
Okundamiya MS, Emagbetere JO, and Ogujor EA, Evaluation of various global solar radiation models for Nigeria (2016). Int. J. Green Energy 13(5): 505-512.
Sonmete MH, Ertekin C, Menges HO, Haciseferogullari H, Evrendilek F (2011). Assessing monthly average solar radiation models: a comparative case study in Turkey. Environ. Monit. Assess. 175: 251-277.
Umoh MD, Udo SO, Udoakah, YN (2014). Estimating global solar radiation on horizontal surface from the sunshine hours over Port Harcourt, Nigeria. J. Electrical Electron. Eng. Res. 6(1): 1-5.
Yakubu D, Medugu DW (2012). Relationship between the global solar radiation and the sunshine duration in Abuja, Nigeria. Ozean J. Appl. Sci, 5(3): 221-228.

![Fig. 2: Monthly average solar radiation [MJ/m2] and air temperature [◦C] in Mhlume](https://thumb-us.123doks.com/thumbv2/123dok_us/7982910.1324248/3.596.82.518.70.182/fig-monthly-average-solar-radiation-mj-temperature-mhlume.webp)