_____________________________________________________________________________________________________ *Corresponding author: E-mail: ralghamdi1000@hotmail.com;
(Past name: British Journal of Medicine and Medical Research, Past ISSN: 2231-0614, NLM ID: 101570965)
Prevalence of Childhood Obesity among Primary
School Students at Taif Governorate, Saudi Arabia
Rasheed Ali AlGhamdi
1*1
Department of Family Medicine, Ministry of Health, Taif, Saudi Arabia.
Author’s contribution
The sole author designed, analysed, interpreted and prepared the manuscript.
Article Information
DOI: 10.9734/JAMMR/2019/v31i530299 Editor(s): (1) Dr. Mohamed Essa, Department of Food Science and Nutrition, Sultan Qaboos University, Oman. Reviewers: (1) Wai Sum O., The Chinese University of Hong Kong, China. (2) Luciana de Barros Correia Fontes, Federal University of Pernambuco UFPE, Brazil. Complete Peer review History:http://www.sdiarticle4.com/review-history/52846
Received 14 September 2019 Accepted 23 November 2019 Published 05 December 2019
ABSTRACT
Background: Obesity in children is rapidly emerging as a global epidemic that will have profound public health consequences as overweight children become overweight adults particularly if obesity is present in adolescence.
Objectives: To determine the prevalence of overweight and obesity among school children between 6-12 years (males and females) at Taif primary schools and determine the associated dietary risk factors for overweight and obesity.
Methods: A cross sectional analytic study was implemented included a representative sample of primary school students (boys and girls) enrolled in governmental schools in Taif, Saudi Arabia, 2014-2015. Data were collected by using valid self-administered questionnaire, with family help. It including socio-demographic characteristics and detailed dietary history. Body mass index-for-age percentiles of CDC were utilized in this study to diagnose obesity.
Results: Among schoolboys, the prevalence of overweight was 10.7%, while prevalence of obesity was 7.6%; the problem seemed to be worse in girls, where the prevalence of overweight and obesity were 16.8% and 18.2%, respectively. Multivariate logistic regression analysis revealed that girls were al almost double risk for developing overweight/obesity compared to boys ((aOR=1.93; 95%CI: 1.03-3.60, p<0.05). Habit of eating cheeps potatoes at school at abnormal rate was associated with almost three-folded risk for obesity or overweight compared to eating cheeps potatoes within normal (aOR=3.14; 95%CI: 1.17-8.41). School children who had the habit of taking
AlGhamdi; JAMMR, 31(5): 1-21, 2019; Article no.JAMMR.52846
fast foods at least three times/week were more likely to develop obesity or overweight compared to those who did not take fast foods (aOR=1.98; 95%CI:1.08-6.30).
Conclusions: Overweight and obesity among primary school children in Taif city, Saudi Arabia is a public health problem affecting more than one-third of girls and almost one fifth of boys. It confirms the significant association between some unhealthy dietary habits and increase prevalence of childhood obesity.
Keywords: Obesity; Saudi Arabia; childhood; dietary habits.
1. INTRODUCTION
Obesity is one of the most common disorders encountered in clinical practice and has major public health implications. Unfortunately, it is also one of the most difficult and frustrating disorders to manage successfully [1].
Obesity is defined as the presence of excess adipose tissue.1It is a complex condition, with serious social and psychological dimensions [2,3] that affect virtually all age and socioeconomic groups and threatens to overwhelm both developed and developing countries [4].
Mortality rises exponentially with increasing bodyweight. The risk of coronary heart disease is doubled if the body mass index (BMI) is >25 and nearly quadrupled if the index is >29 [5,6]. The risk of developing diabetes increases with increasing weight and people with a body mass index >35 have a 40 fold higher risk of developing the disease than non-obese people [5,7] Osteoarthritis and respiratory diseases, particularly sleep apnoea are more common in obese people [5].
Obesity was significantly associated with an increase in both systolic and diastolic blood pressure, [8,9] stroke, and certain forms of cancer [4] The prevalence of overweight and obesity has increased in the last few years[10]. Between 1980 and1995, the prevalence of obesity in Britain doubled from 8-15% [5] In 1995, there were an estimated 200 million obese adults worldwide and another 18 million children under-5-years classified as overweight. By the year 2000, the number of obese adults had increased to over 300 million [4]. Children and adolescents are also involved in those changes.
In the United States of America (USA), the percentage of children and adolescents who are overweight has more than doubled in the past 30 years [11]. Although obesity in children is rarely associated with morbidity or mortality, it is rapidly
emerging as a global epidemic that will have profound public health consequences as overweight children become overweight adults particularly if obesity is present in adolescence [12]. For example, the risk of developing adult obesity in children aged >9 years who are obese is up to 80% at age 35 years [13]. Unfortunately, it is evident that obesity is a common health problem among Saudis [14].
Overweight and obesity in the adult Saudi population were reported in different studies with a range of males overweight 26-34%, obesity 12-23% and females overweight 24-29%, obesity 19-41% [14-19]. This high prevalence of
overweight and obesity is a cause of concern, as obesity is associated with several
complications that increase both morbidity and mortality.
Rationale: Up to our knowledge, there is no previous study to assess prevalence of childhood obesity among primary school students in Taif.
1- Childhood obesity is a worldwide as well a Saudi health problem and need a lot of actions to face it.
2- It is a preventable problem through simple procedure such as parental education and counseling.
Aim: To assess the magnitude of the problem of childhood obesity among primary school students in Taif governorate, 2014-2015.
1.1 Objectives
- To determine the prevalence of overweight and obesity among school children between 6-12 years at Taif primary schools.
- To compare the prevalence between male and female students.
2. LITERATURE REVIEW
While reviewing the literatures about childhood obesity prevalence, a lot of articles worldwide were cited. In Saudi Arabia, there were 6 articles published in different local and international journals.
2.1 Local Studies
-Overweight and obesity among Saudi Arabian children and adolescent between 1994 and 2000 by Abalkhil and he observed that the combined prevalence of overweight and obesity in the country was estimated to be around 27.5% among boys between 6 and 18 years of age in 1996, and 28% among girls between 12 and 19 years in 1999, in comparison between 1994 and 2000, there is total increase in BMI for boys10-12% (up to age 16) followed by gradual decline with age , and for girls 2.4-4.9% (up to age 15) followed by gradual increase in BMI reaching 9% at age 20 [20].
Another study conducted by Al Herbish to identify the etiology of childhood obesity. The researcher found that the nutritional factor is the most important factor representing 88.5% of cases [21].
El-Hazmi and Warsy studied the prevalence of obesity and overweight in 1-18 year old Saudi children. The result revealed that the overall prevalence of overweight was 10.7% for boys and 12.7% for girls, while obesity was 6% in boys and 6.74% in girls. The highest frequency was in the eastern region, while the lowest was in southern region [22].
Obesity among Saudi male adolescents in Riyadh was studied by Al-Rukban. He found that the prevalence of overweight was 13.8% and obesity was 20.5% [23].
Khaled, et al. conducted a study to describe the prevalence of childhood overweight and obesity in rural high- and low-altitude populations of southwestern Saudi Arabia and to identify specific at-risk groups within these populations and they found that the overall prevalence of overweight and obesity is 10%. Among risk factors of overweight and obesity, high altitude was a significant and independent factor [24].
Recently, Al-Shehri carried out a cross-sectional study to determine the prevalence of overweight and obesity among school children between 6-12 years as well as to identify the associated
unhealthy dietary habits for overweight and obesity. It included a representative sample of primary schoolboys in Al-Iskan sector in Makkah AlMukarramah. The sample size was distributed among the three primary school in Al-Iskan sector and determined as a percentage proportionally related to the total number of the student in each school. Self-administered questionnaire (with family help) including socio-demographic characteristic and detailed dietary history, was used for data collection. Trained staff collected anthropometric measurements of weight and height. The study included 258 male primary school children. Their age ranged between 6 and 12 years. The prevalence of overweight was12.4% and that of obesity was 20.2%. Among studied socio-demographic variables associated with overweight and obesity, birth weight above normal was significantly associated with them (p<0.05) while among studied dietary factors, eating fried potatoes and chocolate at a rate more than normal was significantly associated with overweight and obesity among male school children. The habit of eating fast foods frequently (at least three times/week) was accompanied with higher prevalence of obesity (30.4%) compared to only 8% among school children who did not eat fast foods. This association between BMI and habit of eating fast foods was statistically significant (p<0.05). He concluded that the study provided alarming evidence-based data on the considerable prevalence of childhood overweight and obesity among primary school children in Holly Makkah, Saudi Arabia [25].
2.2 Regional Studies
-In gulf countries, 3 related studies conducted in in Kuwait, UAE, and Iraq were cited. The Iraqi one reported the prevalence and possible risk factors of childhood obesity and revealed that the prevalence of overweight was 6% and of obesity was1.3% [26].
-In UAE, A national study was carried out by Al-Haaddad who conclude that the frequency of obesity among UAE youth was two to three times greater than the recently published international standard [27].
AlGhamdi; JAMMR, 31(5): 1-21, 2019; Article no.JAMMR.52846
-In Egypt, Badawi et al. [29] conducted a study to estimate the prevalence of overweight and obesity among primary school children, aged from 6 to 12 years and to estimate risk factors of obesity and overweight, defined by body mass index (BMI). A cross-sectional study was carried out at Port Said city during the second term of school year 2010/2011. Eight hundred and fifty-two students participated in this study. Prevalence of overweight and obesity was 17.7% and 13.5% respectively. The rate of obesity was the highest at the age of 7–8 years (grade 2) and decreased with an increase in age, while overweight increased with an increase in age to be the highest at the age of 9– 10 (grade 4) and 10–11 (grade 5). Socioeconomic class, faulty dietary habits, sedentary life, low level of physical activity and positive family history of overweight and/or obesity were significantly associated with student’s BMI.
2.3 International Studies
-In USA, changes in state-specific childhood obesity and overweight prevalence in the United States from 2003 to 2007 was studied by Singh et al. The results revealed that in 2007, the prevalence of obesity was 16.4% and overweight was 31.6% and there is 10% increase in prevalence between 2003 and 2007 [30].
-In Japan, prevalence of childhood obesity from 1978 to 2007 was studied by Yoshinaga et al. The result showed gradual decrease in the prevalence of obesity since the early 2000s [31].
-In Tanzania, Muhihi et al reported an overall prevalence of child obesity of 5.2% and was higher among girls (6.3%) compared to boys (3.8%). Most obese children were from households with fewer children (p=0.019) and residing in urban areas (p=0.002). Controlling for other variables, age above 10 years (aOR=3.3, 95% CI=1.5-7.2), female sex (aOR=2.6, 95% CI=1.4-4.9), urban residence (aOR=2.5, 95% CI=1.2-5.3) and having money to spend at school (aOR=2.6, 95% CI=1.4-4.8) were significantly associated with child obesity [32].
3. METHODOLOGY
3.1 The Study Area
Taif city is located in the Mecca Province of Saudi Arabia at the West of Saudi Arabia in an elevation of 1700 meters on the slopes of the
Al-Sarawat Mountains. It has a population of 987,914 (2010 census). Taif city includes 605 primary governmental schools (day shift), 310 for boys and 295 for girls. The number of primary schoolchildren is 66294 (31754 boys and 34,540 girls).
3.2 Study Design
A cross sectional analytic study.
3.3 Study Population
Primary school students (boys and girls) enrolled in governmental schools in Taif, Saudi Arabia, 2014-2015, who were present at the time of the study and were willing to participate in it.
3.4 Population Selection Criteria
Inclusion criteria
Students enrolled in governmental primary schools in Taif, Saudi Arabia, 2014-2015
Boys and girls.
Exclusion criteria
Primary school students who were not present at the time of conducting the study or not willing to participate.
Those aged over 12 years.
3.5 Sample Size
The sample size was calculated by Raosoft online calculator [33]. It was 247 students (based on 20.2% expected prevalence) [25]. The worst accepted prevalence was 22% and confidence interval of 95%. This sample will be increased to 275 students to compensate for non-response (132 boys and 143 girls).
3.6 Sampling Technique
was applied to select the sample size from each school. A sufficient sample size was recruited from these schools.
3.7 Data Collection
Data were collected by using self-administered questionnaire, with family help. It has been previously validated and proved to be reliable in a study conducted in Makkah by Al-Shehri [25]. It including socio-demographic characteristic and detailed dietary history. Trained staff collected anthropometric measurements of weight and height. Height was measured without shoes to the nearest “0.5 cm” and weight to the nearest “100 g with the subject in light clothes and without shoes. A single scale was used for weighing all the students. This scale was calibrated daily, and zero was assured before weighing any student.
Body mass index which is the weight in kilogram divided by the height in meters squared (kg/m2), was calculated for all the study participants.
3.8 Outcome Variables
Under weight; when BMI < 5th percentile, Overweight; when BMI> or = 85th percentile and < 95th percentile and Obesity; when BMI > or = 95th percentile. Body mass index-for-age percentiles of CDC were utilized in this regard [34].
3.9 Preparatory Phase
Intensive literature review has been made using internet midline search and journals for both national and international related studies were obtained.
3.10 Pilot Study
Pilot study was conducted before data collection and no modifications were needed on the pilot testing results. Randomly selected 12 female and 12 male students in two schools (2 from each level) were selected for the pilot testing. Data of the pilot study were included in the actual study since there was no significant variations from the main survey results.
3.11 Data Entry and Analysis
Statistical Package for Social Sciences (SPSS) software version 20.0 was used for data entry and analysis. Descriptive statistics (e.g. number, percentage) and analytic statistics using Chi Square tests (χ2) to test for the association
and/or the difference between two categorical variables were applied. P-value equal or less than 0.05 was considered statistically significant. Multivariate regression analysis was used to adjust for confounding factors for obesity and overweight.
4. RESULTS
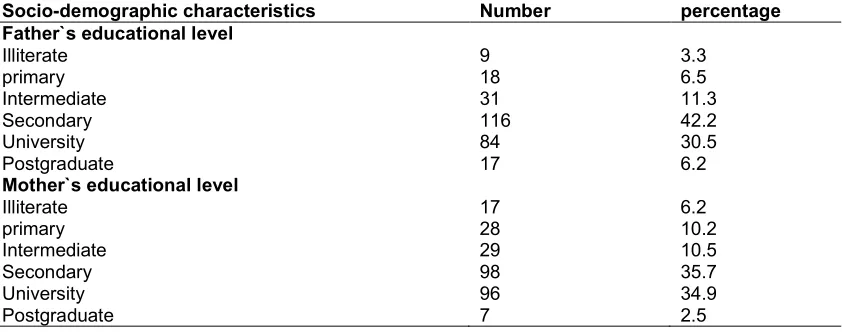
The study included 275 students enrolled in Taif governmental primary schools (143 girls and 132 males). Table 1 presents their socio-demographics. Their age ranged between 6 and 12 years with a mean of 9.44 years and standard deviation of ±1.89 years. Birth weight was normal among majority of them (87.3%) while it was above normal among only 3.6% of them. Majority of them (96.4%) live with both parents. Most of them (81.1%) had family size ranged of 8 persons or less. More than two-thirds of them (69.1%) had two brothers or less whereas slightly more than half of them (52.4%) had two sisters or less. Almost a fifth of them (21.8%) were first birth order. More than one third of fathers (36.7%) and mothers (37.4%) were at least university graduated.
4.1 Prevalence of Overweight and
Obesity
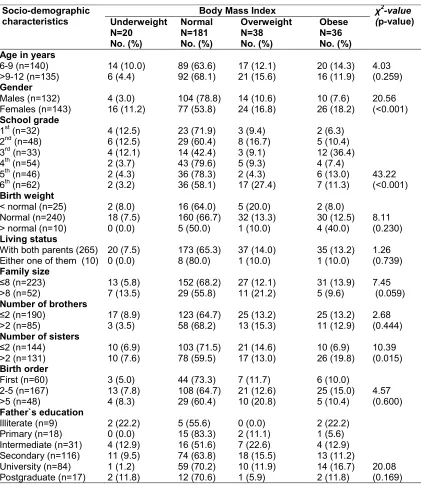
As shown in Fig. 1, overweight and obesity were reported among 16.8% and 18.2% of girls, respectively compared to 10.6% and 7.6% of boys, respectively. The difference was statistically significant, p<0.001 (Table 2). Among girls, the highest rate of obesity was observed in grade 3 (40%) whereas the highest rate of overweight was observed in grade 6 (35.3%). Among boys, the highest rate of obesity and overweight were reported in grade 3 (25% for each). The difference between boys and girls in this regard was statistically significant, p<0.001 (Fig. 2).
4.2 Factors Associated with Overweight and Obesity
Socio-demographic characteristics
among those of grade three (36.4%). On the other hand, the lowest rate of overweight was observed among children of grade 5 (4.3%) while the lowest rate of obesity was reported among children of grade one (6.3%). This association between school grade and overweight and obesity was statistically significant, p<0.001.
Obesity was more significantly reported among students who had more than two sisters
Fig. 1. Distribution of Body Mass Index among primary school children in Tai
Fig. 2. Prevalence of overweight and obesity among primary school children in Taif according
0 10 20 30 40 50 60 70 80 90 100
Boys
10.6
7.6
0% 10% 20% 30% 40% 50% 60% 70% 80% 90% 100% U n d er w ei gh t N o rm al O ve rw ei gh t MalesAlGhamdi; JAMMR, 31(5): 1-21, 2019; Article no.
among those of grade three (36.4%). On the other hand, the lowest rate of overweight was 5 (4.3%) while the lowest rate of obesity was reported among children of grade one (6.3%). This association between school grade and overweight and obesity was statistically significant, p<0.001.
Obesity was more significantly reported among had more than two sisters
compared to those who had two sisters or less (19.8% versus 6.9%). This difference is statistically significant, p=0.015.
There were no statistically significant association between BMI from one side and other studied socio-demographic characteristics such as age, birth weight, living status, family size, number of brothers, birth order and parental education from the other side.
Fig. 1. Distribution of Body Mass Index among primary school children in Taif according to gender
Fig. 2. Prevalence of overweight and obesity among primary school children in Taif according to grades and gender
Girls
16.8
18.2
Obesity Overweight Normal Underweight O ve rw ei gh t O b es e U n d er w ei gh t N o rm al O ve rw ei gh t O b es e Females 25 25 40 35.3; Article no.JAMMR.52846
compared to those who had two sisters or less (19.8% versus 6.9%). This difference is
There were no statistically significant association between BMI from one side and other studied raphic characteristics such as age, birth weight, living status, family size, number of brothers, birth order and parental education from
f according to
Fig. 2. Prevalence of overweight and obesity among primary school children in Taif according
Table 1. Socio-demographic characteristics of the primary schoolchildren, Taif (n=275)
Socio-demographic characteristics Number percentage Age in years
6-9 >9-12
140 135
50.9 49.1
Gender
Males Females
132 143
48.0 52.0
School grade
1st 2nd 3rd 4th 5th 6th
32 48 33 54 46 62
11.6 17.5 12.0 19.6 16.7 22.5
Birth weight
Less than normal Normal
More than normal
25 240 10
9.1 87.3 3.6
Living status
With both parents Either father or mother
265 10
96.4 3.6
Family size
≤8 >8
223 52
81.1 18.9
Number of brothers
≤2 >2
190 85
69.1 30.9
Number of sisters
≤2 >2
144 131
52.4 47.6
Birth order
First 2-5 >5
60 167 48
21.8 60.7 17.5
Table 2. Socio-demographic characteristics of the primary schoolchildren, Taif (n=275) (Cont.)
Socio-demographic characteristics Number percentage Father`s educational level
Illiterate 9 3.3
primary 18 6.5
Intermediate 31 11.3
Secondary 116 42.2
University 84 30.5
Postgraduate 17 6.2
Mother`s educational level
Illiterate 17 6.2
primary 28 10.2
Intermediate Secondary
29 98
10.5 35.7
University 96 34.9
AlGhamdi; JAMMR, 31(5): 1-21, 2019; Article no.JAMMR.52846
Table 3. Body mass index of primary schoolchildren according to their socio-demographic characteristics
Socio-demographic characteristics
Body Mass Index χ2-value (p-value) Underweight
N=20 No. (%)
Normal N=181 No. (%)
Overweight N=38 No. (%)
Obese N=36 No. (%) Age in years
6-9 (n=140) 14 (10.0) 89 (63.6) 17 (12.1) 20 (14.3) 4.03
>9-12 (n=135) 6 (4.4) 92 (68.1) 21 (15.6) 16 (11.9) (0.259)
Gender
Males (n=132) 4 (3.0) 104 (78.8) 14 (10.6) 10 (7.6) 20.56
Females (n=143) 16 (11.2) 77 (53.8) 24 (16.8) 26 (18.2) (<0.001)
School grade
1st (n=32) 4 (12.5) 23 (71.9) 3 (9.4) 2 (6.3)
2nd (n=48) 6 (12.5) 29 (60.4) 8 (16.7) 5 (10.4)
3rd (n=33) 4 (12.1) 14 (42.4) 3 (9.1) 12 (36.4)
4th (n=54) 2 (3.7) 43 (79.6) 5 (9.3) 4 (7.4)
5th (n=46) 2 (4.3) 36 (78.3) 2 (4.3) 6 (13.0) 43.22
6th (n=62) 2 (3.2) 36 (58.1) 17 (27.4) 7 (11.3) (<0.001)
Birth weight
< normal (n=25) 2 (8.0) 16 (64.0) 5 (20.0) 2 (8.0) Normal (n=240) 18 (7.5) 160 (66.7) 32 (13.3) 30 (12.5) 8.11 > normal (n=10) 0 (0.0) 5 (50.0) 1 (10.0) 4 (40.0) (0.230)
Living status
With both parents (265) 20 (7.5) 173 (65.3) 37 (14.0) 35 (13.2) 1.26 Either one of them (10) 0 (0.0) 8 (80.0) 1 (10.0) 1 (10.0) (0.739)
Family size
≤8 (n=223) 13 (5.8) 152 (68.2) 27 (12.1) 31 (13.9) 7.45
>8 (n=52) 7 (13.5) 29 (55.8) 11 (21.2) 5 (9.6) (0.059)
Number of brothers
≤2 (n=190) 17 (8.9) 123 (64.7) 25 (13.2) 25 (13.2) 2.68
>2 (n=85) 3 (3.5) 58 (68.2) 13 (15.3) 11 (12.9) (0.444)
Number of sisters
≤2 (n=144) 10 (6.9) 103 (71.5) 21 (14.6) 10 (6.9) 10.39
>2 (n=131) 10 (7.6) 78 (59.5) 17 (13.0) 26 (19.8) (0.015)
Birth order
First (n=60) 3 (5.0) 44 (73.3) 7 (11.7) 6 (10.0)
2-5 (n=167) 13 (7.8) 108 (64.7) 21 (12.6) 25 (15.0) 4.57
>5 (n=48) 4 (8.3) 29 (60.4) 10 (20.8) 5 (10.4) (0.600)
Father`s education
Illiterate (n=9) 2 (22.2) 5 (55.6) 0 (0.0) 2 (22.2)
Primary (n=18) 0 (0.0) 15 (83.3) 2 (11.1) 1 (5.6)
Intermediate (n=31) 4 (12.9) 16 (51.6) 7 (22.6) 4 (12.9) Secondary (n=116) 11 (9.5) 74 (63.8) 18 (15.5) 13 (11.2)
University (n=84) 1 (1.2) 59 (70.2) 10 (11.9) 14 (16.7) 20.08 Postgraduate (n=17) 2 (11.8) 12 (70.6) 1 (5.9) 2 (11.8) (0.169)
4.3 Dietary Factors
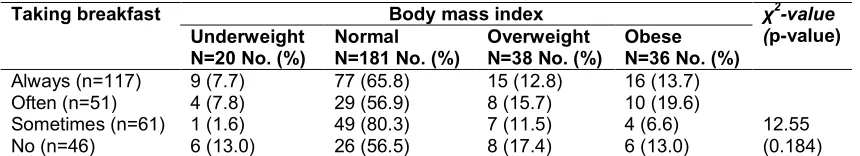
- History of having breakfast: As seen in Table 3, there was no statistically significant association between history of having breakfast and obesity (p>0.05).
- Most frequent meal: As illustrated in Table 5, among primary schoolchildren, the type of frequent taken main meal was
not significantly associated with prevalence of obesity, p>0.05.
- Habit of eating between meals: As obvious from Table 6, habit of eating between meals was not significantly associated with prevalence of obesity among primary schoolchildren (p>0.05).
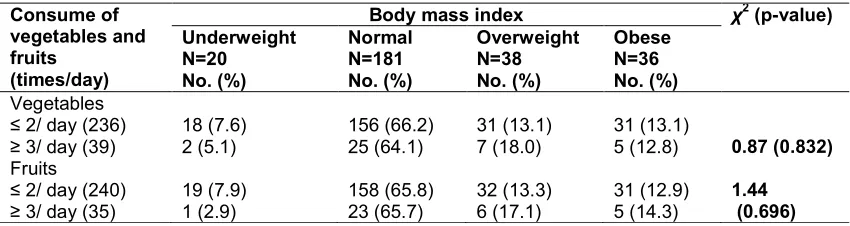
frequencies of eating vegetables and fruits were not statistically significantly associated with obesity.
- Habit of eating fast foods: Table 8 shows that the habit of eating fast foods frequently (more than three times/week) was accompanied with higher prevalence of obesity (26.7%) compared to none
among schoolchildren who did not take fast foods. This association between BMI and habit of eating fast
foods was statistically significant (p=0.036).
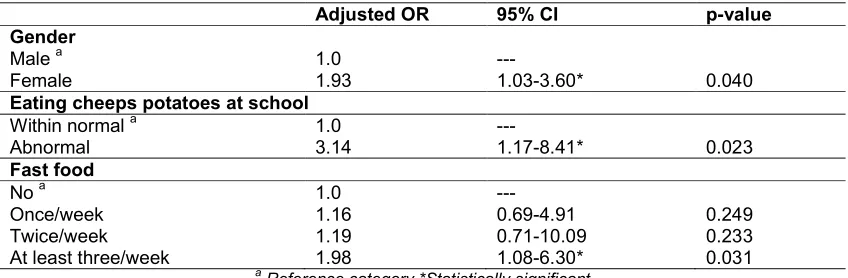
- Multivariate analysis: Multivariate logistic regression analysis demonstrated that primary school girls were at almost double-folded risk for obesity or overweight compared to primary school boys (aOR=1.93; 95%CI: 1.03-3.60, p<0.05). Habit of eating cheeps potatoes at school at abnormal rate was associated with almost three-folded risk for obesity or overweight compared to eating cheeps potatoes within normal (aOR=3.14; 95%CI: 1.17-8.41). School children who had the habit of taking fast foods at least three times/week were more likely to develop obesity or overweight compared to those who did not take fast foods (aOR=1.98; 95%CI:1.08-6.30). Variables of school
grade, number of sisters, eating at school, eating cake at school and taking milk at school were not significantly associated with obesity or overweight among schoolchildren Table 9.
5. DISCUSSION
The rapid urbanization in gulf countries including Saudi Arabia in the last few decades is associated with unhealthy lifestyles described as the lifestyle syndrome which leads to very high rates of obesity and its consequent morbidity and mortality. In addition, childhood obesity is still considered a sign of healthiness and high social class in such countries [34].
Most of previous local studies about childhood overweight and obesity depended on growth charts which were designed for western nations (usually CDC growth charts were used). These charts might not be appropriate for our children; they could underestimate the problem of obesity and mistakenly assign a child as normal while he is really overweight or obese. The unique feature of the present study was the use of new growth charts which could be more appropriate for our children i.e. recently published 2007 WHO growth charts which were prepared using data from different countries [35].
Table 4. Body mass index of primary schoolchildren according to their socio-demographic characteristics (Cont.)
Socio-demographic characteristics
Body mass index χ2-value (p-value) Underweight
N=20 No. (%)
Normal N=181 No. (%)
Overweight N=38 No. (%)
Obese N=36 No. (%) Mother`s education
Illiterate (n=17) 2 (11.8) 10 (58.8) 2 (11.8) 3 (17.6)
Primary (n=28) 1 (3.6) 19 (67.9) 7 (25.0) 1 (3.6)
Intermediate (n=29) 4 (13.8) 15 (51.7) 6 (20.7) 4 (13.8) Secondary (n=98) 5 (5.1) 66 (67.3) 14 (14.3) 13 (13.3)
University (n=96) 8 (8.3) 66 (68.8) 9 (9.4) 13 (13.5) 14.65 Postgraduate (n=7) 0 (0.0) 5 (71.4) 0 (0.0) 2 (28.6) (0.477)
Table 5. Association between body mass index of primary school children and history of taking breakfast
Taking breakfast Body mass index χ2-value (p-value) Underweight
N=20 No. (%)
Normal N=181 No. (%)
Overweight N=38 No. (%)
Obese N=36 No. (%)
Always (n=117) 9 (7.7) 77 (65.8) 15 (12.8) 16 (13.7)
Often (n=51) 4 (7.8) 29 (56.9) 8 (15.7) 10 (19.6)
Sometimes (n=61) 1 (1.6) 49 (80.3) 7 (11.5) 4 (6.6) 12.55
AlGhamdi; JAMMR, 31(5): 1-21, 2019; Article no.JAMMR.52846
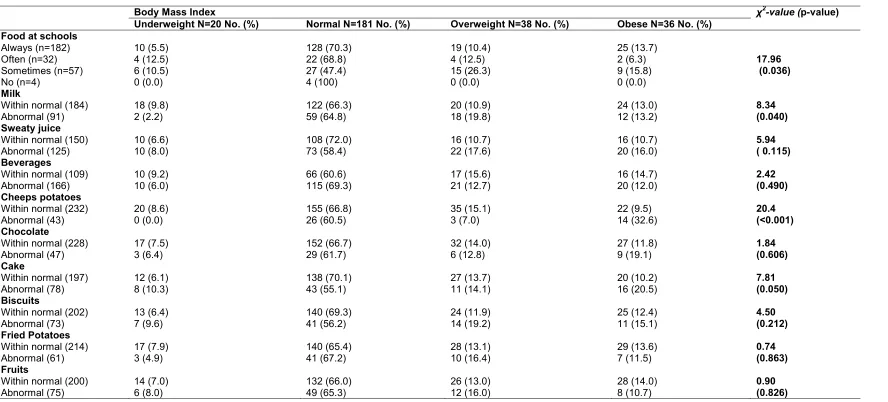
Table 6. Association between body mass index of primary schoolchildren and their history of having food at schools
Body Mass Index χ2-value (p-value)
Underweight N=20 No. (%) Normal N=181 No. (%) Overweight N=38 No. (%) Obese N=36 No. (%) Food at schools
Always (n=182) 10 (5.5) 128 (70.3) 19 (10.4) 25 (13.7)
Often (n=32) 4 (12.5) 22 (68.8) 4 (12.5) 2 (6.3) 17.96
Sometimes (n=57) 6 (10.5) 27 (47.4) 15 (26.3) 9 (15.8) (0.036)
No (n=4) 0 (0.0) 4 (100) 0 (0.0) 0 (0.0)
Milk
Within normal (184) 18 (9.8) 122 (66.3) 20 (10.9) 24 (13.0) 8.34
Abnormal (91) 2 (2.2) 59 (64.8) 18 (19.8) 12 (13.2) (0.040)
Sweaty juice
Within normal (150) 10 (6.6) 108 (72.0) 16 (10.7) 16 (10.7) 5.94
Abnormal (125) 10 (8.0) 73 (58.4) 22 (17.6) 20 (16.0) ( 0.115)
Beverages
Within normal (109) 10 (9.2) 66 (60.6) 17 (15.6) 16 (14.7) 2.42
Abnormal (166) 10 (6.0) 115 (69.3) 21 (12.7) 20 (12.0) (0.490)
Cheeps potatoes
Within normal (232) 20 (8.6) 155 (66.8) 35 (15.1) 22 (9.5) 20.4
Abnormal (43) 0 (0.0) 26 (60.5) 3 (7.0) 14 (32.6) (<0.001)
Chocolate
Within normal (228) 17 (7.5) 152 (66.7) 32 (14.0) 27 (11.8) 1.84
Abnormal (47) 3 (6.4) 29 (61.7) 6 (12.8) 9 (19.1) (0.606)
Cake
Within normal (197) 12 (6.1) 138 (70.1) 27 (13.7) 20 (10.2) 7.81
Abnormal (78) 8 (10.3) 43 (55.1) 11 (14.1) 16 (20.5) (0.050)
Biscuits
Within normal (202) 13 (6.4) 140 (69.3) 24 (11.9) 25 (12.4) 4.50
Abnormal (73) 7 (9.6) 41 (56.2) 14 (19.2) 11 (15.1) (0.212)
Fried Potatoes
Within normal (214) 17 (7.9) 140 (65.4) 28 (13.1) 29 (13.6) 0.74
Abnormal (61) 3 (4.9) 41 (67.2) 10 (16.4) 7 (11.5) (0.863)
Fruits
Within normal (200) 14 (7.0) 132 (66.0) 26 (13.0) 28 (14.0) 0.90
Table 7. Association between body mass index of primary schoolchildren and their most frequent meal
Body mass index χ2-value (p-value) Underweight
N=20 No. (%)
Normal N=181 No. (%)
Overweight N=38 No. (%)
Obese N=36 No. (%)
Breakfast alone or with others (20)
2 (10) 9 (45.0) 5 (25.0) 4 (20.0)
Lunch and/or dinner (100)
7 (7.0) 65 (65.0) 17 (17.0) 11 (11.0)
All meals (153) 9 (5.9) 107 (69.9) 16 (10.5) 21 (13.7) 7.06 (0.316)
* Data were missed in two cases
Table 8. Association between body mass index of primary schoolchildren and habit of eating between meals
Body mass index χ2-value (p-value) Underweight
N=20 No. (%)
Normal N=181 No. (%)
Overweight N=38 No. (%)
Obese N=36 No.(%)
Always (n=44) 7 (15.9) 28 (63.6) 2 (4.5) 7 (15.9)
Often (n=90) 4 (4.4) 64 (71.1) 11 (12.2) 11 (12.2)
Sometimes (n=123) 7 (5.7) 78 (63.4) 23 (18.7) 15 (12.2) 12.56
No (=18) 2 (11.1) 11 (61.1) 2 (11.1) 3 (16.7) (0.183)
Table 9. Association between body mass index of primary school children and frequency of eating fruits and vegetables
Consume of vegetables and fruits
(times/day)
Body mass index χ2 (p-value) Underweight
N=20 No. (%)
Normal N=181 No. (%)
Overweight N=38 No. (%)
Obese N=36 No. (%)
Vegetables
≤ 2/ day (236) 18 (7.6) 156 (66.2) 31 (13.1) 31 (13.1)
≥ 3/ day (39) 2 (5.1) 25 (64.1) 7 (18.0) 5 (12.8) 0.87 (0.832)
Fruits
≤ 2/ day (240) 19 (7.9) 158 (65.8) 32 (13.3) 31 (12.9) 1.44
≥ 3/ day (35) 1 (2.9) 23 (65.7) 6 (17.1) 5 (14.3) (0.696)
The prevalence of overweight and obesity of primary school boys in the current study were 10.6% and 7.6%, respectively. This result is lower than that reported in other previous Saudi studies. A study done in 1996 showed that the prevalence of overweight and obesity were 11.7 and 15.8 respectively [36] More recent study concluded that obesity prevalence increased among Saudi school boys to 24.5% [37]. In 2008, locally published study done in Al-Hassa showed that the prevalence of overweight of primary school boys was 14.2% while that of obesity was 9.7%, but the age range in that study was 10-12 years [25]. In a study conducted among primary school children in Riyadh (2013), a prevalence of 16% and 11% for overweight and obesity were reported among school boys [32].
AlGhamdi; JAMMR, 31(5): 1-21, 2019; Article no.JAMMR.52846
20% and 17% for overweight and obesity were reported among school girls [32]. Al-Shehri et al. [39] carried out a review is to evaluate the prevalence and the trends of obesity among Saudi children (2000-2012). The rates of overweight and obesity among school-age children have reached 23% and 9.3%, respectively.
Overall, a variation in the prevalence of obesity and overweight among children in geographical regions of the Kingdom was noted. This apparent increase in the prevalence of overweight and obesity in recent studies including ours, particularly among girls could reflect more deterioration in the situation in Saudi Arabia regarding childhood obesity which necessitate a need for rapid and effective action to deceases this problem burden.
The prevalence of overweight and obesity among primary schoolchildren in other parts of the world varies considerably. Some studies report higher rates than reported in the present study and some reported comparable results. Krassas et al.
reported that the prevalence of overweight in Greek children aged 6–10 years (2001) was 25.3% [40]. In addition, Núñez-Rivas et al. in Costa Rica reported that the prevalence of overweight and obesity in children aged 7–12 years was 34.5% and 26.2% respectively [41]. In a study done by Manzoli et al. in 2005 in Italy, the prevalence of overweight among students aged 6–16 years was 40.6% [42]while in Spain it was 40.0% [43]. In the USA, the prevalence of overweight and obesity among children has been reported to be 22% and 11% respectively [44]. However some studies report similar or lower rates than ours. Hajian-Tilaki et al reported prevalence rates of obesity and overweight as 5-8% and 12.3% respectively among schoolchildren (7-12 years) in Iran [45]. In India, the prevalence of overweight was reported as 10%among 10–15 year-olds, [46] and in Turkish students aged 12–17 years this figure was 10.6% [47]. In a study by Zini et al. in Malaysian primary-school children aged 9–10 years in 2005, the prevalence of overweight and obesity was 16.3% and 6.3% respectively [48]. The differences seen in the results of these studies
Table 10. Association between body mass index of primary schoolchildren and their habit of eating fast foods
Eating fast food Body mass index χ2 (p-value) Underweight
N=20 No. (%)
Normal N=181 No. (%)
Overweight N=38 No. (%)
Obese N=36 No. (%)
Never (n=7) 2 (28.6) 4 (57.1) 1 (14.3) 0 (0.0)
Once/week (n=159) 15 (9.4) 108 (67.9) 17 (10.7) 19 (11.9 Twice/week (n=67) 3 (4.5) 46 (68.7) 9 (13.4) 9 (13.4)
Three times/week (n=27) 0 (0.0) 14 (51.9) 9 (33.3) 4 (14.8) 22.14 >3 times/week (n=15) 0 (0.0) 9 (60.0) 2 (13.3) 4 (26.7) (0.036)
Table 11. Adjusted Odds ratio for risk factors of obesity among primary schoolchildren: Multivariate regression analysis
Adjusted OR 95% CI p-value Gender
Male a 1.0 ---
Female 1.93 1.03-3.60* 0.040
Eating cheeps potatoes at school
Within normal a 1.0 ---
Abnormal 3.14 1.17-8.41* 0.023
Fast food
No a 1.0 ---
Once/week 1.16 0.69-4.91 0.249
Twice/week 1.19 0.71-10.09 0.233
At least three/week 1.98 1.08-6.30* 0.031
a
Reference category *Statistically significant
could be attributed partially to the effect of genetic, lifestyle and environmental factors, and variations in the age groups of the samples and because of different study methods and definitions of obesity and underweight across the various studies.
This study could not find a significant association between childhood obesity and parental occupational or educational level. These factors were studied internationally and the results were conflicting. Studies from France [49] and Germany [50] showed that the risk of childhood obesity was significantly lower in those children with higher parental occupational and educational level. On the other hand; in agreement with our findings, studies from Italy [51] and Turkey [52] found no association between childhood obesity and parental occupational and educational level.
Taking a healthful breakfast can help prevent childhood obesity. It can also help teens that need to lose a few pounds. Younger children are more likely to eat breakfast than teens. Teens are often in a hurry to leave for school and are often drowsier in the morning and simply do not feel like eating. Providing an appetizing breakfast may encourage them to eat. Something with protein is a good choice but oatmeal is also filling. Some schools now serve breakfast in the mornings but school breakfasts are often high in sugar and not particularly healthful [53]. In the current study, no significant association between taking breakfast and prevalence of obesity among studied school children was reported. However, the high prevalence of overweight and obesity among those who did not take breakfast supports the fact that healthful breakfast can help prevent childhood obesity. From the other side, the relatively high prevalence among those who always take breakfast reflects the unhealthy breakfast full of sugar and fats. So, the issue is not just to have a breakfast, but it should be healthy.
Teenage and childhood fast food obesity epidemic is growing around the world. Part of the reason is advertising, which has positioned fast food as an 'in' thing and this has appeal to the teenage and childhood group [54]. Fast food obesity is a problem because fast food meal contains low quality carbohydrates; high levels of saturated fat, white bread, and a sugary soda and also has relatively low fiber content. This kind of eating pattern is entirely gives negative effect, which resulted cardiovascular disease and diabetes. This alarming teenage and childhood
fast food obesity epidemic is rapidly rising during the past few years. Fast food and obesity is interrelated with each other. For a person who takes fast food meal twice a week, obesity ratio will be raised about 50% [54]. In accordance with that, in the present study, schoolchildren who consume fast food meals more than three times per week were at almost double risk to develop obesity compared to those not consume fast foods.
As expected, eating abnormal amounts of high-caloric food staffs as cake and cheeps potatoes was associated with significant increased risk for obesity in the present study.
This study has some limitations that should be mentioned. First of all, it ignores some important risk factors for overweight and obesity such as physical activity and family history of obesity and concentrating only on dietary factors alone. However, the main objective of the present study is estimation of the prevalence of obesity among primary school children in Taif and comparing boys with girls. Second, its cross-sectional design makes it difficult to sort out the causal relationships among variables studied. Despite that, it has an ultimate public health importance.
6. CONCLUSION
Overweight and obesity among primary school children in Taif city, Saudi Arabia is a public health problem affecting more than one-third of girls and almost one fifth of boys. It confirms the significant association between some unhealthy dietary habits and increase prevalence of childhood obesity such as excessive eating of high caloric food staffs such as cheeps potatoes as well as frequent intake of fast meals.
7. RECOMMENDATIONS
1- Health professionals and policy-makers should focus on primary prevention of childhood obesity, especially in areas with high prevalence aiming at controlling this growing epidemic.
AlGhamdi; JAMMR, 31(5): 1-21, 2019; Article no.JAMMR.52846
3- Establishment of a uniform and universally accepted set of criteria for defining overweight and obesity in children and adolescents should be the foundation for addressing this emerging public health concern.
4- Further study on a larger scale with focusing on all risk factors for childhood overweight and obesity (dietary, physical activity, family history, personal habits, etc…).
5- Supervision of food quality at both at home and school should be done and healthy diet should be advocated.
CONSENT AND ETHICAL APPROVAL
Permission from Joint Program of Family Medicine in Taif was obtained.
Permission of the education director in Taif was obtained.
All information was kept confidential and results will be submitted to the Ministry of Education in Taif as feedback.
We tried to follow the obese boys and girls and refer them to primary care centers.
DISCLAIMER
The products used for this research are commonly and predominantly use products in our area of research and country. There is absolutely no conflict of interest between the authors and producers of the products because we do not intend to use these products as an avenue for any litigation but for the advancement of knowledge. Also, the research was not funded by the producing company rather it was funded by personal efforts of the authors.
COMPETING INTERESTS
Author has declared that no competing interests exist.
REFERENCES
1. Gidding SS, Leibel RL, Daniels S, Rosenbaum M, Horn LV, Rmarx GR. Understanding obesity in youth. Circulation. 1996;94:3383-3387.
2. Stunkard A, Mendelson M. Obesity and the body image. I: Characteristics of disturbances in the body image of some obese persons. Am J Psychiatry. 1967;123:1296-1300.
3. Stunkard A, Burt V. Obesity and the body image. II: Age at onset of disturbances in the body image. Am J Psychiatry. 1967;123:1443-1447.
4. World Health Organization (WHO). Obesity: Preventing and managing the global epidemic. Report of a WHO consultation, Geneva. WHO; 1998.
5. Wilding J. Science, medicine, and the future: Obesity treatment. BMJ. 1997;315: 997-1000.
6. Willett WC, Manson JE, Stampfer MJ, Colditz GA, Rosner B, Speizer FE. Weight change and coronary heart disease in women: Risk within the ‘normal’ weight range. JAMA. 1995;273:461-465.
7. Al-Nuaim AR. Effect of overweight and obesity on glucose intolerance and dyslipidemia in Saudi Arabia, epidemiological study. Diabetes Res Clin Pract. 1997;36:181-191.
8. Ashton W, Nanchahal K, Wood D. Body mass index and metabolic risk factors for coronary heart disease in women. Eur Heart J. 2001;22:46-55.
9. Kordy MN, El-Gamal FM. A study of pattern of body mass index (BMI) and prevalence of obesity in a Saudi population. Asia Pac J Public Health. 1995;8:59-65.
10. Al-Isa AN. Changes in body mass index and prevalence of obesity among adult Kuwaiti women attending health clinics. Annals of Saudi Medicine. 1997;17:307-311.
11. Troiano RP, Flegal KM, Kuczmarski RJ, Campbell SM, Johnson CL. Overweight prevalence and trends for children and adolescents: The National Health Examination Surveys, 1963-1991. Arch Pediatr Adolesc Med. 1995;149:1085-1091.
12. Guo SS, Roche AF, Chumlea WC, Gradner JC, Siervogel RM. The predictive value of childhood body mass index values for overweight at age 35 years. Am J Clin Nutr. 1994;59:810-819.
13. Guo SS, Chumlea WC. Tracking of body mass index in children in relation to overweight adulthood. Am J Clin Nutr. 1999;70:145-148.
15. Al-Shammari SA, Khoja TA, Al-Maatouq MA, Al-Nuaim LA. High prevalence of clinical obesity among Saudi females: A prospective, cross-sectional study in the Riyadh region. J Trop Med Hyg. 1994;97: 183-188.
16. Al-Nuaim AR, Bamgboy EA, Al-Rubeaan KA, Al-Mazrou Y. Overweight and obesity in Saudi Arabian adult population; role of socio-demographic variables. J Community Health. 1997; 22:211-223.
17. El-Hazmi MA, Warsy AS. Prevalence of obesity in the Saudi population. Annals of Saudi Medicine. 1997;17:302-306.
18. Al-Nuaim AR, Al-Rubeaan KA, Al-Mazrou Y, Al-Attas O, Al-Daghari N, Khoja TA. High prevalence of overweight and obesity in Saudi Arabia. Int J Obes Relat Metab Disord. 1996;20: 547-552.
19. Al-Nuaim AR. Population-based epidemiological study of the prevalence of overweight and obesity in Saudi Arabia, regional variation. Ann Saudi Med. 1997;17(2):195-9.
20. Abalkhail B. Overweight and obesity among Saudi Arabian children and adolescents between 1994 and 2000. East Mediterr Health J. 2002;8(4-5):470-9. 21. Al Herbish AS, Al Jurayyan N, Olasope A,
Abdullah AM, Al Nuaim AA. Childhood obesity: Referred cases to a tertiary health center in Riyadh, Saudi Arabia. Saudi J Gastroenterol. 1999;5(2):85-8.
22. El-Hazmi MA, Warsy AS. The prevalence of obesity and overweight in 1-18 year-old Saudi children. Ann Saudi Med. 2002; 22(5-6):303-307.
23. Al-Rukban MO. Obesity among Saudi male adolescents in Riyadh, Saudi Arabia. Saudi Med J. 2003;24(1):27-33.
24. Khalid M. Is high-altitude environment a risk factor for childhood overweight and obesity in Saudi Arabia? Wilderness Environ Med. 2008;19(3):157-63.
25. Al-Shehri JA. Childhood obesity prevalence among primary schoolboys at Al-Iskan sector, Holy Makkah, Saudi Arabia. Int J Med Sci Public Health. 2014;3(2):150-155.
26. Lafta RK, Kadhim MJ. Childhood obesity in Iraq: Prevalence and possible risk factors. Ann Saudi Med. 2005;25(5):389-93. 27. Al-Haddad FH, Little BB, Abdul Ghafoor
AG. Childhood obesity in United Arab Emirates school children: A national study. Ann Hum Biol. 2005;32(1):72-9.
28. Sorkhou I, Al-Qallaf K, Al-Shamali N, Hajia A, Al-Qallaf B. Childhood obesity in Kuwait--prevalence and trends. Fam Med. 2003;35(7):463-4.
29. Badawi NE, Barakat AA, El Sherbini SA. Prevalence of overweight and obesity in primary school children in Port Said city. Egyptian Pediatric Association Gazette. 2013;61(1):31–36.
30. Singh GK, Kogan MD, van Dyck PC. Changes in state-specific childhood obesity and overweight prevalence in the United States from 2003 to 2007. Arch Pediatr Adolesc Med. 2010;164(7):598-607.
31. Yoshinaga M, Ichiki T, Tanaka Y, Hazeki D, Horigome H, Takahashi H, et al. Prevalence of childhood obesity from 1978 to 2007 in Japan. Pediatr Int. 2010;52(2): 213-7.
32. Muhihi AJ, Mpembeni RN, Njelekela MA, Anaeli A, Chillo O, Kubhoja S, et al. Prevalence and determinants of obesity among primary school children in Dar es Salaam, Tanzania. Arch Public Health. 2013;71(1):26.
33. Online Roasoft sample size calculator. Available:http://www.raosoft.com/samplesi ze.html
34. Al-Ghamdi SH. The association between watching television and obesity in children of school-age in Saudi Arabia. J Family Community Med. 2013;20(2)-83-89. 35. Kuczmarski RJ, Ogden CL,
Grummer-Strawn LM. CDC growth charts: United States. Adv Data. 2000;314:1–27.
36. al-Nuaim AR, Bamgboye EA, Al-Herbish A. The pattern of growth and obesity in Saudi Arabian male school children. Int J Obes Relat Metab Disord. 1996;20(11):1000- 5.
37. AL-Hazaa HM. Prevalence and trends in obesity among school boys in central Saudi Arabia between 1988 and 2005. Saudi Medical Journal. 2007;28(10):1569-1574.
38. Alam AA. Obesity among female school children in North West Riyadh in relation to affluent life style. Saudi Med J. 2008;29(8):1139-44.
39. Al Shehri A, Al Fattan A, Al Alwan I. Obesity among Saudi children. Saudi J Obesity. 2013;1:3-9.
AlGhamdi; JAMMR, 31(5): 1-21, 2019; Article no.JAMMR.52846
overweight and obesity among children and adolescents in Thessaloniki, Greece. Journal of Pediatric Endocrinology & Metabolism. 2001;14(Suppl.5):1319–1326. Discussion 1365.
41. Núñez-Rivas HP, Monge-Rojas R, León H, Roselló M. Prevalence of overweight and obesity among Costa Rican elementary school children. Revista Panamericana de Salud Publica. 2003;13:24–32.
42. Manzoli L, Ripari P, Rotolo S, Di Giacinto G, Bellomo RG, Sorgentone S, et al. Prevalenza di obesità, sovrapeso e ipertensione nei bambini e adolescenti della provincia di Pescara [Prevalence of obesity, overweight and hypertension in children and adolescents from Abruzzo, Italy]. Annali di igiene: medicina preventiva e di comunità. 2005;17:419–431.
43. Martínez Vizcaíno V, Salcedo Aguilar F, Franquelo Gutiérrez R, Torrijos Regidor R, Morant Sánchez A, Solera Martínez M, et al. Prevalencia de obesidad y tendencia de los factores de riesgo cardiovascular en escolares de 1992 a 2004: Estudio de Cuenca [Prevalence of obesity and trends in cardiovascular risk factors among Spanish school children, 1992–2004: The Cuenca (Spain) study]. Medicina Clínica. 2006;126:681–685.
44. Terrell DF. Overweight and obesity prevalence rates among youth in the Carolinas. North Carolina Medical Journal. 2002;63:281–286.
45. Hajian-Tilaki KO, Sajjadi P, Razavi A. Prevalence of overweight and obesity and associated risk factors in urban primary-school children in Babol, Islamic Republic of Iran. East Mediterr Health J. 2011;17(2): 109-14.
46. Sidhu S, Marwah G, Prabhjot. Prevalence of overweight and obesity among the affluent adolescent school children of Amritsar, Punjab. Collegium Antropologicum. 2005;29:53–55.
47. Oner N, Vatansever U, Sari A, Ekuklu E, Güzel A, Karasalihoğlu S, Boris NW. Prevalence of underweight, overweight and obesity in Turkish adolescents. Swiss Medical Weekly. 2004;134(35–36):529-533.
48. Zaini MZ, Lim CT, Low WY, Harun F. Factors affecting nutritional status of Malaysian primary school children. Asia-Pacific Journal of Public Health. 2005;17: 71-80.
49. Salane B, Karl S. Stabilisation of overweight prevalence in French children between 2000 and 2007. Int J Pediatr Obes. 2009;4(2):66-72.
50. Lamerz A. Social class, parental education and obesity prevalence in a study of six year children in Germany. Int J. Obes. 2005;29(4):377-80.
51. Fuiano. Prevalence and risk factor of overweight and obesity in a population of Italian school children: A longitudinal study. J Endocrinal Invest. 2008;31(11):979-84. 52. Disciqil G, Telcon N, Soylemz A. Obesity in
Turkish children and adolescents: Prevalence and non-nutritional correlates in an urban sample. Child Care Health Dev. 2009;35(2):153-8.
53. Martínez Vizcaíno V, Salcedo Aguilar F, Franquelo Gutiérrez R, Torrijos Regidor R, Morant Sánchez A, Solera Martínez M, et al. Prevalencia de obesidad y tendencia de los factores de riesgo cardiovascular en escolares de 1992 a 2004: Estudio de Cuenca [Prevalence of obesity and trends in cardiovascular risk factors among Spanish school children, 1992–2004: The Cuenca (Spain) study]. Medicina Clínica. 2006;126:681–685.
STUDENT DATA FORM
APPENDIX 1
CODE NUMBER: ( )
NAME:
AGE:
EDUCATION LEVEL :
PHESICAL SCALES:
HEIGHT: m WEIGHT: k.g
Consent Form
TO THE STUDENT PARENT / RESPECTEED
Because of the observed obesity phenomenon in our children and the consequent health and social damages affecting the psyche of these children, I was keen to do research and study aimed at determining the prevalence of obesity among children between the ages of 6-12 years in addition to its relationship to some eating habits and aspects Social, this is done only with your cooperation and encouragement.
Therefore, I ask you to fill out the questionnaire sent with the student accurately and clearly so that the study is realistic and benefit from the desired benefit, with the return with the student as soon as possible with assurance of the confidentiality of information recorded by you.
In case of inquiry you can contact me at the following number:
Mobile: 0500817684
Thank you for your sincere cooperation in the public interest.
Thank you very much.
Researcher Dr. RASHEED
THE FORM
1-Code number: ( )
Please kindly answer the questions clearly by placing an (√) in the appropriate box and filling in the spaces between the brackets:
2-Date of birth of the student: month ( ) years ( )
3- Study Stage: ( )
4-Student's weight at birth: ( ) small ( ) natural ( ) large
5-With whom the student lives:
AlGhamdi; JAMMR, 31(5): 1-21, 2019; Article no.JAMMR.52846
3( )with the mother only 4 ( ) someone else
Locate( )
6-Number of family members:( )
7-Number of male brothers ( ) & female sisters ( )
8-The order of the student among his brothers : ( )
9-mother's educational level:
1( ) do not read or write 2 ( ) primary
3( ) Intermediate 4 ( ) Secondary
5( ) University 6 ( ) Higher than University
10-The educational level of the father
1( ) do not read or write 2 ( ) primary
3( ) Intermediate 4 ( ) Secondary
5( ) University 6 ( ) Higher than University
11-Does the student have breakfast before going to school?
1 ( ) Always 2 ( ) Most of the time
3( )Sometimes 4( ) No
12-Does the student eat at school?
1 ( ) Always 2 ( ) Most of the time
3( )Sometimes 4( ) No
If the student is eating at school: at the student's normal rate
13-Does the student prefer milk: 1( ) Yes 2 ( ) No
14-Do you prefer strawberry juice: 1( ) Yes 2 ( ) No
15-Is it preferable to drink soft drinks: 1( ) Yes 2 ( ) No
16-Do you prefer potato chips: 1( ) Yes 2 ( ) No
17-Do you prefer chocolate / candy: 1( ) Yes 2 ( ) No
18-Do you prefer cake: 1( ) Yes 2 ( ) No
19-Do you prefer to eat cookies: 1( ) Yes 2 ( ) No
21-Do you prefer to eat fruits: 1( ) Yes 2 ( ) No
22-What are the meals that the student eat regularly (can choose more than one answer):
1( ) Breakfast 2( ) Lunch
3( )dinner 4( ) three meals
23- What is the rate of student eating vegetables per day (total vegetables per day such as a child eating 1 cucumber, 1 tomato and 1 carrot is considered 3 times):
1 ( ) twice or less 2 ( ) 3-5 times
3( ) more than 5 times
24-What is the rate of student eating fruits per day?
1 ( ) twice or less 2 ( ) 3-5 times
3( ) more than 5 times
25-Does the student eat between meals?
1( ) Always 2 ( ) Most of the time
3( ) Sometimes 4( ) No
If the student is eating between meals, in the normal range of the student:
26-Does the student prefer to drink juice: 1( ) Yes 2 ( ) No
27-Does the student prefer to drink soft drinks: 1( ) Yes 2 ( ) No
28-Does the student prefer chocolate / candy: 1( ) Yes 2 ( ) No
29-Does the student prefer to eat fruits: 1( ) Yes 2 ( ) No
30-Does the student prefer to eat French fries: 1( ) Yes 2 ( ) No
31-Does the student prefer biscuits: 1( ) Yes 2 ( ) No
32-Does the student prefer to eat chips: 1( ) Yes 2 ( ) No
33-Does the student prefer to eat the cake: 1( ) Yes 2 ( ) No
34-What is the rate of student eating fast food per week?
1( ) once 2( ) twice
AlGhamdi; JAMMR, 31(5): 1-21, 2019; Article no.JAMMR.52846
APPENDIX 3
_________________________________________________________________________________
© 2019 AlGhamdi; This is an Open Access article distributed under the terms of the Creative Commons Attribution License (http://creativecommons.org/licenses/by/4.0), which permits unrestricted use, distribution, and reproduction in any medium, provided the original work is properly cited.
Peer-review history: