Article
Experimental study of the summation of flicker
caused by wind turbines.
Koldo Redondo *, José Julio Gutiérrez , Izaskun Azcarate , Purificación Saiz , Luis Alberto Leturiondo and Sofía Ruiz de Gauna
University of the Basque Country (UPV/EHU) Department of Communications Engineering
Current address: Plaza Ingeniero Torres Quevedo 1 48013 - Bilbao - Spain * Correspondence: [email protected]; Tel.: +34 94 601 3901
Version May 21, 2019 submitted to Preprints
Abstract: Integration of wind energy into the grid faces a great challenge regarding power
1
quality. The International Electrotechnical Commission (IEC) 61400-21 standard defines the electrical
2
characteristics that need to be assessed in a Wind Turbine (WT), as well as the procedure to measure
3
the disturbances produced by the WT. One of the parameters to be assessed are voltage fluctuations
4
or flicker. To estimate the flicker emission of a Wind Power Plant (WPP), the standard establishes
5
that a quadratic exponent should be used in the summation of the flicker emission of each WT. This
6
exponent was selected based on studies carried out in WPPs with type I and II WTs. Advances in
7
wind turbines technology have reduced their flicker emission, mainly thaks to the implementation of
8
power electronics for the partial or total management of the power injected into the grid. This work
9
is based on measurements from a WPP with 16 type III WTs. The flicker emission of a single WT and
10
of the WPP were calculated. Low flicker emission values at the Point of Common Coupling (PCC) of
11
the WPP were obtained. The flicker estimation at the PCC, based on the measurement from a single
12
WT, was analyzed using different exponents. The results show that a cubic summation performs
13
better than the quadratic one in the estimation of the flicker emission of a WPP with type III WTs.
14
Keywords:Power Quality; Wind Power Plant; Voltage Fluctuations
15
1. Introduction 16
Wind energy represents an increasing proportion of the globally produced energy [1,2]. Power
17
quality control is required to not compromise the quality of the supply network with the integration
18
into the grid of this renewable source [3]. The International Electrotechnical Commission (IEC) 61400-21
19
standard defines the procedures for measuring and assessing the power quality in grid connected Wind
20
Turbines (WTs) [4]. The revision of the standard in force is being addressed within the Maintenance
21
Team TC88/MT21 of IEC, whose work will lead to the release of a new edition of the standard separated
22
in two parts: Part 1 for testing WTs, and Part 2 for testing Wind Power Plants (WPPs).
23
The quantities that shall be stated for characterizing the power quality of a single WT according to
24
the standard are: voltage fluctuations, current harmonics, interharmonics, high frequency components,
25
voltage drop response, power control (active and reactive power), grid protection and reconnection
26
time. The literature gathers several works about the measurement, modelling and control of these
27
disturbances and how to minimize their impact [5–7].
28
Voltage fluctuations or flicker are one of the electric characteristics most complex to assess. At
29
the time the first edition of the standard was defined [8], the vast majority of the installed WTs
30
were fixed speed turbines (type I), which presented flicker emission values well above the expected
31
regulatory limits [9]. However, with the use of variable speed WTs (type II) flicker emission values
32
were reduced [10–12]. Currently, new types of WTs implement flicker mitigation strategies with the
33
use of power electronic devices for the partial (type III) or complete (type IV) management of the
34
generated power. This has considerably reduced the flicker emission [12–14].
35
Despite the low flicker emission of an individual WT, it is of vital importance to accurately
36
estimate the impact of the aggregation of multiple WTs. The IEC 61000-3-7 standard defines a formula
37
to aggregate the flicker produced by different sources. The summation exponentαdepends on the
38
probability of occurrence of coincident fluctuations. The IEC 61400-21 standard specifies a quadratic
39
summation of each individual WT value to estimate the flicker emission of a WPP. The use of a
40
quadratic summation is based on the criteria established by the IEC 61000-3-7 standard [15], as well as
41
on studies performed before and during the definition of the IEC 61400-21 standard [9,10,16,17].
42
Many studies have been conducted to analyze the quadratic summation of the flicker emission
43
of WTs, based on fixed speed [9–11,16,18] or variable speed [10,11,16] WTs. Some of these studies
44
performed measurements on two WTs assuming that the set of both turbines could be represented as
45
the sum of the individual values [9,10,16]. Other works carried out measurements at different locations
46
in a WPP. In [11], measurements were performed at a WT and at the end of the string feeder the WT
47
was connected at; in [18], measurements were performed at a WT and the Point of Common Coupling
48
(PCC) of a WPP consisting of four WTs. In both studies, flicker emission values at the string feeder or
49
at the PCC were compared with the estimated ones obtained through the quadratic summation of the
50
values registered at the WT. From all those studies, [10] and [11] are the only ones implementing the
51
flicker measurement procedure of the IEC 61400-21 standard.
52
These studies reached different overall conclusions. On the one hand, [9], [10] and [16] corroborate
53
the adequacy of the quadratic summation to estimate the flicker emission of a group of WTs. On the
54
other hand, [18] shows important differences between the measured and estimated flicker emission
55
values. However, these divergences could come from the fact that background fluctuations at the
56
PCC of the WPP were not removed from the study. Finally, the results presented in [11] show that the
57
quadratic summation provides flicker emission values higher than the measurements performed at the
58
string feeder of the WPP.
59
In order to analyze the degree of correlation between voltage fluctuations produced by identical
60
WTs situated in nearby locations and working under similar wind conditions, the aim of this work was
61
twofold: to asses the flicker emission at the PCC of a WPP consisting of 16 WTs, and to analyze the
62
quadratic summation method to estimate WPP flicker emission based on the measurements of a single
63
WT. To that end, voltage and current waveforms were synchronously recorded at the terminals of a
64
single WT and at the PCC of a WPP located in Spain. The estimated and measured flicker emission
65
values were compared, and the exponent providing a better adjustment of the results was analyzed.
66
2. Flicker measurement procedure during continuous operation of WT 67
The IEC 61400-21 standard defines the flicker measurement and assessment procedure during
68
continuous operation of a WT. The Maintenance Team TC88/MT21 of IEC is currently working on
69
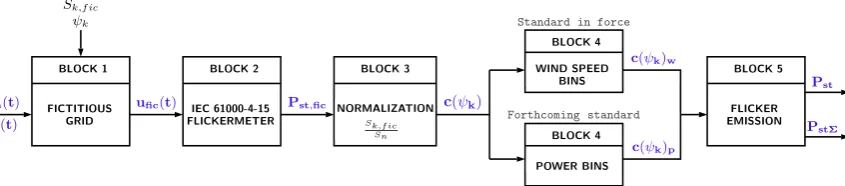
the modification of this procedure [19]. Figure1shows the block diagram of the flicker measurement
70
procedure of the standard in force, as well as of its forthcoming edition. Both procedures comprise
71
5 steps using the phase to neutral voltage and line current 10-min input signals recorded at the WT
72
terminals.
73
The difference between both procedures lies in the fourth block. The standard in force specifies
74
that each 10-min time-series has to be classified in wind speed bins according to the mean wind speed.
75
At least fifteen 10-min time-series of voltage and current measurements have to be collected for each 1
76
m/s wind speed bin, with bins going from a cut-in wind speed of usually 3 m/s to 15 m/s. In contrast,
77
the forthcoming edition of the standard establishes that each 10-min time series has to be classified
78
into power bins, according to the percentage rated power,Pn, of the WT. Moreover, eleven power bins
79
are specified as 0, 10, 20, . . . , 100% of thePn, being 0, 10, 20, ...., 100 the bin midpoints. In this case, at
80
least twenty one 10-min time-series are required for each power bin.
81
In Block 1 the interaction between the WT and an ideal grid free from voltage disturbances is
82
implemented through the fictitious grid represented in Figure2. The WT is modeled by means of
83
a current generator representing the line currentim(t)measured at the WT terminals. The grid is
3 of 12
um(t) im(t)
BLOCK 1
FICTITIOUS GRID
ufic(t) Sk,f ic
ψk
BLOCK 2
IEC 61000-4-15 FLICKERMETER
Pst,fic
BLOCK 3
NORMALIZATION Sk,fic
Sn
c(ψk)
BLOCK 4
WIND SPEED BINS
c(ψk)w
c(ψk)p
Standard in force
BLOCK 4
POWER BINS
Forthcoming standard
BLOCK 5
FLICKER EMISSION
Pst
PstΣ
Figure 1.Block diagram of the measurement and assessment procedure for flicker during continuous operation of a grid connected WT according to the IEC 61400-21 standard in force and its forthcoming edition.
− +
u
0(
t
)
R
f icL
f ici
m(
t
)
u
f ic(
t
)
Figure 2.Fictitious grid implemented in Block 1 of the IEC 61400-21 standard.
represented by an ideal voltage generatoru0(t)connected in series with a resistance Rf ic and an
85
inductanceLf ic. The ideal voltageu0(t)has to meet two requirements: it can not contain any voltage 86
fluctuations, and it shall have the same electrical angle as the voltageum(t) measured at the WT
87
terminals [20]. In this way, the fictitious voltage,uf ic(t), which characterizes the voltage fluctuations
88
produced exclusively by the WT, is obtained according to the following equation:
89
uf ic(t) =u0(t) +Rf ic·im(t) +Lf ic·
dim(t)
dt . (1)
Theuf ic(t)voltage should be obtained for four grid impedance values (Rf icandLf ic), determined by
90
four grid impedance phase angles (ψk= 30o, 50o, 70oy 85o) and for a specific Short-Circuit Ratio (SCR).
91
The SCR value represents the relation between the short-circuit apparent power of the fictitious grid,
92
Sk,f ic, and the rated apparent power of the WT,Sn. The standard specifies a SCR value between 20 and
93
50. Thus, fouruf ic(t)voltage signals are obtained for each 10-min time series input at the output of
94
Block 1.
95
Block 2 implements a class F1 IEC flickermeter according to the IEC 61000-4-15 standard [21],
96
obtaining a flicker severity value,Pst,f ic, for eachuf ic(t)voltage. In total, fourPst,f icvalues are obtained
97
for each 10-min time series, one for eachψkvalue.
98
The flicker coefficient c(ψk) is obtained in Block 3 by normalizing the Pst,f ic value with the
99
following equation:
100
c(ψk) =Pst,f ic·SCR. (2)
According to the standard in force, Block 4 weights the flicker coefficientsc(ψk)of the whole set
101
of 10-min time-series using four annual average wind speed values. Then, the 99th percentile of each
102
distribution is reported, yielding 16 flicker coefficientsc(ψk)w. In contrast, the forthcoming edition
103
of the standard would require the 95th percentile of the flicker coefficients for each power bin [22],
104
reporting the worst case flicker coefficientc(ψk)pfor eachψkvalue.
105
Based on these reported values, Block 5 estimates the flicker emission from a single WT at the
106
PCC as follows:
b
b b b
b b b
b b b
b b b
b
b b
L1
L2
GRID LV (690 V)
MV (20 kV) HV (132 kV)
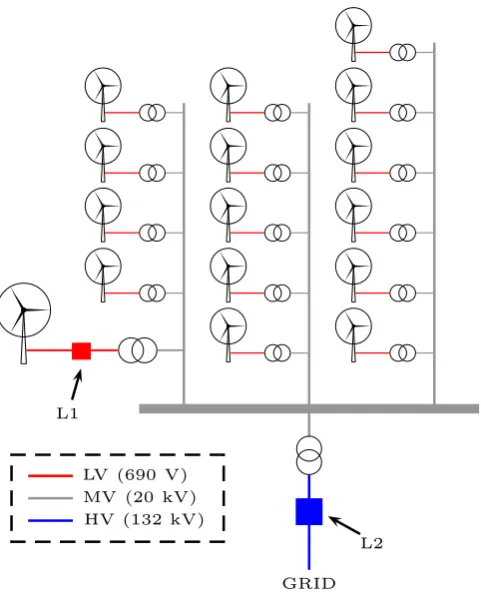
Figure 3.Illustration of the electrical layout of the WPP.
Pst =c(ψk)·
Sn
Sk
, (3)
whereψk is the grid impedance phase angle at the PCC andSkis the short-circuit apparent power
108
at the PCC. In caseψkis not one of the values defined by the standard, a linear interpolation of the
109
reported values is suggested to obtain thec(ψk)value.
110
Finally, the standard determines that the flicker emission of a group of WTs at the PCC could be
111
estimated as follows:
112
Pst,Σ= S1
k
· v u u t
Nwt
∑
i=1
(ci(ψk)·Sn,i)2, (4)
whereNwtis the total number of WTs,ci(ψk)is the individual flicker coefficient of each WT andSn,i
113
the rated apparent power of each WT.
114
3. Data collection 115
This work is based on a large database of real voltage and current waveforms recorded at a 32 MW
116
WPP located in Spain. The WPP is distributed into three strings, comprising a total of 16 Type III 2 MW
117
WTs disposed as shown in Figure3.
118
Each WT is a pitch regulated, upwind WT with active yaw, three-blade rotor and a high-efficiency
119
4-pole doubly fed generator with wound rotor and slip rings. The WT has a rated current of 1500 A
120
and 690 V of nominal voltage.
121
Voltage and current GPS-synchronized measurements were performed at two different locations
122
of the WPP: on the low voltage side (690 V) at the terminals of one WT (L1 in Figure3), and on the
123
high voltage side (132 kV) at the PCC of the WPP (L2 in Figure3). During the month and a half long
5 of 12 PSfrag replacements 137 128 115 163 172 248 344 405 533 751 215 1 0 -m in ti m e-se ri es
WT power bin (% Pn)
100 90 80 70 60 50 40 30 20 10 0 0 200 400 600 800 1000 1200 (a) PSfrag replacements 36 160 106 90 144 226 277 416 557 819 380 1 0 -m in ti m e-se ri es
WPP power bin (% Pn)
100 90 80 70 60 50 40 30 20 10 0 0 200 400 600 800 1000 1200 (b)
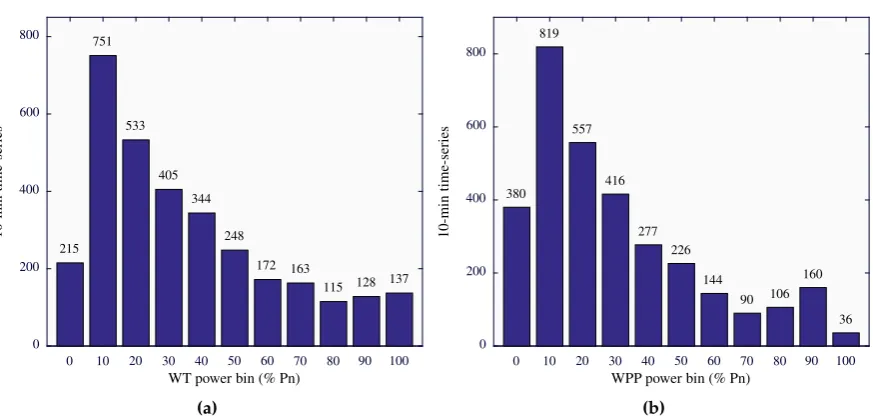
Figure 4.Power distribution of the selected 10-min time-series. (a) Time-series recorded at L1 with respect to the power bin of the WT (2 MW). (b) Time-series recorded at L2 with respect to the power bin of the WPP (32 MW).
measurement campaign, a total of 4914 10-min time-series were recorded at each location. For each
125
time-series the operational status of the 16 WTs was annotated and the active power at both locations
126
was calculated. After removing those time-series containing switching operations of the WT, and
127
after discarding the time-series in which not all the WTs were working, a total number of 3211 10-min
128
time-series were selected for the study database. Figure4(a) shows the histogram of the time-series
129
power at L1, with respect to thePnof the WT (2 MW), whereas Figure4(b) shows the histogram of the
130
time-series power at L2, with respect to thePnof the WPP (32 MW).
131
4. Results 132
Based on the selected 3211 time-series, flicker emission values were calculated at the PCC in two
133
ways: first, using the recordings from L1 and following the equation (4); second, using the recordings
134
from L2 and directly calculating the flicker emission. For that purpose, the impedance at the PCC was
135
measured, providing a value ofZ=6.581|87.34o. Finally, both results were compared.
136
4.1. Estimation of the flicker emission at the PCC according to IEC 61400-21 standard 137
Using the voltage and current time-series recorded at L1, thePst of the WT at the PCC was
138
calculated. To that end, equation (3) of the IEC 61400-21 procedure was applied, the measuredSk
139
value at the PCC being 2700MVA. Using thesePstvalues the flicker summation,Pst,Σ, was estimated 140
following equation (4). This equation can be simplified toPst,Σ= √
16·Pst, considering that, in the
141
selected time-series, the 16 WTs were simultaneously working. Figure5represents the median, 95th
142
and 99thpercentiles of the distribution ofPst,Σvalues for eachψk. The maximum values were obtained
143
for angles between 40oand 60o. The medians ofPst,Σdistributions ranged between 0.0094 and 0.0118. 144
For the particular case ofψk= 87.34o, the complete distribution is represented by means of a boxplot
145
in Figure5. The edges of the blue box represent the 25thand 75thpercentiles, and the black dashed
146
whiskers extend to the minimum and maximum values.
147
Figure6shows, for the case ofψk= 87.34oand using boxplots, the distribution ofPst,Σvalues for 148
each power bin of the WT. The central solid horizontal red line in each box is the median and the red
149
crosses represent the outliers of the distributions. Black circles represent the 95thpercentile for each
150
power bin. According to the standard, these values are those to be reported as the flicker emission for
151
each bin.
Median 95th 99th
PSfrag replacements
x10−3
Ps
t
,Σ
impedance phase angleψk(degrees)
90 85 80 70
60 50
40 30
20 10
2 3 4 5 6 7
8 9 10 11 12 13 14 15
Figure 5.Statistics of the estimatedPst,Σvalues at the PCC with respect to theψkvalues: median (red asterisks), 95thpercentile (blue circles) and 99thpercentile (black squares). A boxplot is depicted to represent the distribution for the particular case ofψk= 87.34o.
PSfrag replacements x10−3
Ps
t
,
Σ
WT power bins (%)
100 90 80 70 60 50 40 30 20 10 0 2
3 4 5 6 7
8 9 10 11 12 13 14
15
16Figure 6.For aψkvalue of 87.34
o, boxplots of the estimatedP
st,Σvalues at the PCC with respect to the
power bin of the WT (2 MW).
The lowestPst,Σvalues were obtained between the 30% and 60% power bins. For the lowest 153
power bins (0-20%) intermediatePst,Σvalues were observed. Between the 70% and 100% power bins
154
Pst,Σvalues increased as the power bin increased. Maximum values were registered between the 90% 155
and 100% power bins. The maximum 95thpercentile was 0.0133, obtained for the 100% power bin
156
whose median value is 0.0126.
157
4.2. Measurement of the flicker emission at the PCC 158
Using the voltage and current time-series recorded at L2, thePst,L2values at the PCC of the WPP 159
were obtained. The direct way to obtain the flicker emission at the PCC is to analyze the registered
160
voltage using the IEC flickermeter. However, this procedure does not distinguish between the flicker
161
emission of the WPP and the background voltage fluctuations present at that measurement point in
162
the grid. Therefore, similarly to what the IEC 61400-21 standard establishes, the flicker emission at the
163
PCC exclusively produced by the WPP was obtained by means of a model representing the interaction
164
between the WPP and the Thevenin’s equivalent circuit of the grid. In this case, the current source
7 of 12
PSfrag replacements x10−3
Ps
t
,
L
2
WPP power bins (%)
100 90 80 70 60 50 40 30 20 10 0 1
2
3 4 5 6 7 8 9 10 11
12 13 14
Figure 7. For aψkvalue of 87.34o, boxplots of the measuredPst,L2values at the PCC (16 WTs) with
respect to the power bin of the WPP (32 MW).
represents the current injected by the WPP whose value corresponds to the current registered at L2.
166
For the Thevenin impedance the known value ofZ=6.581|87.34owas used.
167
Figure7depicts, the distributions of the measuredPst,L2values for each power bin of the WPP. 168
The obtained values ranged between 0.0033 and 0.0100, showing the low flicker emission level of the
169
WPP. Excluding outliers, the measuredPst,L2values increased as the generated power of the WPP 170
increased from the lowest to the 90% power bin. At this latter power bin the maximum values were
171
reached. The 100% power bin presented a very low dispersion and lowerPst,L2values compared to 172
the 90% power bin. It is important to note that the 100% power bin represents the situation at which
173
all the WTs of the WPP are working at around the 100% of their power. This implies that the flicker
174
generation of each WT will be practically the same and, therefore, the measured flicker values should
175
be similar.
176
4.3. Comparison between the estimated and measured flicker emission at the PCC 177
The comparison between the estimatedPst,Σand measuredPst,L2values at the PCC was performed 178
using the results obtained for aψkangle of 87.34o. Overall, the measuredPst,L2values were lower than 179
the estimated ones. This proves that the standard overestimates the flicker emission of the whole WPP.
180
When comparing the corresponding individual time-series at L1 and L2, large deviations were
181
obtained between the measured and estimated flicker emission values. Figure8(a) depicts the estimated
182
flicker values versus the measured ones. The results obtained for the time-series grouped between the
183
0 and 30% power bins are represented in black color, whereas the ones corresponding to power bins
184
between 40% and 100% are represented in red. Figure8(b) represents, using boxplots, the distributions
185
of the percentage deviation between the estimatedPst,Σand measuredPst,L2values, calculated as: 186
∆Pst,Σ=
Pst,Σ−Pst,L2
Pst,L2 . (5)
From left to right, the results correspond to the time-series grouped between the 0-30%, 40-100% and
187
those at the 100% power bin, respectively.
188
In Figure8(a) two different trends can be distinguished between 0-30% and 40-100% power bins.
189
Moreover, there is a poor correlation between the obtained results and the dashed black line which
190
represents the ideal situation at which the estimated and measured values are identical. However,
191
if only the time-series classified between 40-100% power bins are considered, a similar slope is
192
appreciated between the obtained results and the reference values.
bins 0-30%
bins 40-100%
reference adjustment
PSfrag replacements
x10−3
x10−3
Ps
t
,
Σ
Pst,L2
11 10 9 8 7 6 5 4 3 2 2
3 4 5 6
7 8 9 10 11 12 13 14
(a)
PSfrag replacements
∆
Ps
t
,
Σ
(%
)
10-min time-series
bin 100% bins 40-100%
bins 0-30% 0
50 100 150 200 250
300
(b)
Figure 8.Deviation between the estimatedPst,Σand measuredPst,L2values at the PCC. (a) Estimated
versus measured results, obtained with the time-series classified between the power bins 0-30% (in black) and between 40-100% (in red). (b) Boxplots of the percentage deviation between the estimated
Pst,Σand the measuredPst,L2values.
Figure8(b) shows large deviations between the estimated and measured values. For the particular
194
case of the results obtained for 0-30% power bins, half of the deviations were higher than 113%, with
195
a maximum deviation of 265%. On the other hand, for the time-series corresponding to power bins
196
between 40% and 100%, half of the deviations were greater than 57%, with a maximum deviation
197
of 100%. Considering only the time-series grouped at the 100% power bin, the deviations were
198
concentrated around the 59%, showing a very low dispersion.
199
4.4. Summation exponent effect 200
When aggregating different flicker sources according to [15] an exponent,α, is used. The value
201
ofαdepends on the probability of occurrence of coincident fluctuations. Exponentsα=1, 2, and 3
202
represent high, medium and low probability of occurrence, respectively, whereasα=4 represents
203
the null probability of coincident fluctuations. Currently, the IEC 61400-21 standard in force defines
204
a quadratic summation to estimate the flicker caused by a whole WPP. This is because the WTs are
205
considered stochastic uncorrelated noise sources of flicker, and therefore present a medium probability
206
of occurrence of coincident fluctuations [17]. However, the effect of the exponent was studied in view
207
of the existing deviations.
208
First, the summation exponents providing the estimatedPst,Σvalues that best fit the measured
209
Pst,L2values,αb f, have been obtained for each time-series. Table1shows, for each power bin, the
210
median and interquartile range (IQR) of theαb f. The IQR is represented showing the 25thand 75th
211
percentiles in brackets, providing a measure of the dispersion of the values. The median of the
212
exponents ranged between 2.75 and 8.50. For the case of power bins between 0 and 20%, theαb f values
213
presented a larger dispersion than for the rest of the bins. The 100% power bin presented the lowest
214
dispersion. Overall, for the time-series grouped in 40-100% power bins, the medians ofαb f values are
215
around 3.
216
Second, the estimatedPst,Σvalues were obtained usingαvalues between 2 and 4 in steps of 0.1.
217
Figure9shows the mean of∆Pst,Σwith respect to theαused in the estimation. The time-series grouped
9 of 12
Table 1.Statistics of the obtained best fitting exponents,αb f, at each power bin of the WPP.
Best fitting exponent
Bin median IQR
0% 8.50 (7.62 - 9.91) 10% 6.23 (5.44 - 7.16) 20% 3.94 (3.70 - 4.19) 30% 3.41 (3.32 - 3.52) 40% 3.16 (3.03 - 3.28) 50% 2.97 (2.87 - 3.07) 60% 2.77 (2.66 - 2.85) 70% 2.75 (2.65 - 2.90) 80% 2.79 (2.60 - 2.85) 90% 2.86 (2.74 - 2.98) 100% 3.00 (2.94 - 3.05)
mean value of bins 40-100% mean value of bin 100% PSfrag replacements
∆
Ps
t,
Σ
(%
)
summation exponent (α)
4 3.9 3.8 3.7 3.6 3.5 3.4 3.3 3.2 3.1 3 2.9 2.8 2.7 2.6 2.5 2.4 2.3 2.2 2.1 2 0 10 20 30 40 50 60
Figure 9.Mean of percentage deviations between the estimatedPst,Σand measuredPst,L2values with
respect toαfor the time-series grouped between the 40% and 100% power bins (red circles), and for the
time-series grouped at 100% power bin (blue asterisk).
in the range of 40-100% power bins are represented by red circles, and the ones grouped at the 100%
219
power bin by blue asterisks. The lowest mean deviations were given with α = 3, for both sets of
220
time-series.
221
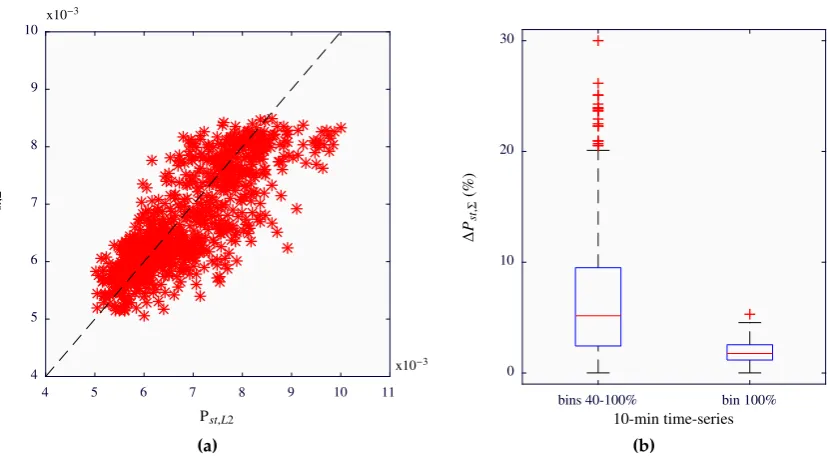
Third, Figure10shows the obtained deviations between the estimated and measured flicker
222
values for the case ofα=3. There is a better agreement between the estimated and the measured values
223
for the time-series grouped between the 40% and 100% power bins. For this set of time-series the
224
deviations decreased to less than 10% for the 75% of the values. In the case of the 100% power bin all
225
deviations were below 5%.
226
Finally, the 95thpercentile of the measured flicker emission value at the PCC of the WPP was
227
Pst,L2= 0.0082. According to the standard, withα=2, the estimated flicker emission of the WPP at the
228
PCC wasPst,Σ= 0.0133, based on the maximum 95thpercentile of each power bin. This estimated value 229
presented a deviation of 62% with respect to the measured flicker emission. However, ifα=3 is used,
230
an estimated flicker emission ofPst,Σ= 0.0084 was obtained, with a deviation of only 2%. 231
5. Discussion and conclusions 232
Technological advances in the wind power sector have reduced considerably the flicker emission
233
of WTs [10–14]. The implementation of power control methods in modern WTs leads to the reduction
234
of voltage fluctuations [13,23]. These methods reduce the power fluctuations injected to the grid, and
PSfrag replacements
x10−3
x10−3
Ps
t
,
Σ
Pst,L2
11 10 9 8 7 6 5 4 4 5 6 7 8 9 10
(a)
PSfrag replacements
∆
Ps
t
,
Σ
(%
)
10-min time-series bin 100% bins 40-100%
0 10 20 30
40
(b)
Figure 10.Deviation between the estimatedPst,Σand measuredPst,L2values at the PCC, forα=3. (a)
Estimated versus measured results, obtained with the time-series classified between the power bins 40-100%. (b) Boxplots of the percentage deviation between the estimatedPst,Σand the measuredPst,L2
values.
hence also the flicker emission. As an example, the 99thpercentile of the flicker coefficientsc(85o) 236
reported in [12] were 5.8, 3.8 and 2.5 for WTs of types I, II and IV, respectively. The reduction in
237
flicker emission of these new WTs leads to think about the flicker contribution of a WPP at the PCC.
238
Considering the 32 MW WPP of the study, the 95thpercentile of the flicker severity measured on the
239
voltage signal at the PCC wasPst = 0.2572, whereas the 95thpercentile of the flicker values emitted
240
exclusively by the WPP at the PCC was only 0.0082. Therefore, this WPP contributes with the 3.19% of
241
the total flicker severity value present at the PCC. The obtained low flicker values could support that
242
flicker measurement is not necessary. However, the flicker emission of a WPP depends on the strength
243
of the grid. Thus, the same WPP will present higher or lower flicker emission values depending on the
244
short-circuit apparent power,Sk, at the PCC.
245
On the other hand, the IEC 61400-21 standard establishes that the estimation of the flicker emission
246
of a group of WTs can be estimated by means of the quadratic summation of each single flicker value
247
of each WT. The summation exponentα=2 should be used to aggregate flicker sources that present
248
moderate probability of coincident fluctuations [15]. All the studies that helped to define the standard,
249
and those that later corroborated its validity, were based on measurements carried out at type I or
250
II WTs. However, the results obtained in this work suggest that the flicker aggregation in a WPP
251
with type III WTs should not be quadratic, but cubic. Type I and II WTs present a flicker emission
252
characteristic directly related to the wind speed: power fluctuations caused by variations in the wind
253
speed, are the ones producing flicker emission. Understandably, the effect of the wind is similar in WTs
254
situated in nearby locations, presenting a moderate probability of generating coincident fluctuations
255
between the WTs. However, type III and IV WTs implement power control systems based on power
256
electronics, which manage the total or partial power injection into the grid. Such power management
257
systems minimize the direct effect of wind fluctuations on the generated power. In fact, the flicker
258
emission characteristic of these types of WTs remains almost constant regardless of the wind speed.
259
Therefore, it seems also reasonable that with these type of WTs the probability of presenting coincident
260
fluctuations is lower than with type I or II WTs. According to [15], an exponent of 3 should be used
261
to aggregate flicker sources with low probability of coincident fluctuations. Moreover,α=3 is the
11 of 12
exponent proposed by the IEC 61000-3-7 standard for general use when additional information is not
263
available to justify a different value.
264
More studies covering different configurations of WPPs with different types of WTs are needed
265
to confirm the results of this work. In any case, a revision of the flicker summation law currently
266
proposed by the standard is warranted.
267
Author Contributions: K. Redondo have performed the experimental activity and the data processing; J.J. 268
Gutiérrez have contributed in the conceptualization of the study; K. Redondo, J.J. Gutierrez, I. Azcarate, P. Sáiz 269
and L.A. Leturiondo have carried out the data acquisition in the WPP; K. Redondo and I. Azcarate have prepared 270
the first draft of the manuscript; J.J. Gutiérrez, I. Azcarate, P. Saiz and S. Ruiz de Gauna have reviewed and edited 271
the manuscript. All the authors have approved the submitted version of this manuscript. 272
Funding:This research was funded by Basque Government (Basque Country, Spain) through the project IT1087-16 273
and by the Spanish MINECO through project DPI2014-53317-R (co-financed with European FEDER funds). 274
Conflicts of Interest:The authors declare no conflict of interest. 275
Abbreviations 276
The following abbreviations are used in this manuscript: 277
278
GPS Global Positioning System
IEC International Electrotechnical Commission IQR Interquartile range
PCC Point of Common Coupling PQ Power Quality
SCR Short-Circuit Ratio WPP Wind Power Plant WT Wind Turbine 279
280
1. GWEC. Global wind report - Annual market update 2017. Technical report, Global Wind Energy Council, 281
2018. 282
2. GWEC. Global wind energy outlook 2016. Technical report, Global Wind Energy Council, 2016. 283
3. Liang, X. Emerging Power Quality Challenges Due to Integration of Renewable Energy Sources. IEEE
284
Transactions on Industry Applications2017,53, 855–866. doi:10.1109/TIA.2016.2626253.
285
4. IEC 61400-21:2008 - Wind turbines - Part 21: Measurement and assesment of power quality characteristics of grid
286
connected wind turbines, 2 ed., 2008.
287
5. Abubakar, U.; Mekhilef, S.; Mokhlis, H.; Seyedmahmoudian, M.; Horan, B.; Stojcevski, A.; Bassi, 288
H.; Hosin Rawa, M.J. Transient Faults in Wind Energy Conversion Systems: Analysis, Modelling 289
Methodologies and Remedies. Energies2018,11, 2249. doi:10.3390/en11092249. 290
6. García, H.; Segundo, J.; Rodríguez-Hernández, O.; Campos-Amezcua, R.; Jaramillo, O. Harmonic 291
Modelling of the Wind Turbine Induction Generator for Dynamic Analysis of Power Quality.Energies2018, 292
11, 104. doi:10.3390/en11010104. 293
7. Sellami, T.; Berriri, H.; Jelassi, S.; Darcherif, A.M.; Mimouni, M.F. Short-Circuit Fault Tolerant Control of 294
a Wind Turbine Driven Induction Generator Based on Sliding Mode Observers. Energies2017,10, 1611. 295
doi:10.3390/en10101611. 296
8. IEC 61400-21:2001 - Wind Turbine Generator Systems - Part21: Measurement and Assessment of Power Quality
297
Characteristics of Grid Connected Wind Turbines, 1 ed., 2001.
298
9. Sorensen, P.; Tande, J.O.; Sondergaard, L.; Kledal, J.D. Flicker Emission Levels from Wind Turbines. Wind
299
Engineering1996,20, 39–46.
300
10. Larsson, A. Flicker emission of wind turbines during continuous operation. Energy Conversion, IEEE
301
Transactions on2002,17, 114–118.
302
11. Barahona, B.; Sorensen, P.; Christensen, L.; Sorensen, T.; Nielsen, H.; Larsen, X. Validation of the Standard 303
Method for Assessing Flicker From Wind Turbines. Energy Conversion, IEEE Transactions on2011,26, 373 304
12. Christensen, L.; Sorensen, P.; Sorensen, T., T.; Nielsen, H. Evaluation of Measuring Methods for Flicker 306
Emission from Modern Wind Turbine; AEE: Madrid, Spain, 2009. 307
13. Ammar, M.; Joos, G. Impact of Distributed Wind Generators Reactive Power Behavior on Flicker Severity. 308
IEEE Transactions on Energy Conversion2013,28, 425–433. doi:10.1109/TEC.2013.2256425.
309
14. Chen, Z.; Guerrero, J.; Blaabjerg, F. A Review of the State of the Art of Power Electronics for Wind Turbines. 310
IEEE Transactions on Power Electronics2009,24, 1859–1875. doi:10.1109/TPEL.2009.2017082.
311
15. IEC 61000-3-7:2008 - Electromagnetic compatibility (EMC) - Part 3-7: Limits - Assessment of emission limits for
312
the connection of fluctuating installations to MV, HV and EHV power systems, 2 ed., 2008.
313
16. Sorensen, P.; Pedersen, T.F.; Gerdes, G.; Klosse, R.; Santjer, F.; Robertson, N.; Davy, W.; Koulouvari, M.; 314
Morfiadakis, E.; Larsson, A. European Wind Turbine Testing Procedure Developments Task 2: Power 315
Quality. Technical Report, Riso National Laboratory, Denmark, 2001. 316
17. Sorensen, P. Methods for calculation of the flicker contributions from wind turbines. Technical Report 317
Riso-I-939(EN), Riso National Laboratory, Roskilde, Denmark, 1995. 318
18. Thiringer, T.; Petru, T.; Lundberg, S. Flicker Contribution From Wind Turbine Installations. IEEE
319
Transactions on Energy Conversion2004,19, 157–163. doi:10.1109/TEC.2003.816604.
320
19. Andresen, B.; Sørensen, P.; Santjer, F.; Niiranen, J. Overview, status and outline of the new revision for 321
the IEC 61400-21 – Measurement and assessment of power quality characteristics of grid connected wind 322
turbines. 12th Int. Workshop on Large-Scale Integr. of Wind Power into Power Syst., 2013. 323
20. Redondo, K.; Lazkano, A.; Saiz, P.; Gutierrez, J.J.; Azcarate, I.; Leturiondo, L.A. A strategy for improving 324
the accuracy of flicker emission measurement from wind turbines. Electric Power Systems Research2016, 325
133, 12–19. doi:10.1016/j.epsr.2015.11.040. 326
21. IEC 61000-4-15 - International Electrotechnical Commission. Electromagnetic Compatibility (EMC) - Part 4:
327
Testing and Measurements Techniques - Section 15: Flickermeter Functional and Desing Specifications, 2 ed., 2010.
328
22. Lazkano, A.; Redondo, K.; Gutierrez, J.; Saiz, P.; Leturiondo, L.; Azkarate, I. Revision of the 329
standard method for statistical evaluation of flicker coefficients in wind turbines. 2014 IEEE 330
16th International Conference on Harmonics and Quality of Power (ICHQP), 2014, pp. 258–262. 331
doi:10.1109/ICHQP.2014.6842745. 332
23. She, X.; Huang, A.; Wang, F.; Burgos, R. Wind Energy System With Integrated Functions of Active Power 333
Transfer, Reactive Power Compensation, and Voltage Conversion.IEEE Transactions on Industrial Electronics
334