Department of CSE, ECE & EEE, Magna College of Engineering, Chennai-600055, India.
Multiview Relational Data for Tensor
Clustering
1
D.Bebina,
2J.Josphin Surya,
3S.Jenibha &
4C.Jasmine Kethshial
1UG Student, Department of CSE, Rajas Engineering College, Vadakkangulam, India,2UG Student, Department of CSE, Rajas Engineering College, Vadakkangulam, India,
3UG Student, Department of CSE, Rajas Engineering College, Vadakkangulam, India
4UG Student, Department of CSE, Rajas Engineering College, Vadakkangulam, India
ABSTRAC: In most approach, homogeneous data sources shares the same set of object features. These object features can
be computed by using the spectral clustering method. In the spectral clustering of single view data, use the analysis based on a matrix. In the proposed system by using tensor method integrating heterogeneous data sources that shares the same set of object features as well as different set of object features. These object features can be computed by using multiview spectral clustering method. Here the multiview data can be considered as a tensor. This method includes two multiview clustering algorithms. That is multiview clustering based on the integration in the Frobenius-norm objective function and that based on matrix integration in the Frobenius-norm objective function. These two formulations can be computed by using tensor decomposition method. The main goal of multiview spectral clustering is to find a joint optimal subspace. The challenge of this method is to investigate other alternative solution is INDSCAL. It is efficient for scalable application in tensor decomposition method. The main goal of this INDSCAL is to find joint optimal latent subspace. It is also used for real time applications and multiview learning tasks.
KEYWORDS: Multiview Clustering, Tensor decomposition, Spectral analysis, Singular value decomposition.
1. INTRODUCTION
IN many real-world scenarios, each object can be described by multiple sets of features. For example, in scientific literature mining, both the textual content and the citation link between articles are often used in the knowledge discovery processes [25]. In many real-world scenarios, each object can be described by multiple sets of features. For example, in scientific literature mining, both the textual content and the citation link between articles are often used in the knowledge discovery processes [1]. In multiplex network analysis, we are given a set of multiple networks that share the same set of nodes but possess network-specific links representing different types of relationships between nodes [2]. A particular instance of this scenario is the social network of university students, which may include symmetrised connections from
1. Face book friendship, 2. Picture friendship, 3. Roommate relations, and
4. Student housing-group preference.
Department of CSE, ECE & EEE, Magna College of Engineering, Chennai-600055, India.
objective function OI) and that based on matrix integration in the Frobenius-norm objective function (MC-FR-MI). In particular, MC-FR-MI can assign each view a suitable weight to boost the clustering. For each strategy, we provide the relevant tensor-based solutions. Similar to other variants of principal component analysis (PCA) in machine learning applications [6], our strategy can be considered as a multiview PCA analysis.
II. RELATED WORK
2.1 Multiview Learning
Multiview clustering refers to the clustering of the same set of objects with multiview features, either from various information sources or from different feature representations. Multiview learning occurs in many other situations. In scientific publication classification, build a citation network over the articles, where each node indicates an article, and each directed link a citation from one article to another. Moreover, these methods also build a coauthor network over the articles, where there is a link between two articles if they have an author in common [7]. In social network analysis, there are multiple types of relationships among individuals. For example, they can be email networks, organization hierarchy, collaboration and so on. As in web categorization, for clustering or classifying scientific publications or individuals.
2.2 kernel Method
Kernel Methods for Data Fusion Given multiple related data sets , each kernel function produces, for the yeast genome, a square matrix in which each entry encodes a particular notion of similarity of one yeast protein to another. Implicitly, each matrix also denotes an embedding of the proteins in a feature space. Thus, the kernel representation casts heterogeneous data variable length amino acid strings, real valued gene expression data, a graph of protein- protein interaction into the common format of kernel matrices. Kernel methods work by embedding data items into a vector space F, called a feature space, and searching for linear relations in such a space. This embedding is defined implicitly, by specifying an inner product for the feature space via a positive semi definite embeddings of data items x1 and x2. Note that
if all we require in order to find those linear relations are inner products, then we do not need to have an explicit representation of the mapping , nor do we even need to know the nature of the feature space. It suffices to be able to evaluate the kernel function, which is often much easier than computing the coordinates of the points explicitly. Evaluating the kernel on all pairs of data points yields a symmetric, positive semi definite matrix K known as the kernel matrix, which can be regarded as a matrix of generalized similarity measures among the data points
2.3 Vector Space Model
In several applications, a variety of clustering’s for the objects under consideration may already exist, and one desires to either integrate these clustering’s into a single solution, or use this information to influence a new clustering (perhaps based on a different set of features) of these objects. Our reset encounter with this application scenario was when clustering visitors to an e-tailing website based on market basket analysis, in order to facilitate a direct marketing campaign. The company already had a variety of legacy customer segmentations based on demographics, credit rating, and geographical region and purchasing pattern.
III. SPECTRAL ANALYSES
Department of CSE, ECE & EEE, Magna College of Engineering, Chennai-600055, India.
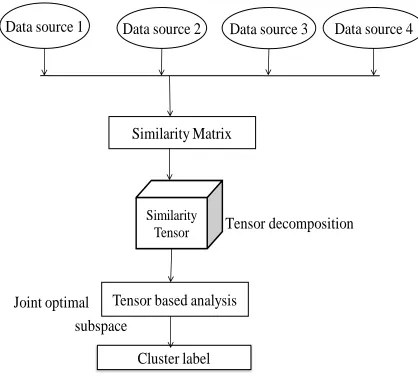
Tensor decomposition
Joint optimal subspace
Data source 1 Data source 2 Data source 3 Data source 4
Similarity Matrix
Cluster label
Similarity
Tensor
Tensor based analysis
Fig. 1 Multiview spectral clustering technique
Spectral graph partitioning has also been applied to a special case of multi-type relational data, bi-type relational data such as the word-document data (Dhillon, 2001; H.Zha&H.Simon,).These algorithms formulate the data matrix as a bipartite graph and seek to find the optimal normalized cut for the graph. Due to the nature of a bipartite graph, these algorithms have the restriction that the cluster from different types of objects must have one-to one associations.
3.1 Similarity Matrix
A similarity matrix is a matrix of scores which express the similarity between two data points. The similarity matrix is provided as an input and consists of a quantitative assessment of the relative similarity of each pair of points in the dataset. Given a set of N data points, where the data point, a similarity sin can be defined for each pair off data point’s xi and xj
based on some similarity measure. Similarity measure is symmetric, and the graph is un directed. The affinity matrix of the graph G is the matrix S with entry in row i and column j equal to Sij. The degree of the vertex vi, defined as
di= 𝑁𝑗 =1𝑆ij (1)
is the sum of all the weights of edges connected to vi. The degree matrix D is a diagonal matrix containing the vertex degrees d1...dN diagonal. Similarity is measured between two individuals in the sample, with the similarity matrix being
formed by combining this information for all pairs of individuals. For many measures, the similarity between pairs of individuals is not just dependent on their own genetic composition but also of that of the rest of the sample.It follows from the spectral embedding formalism that the Laplacian matrix is defined as S, and the normalized Laplacian matrix, corresponding to the Ncut, is defined as,
LNcut=D -1/2
LD-1/2=I- SN (2)
Where SN is the normalized similarity matrix defined as
SN=D -1/2
Department of CSE, ECE & EEE, Magna College of Engineering, Chennai-600055, India.
An intuitive idea for clustering multi-type interrelated objects is the mutual reinforcement clustering. The idea works as follows: start with initial cluster structures of the data; derive the new reduced features from the clusters of the related objects for each type of objects; Base on this idea, Zeng et al. (2002) propose a framework for clustering heterogeneous Web objects and Wang et al. (2003) present an approach to improve the cluster quality of interrelated data objects through an iterative reinforcement clustering process. However, there is no sounded objective function and theoretical proof on the effectiveness and correctness (convergence) of the mutual reinforcement clustering.
3.2 Similarity Tensor
Similarity Tensor is a tensor based frame work. Tensor is a geometric object which describes the linear relationship between vectors and scalars. Following the two multiview clustering strategies discussed the tensor-based solutions. Compared to the single view spectral clustering, which is solved by matrix decomposition, in this proposed system that the multiview clustering by tensor decomposition. The goal of single-view spectral clustering is to find an optimal latent subspace from single-view data. In contrast, with multiview data, is to obtain a joint optimal subspace with the aid of tensor matrix as follows,
U max ∥ UTSNU∥ (4)
IV. TENSOR DECOMPOSITION
Tensor decompositions are higher-order analogues of matrix decompositions and have proven to be powerful tools for data analysis. In particular, we are interested in the canonical tensor decomposition, otherwise known as CANDECOMP/PARAFAC (CP), which expresses a tensor as the sum of component rank-one tensors and is used in a multitude of applications such as chemometrics, signal processing, neuroscience, and web analysis. The task of computing CP, however, can be difficult. The typical approach is based on alternating least squares (ALS) optimization, but it is not accurate in the case of over factoring. High accuracy can be obtained by using nonlinear least squares (NLS) methods; the disadvantage is that NLS methods are much slower than ALS. In this paper, we propose the use of gradient-based optimization methods. We discuss the mathematical calculation of the derivatives and show that they can be computed efficiently, at the same cost as one iteration of ALS.
4.1PARAFAC Model
The PARAFAC model is unique, which means that it may be used e.g., for resolving spectra. However, a unique PARAFAC model does not explicitly imply that the parameters are estimates of the true underlying parameters. The algorithm for fitting the PARAFAC model is a so-called alternating least squares algorithm. It is iterative and stops when the relative difference in fit between two successive iterations is below a certain limit For some data the model is very difficult to fit and a lower convergence criterion may therefore be needed. Note that one need not check convergence for the N-PLS and Tucker algorithms as those are very efficient.
4.2 Tensor Construction
Department of CSE, ECE & EEE, Magna College of Engineering, Chennai-600055, India.
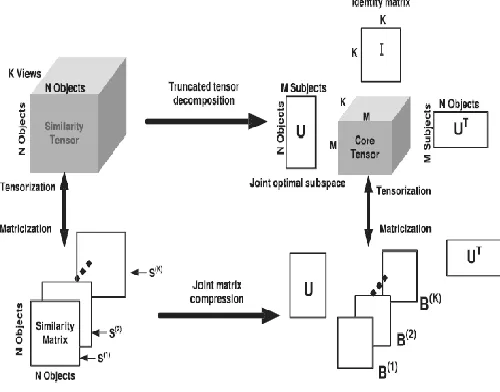
matrices SN1.SN2………..SNK associated with the different views. Since the similarity of each view is computed in a
different space, normalization is required.
Fig 2 Illustration of multiview clustering by objective function integration
4.3 Higher Order Orthogonal Integration
HOOI is a simple algorithm with cheap iterations but linear convergence rate[10]. This suggests using it if the precision or the computational time is not critical. Thus, this algorithm can be used if a good starting point is available. The trust region based algorithm has also fast (up to quadratic) convergence rate and cost per iteration smaller or equal to the one of the Newton based algorithm. Its computational time per iteration is competitive with the one of HOOI for approximations with small multilinear rank. The way one alternates between conditional updates in HOOI makes that the iterates for U and V are different, despite the fact that A is symmetric in its first two modes. Upon convergence, the iterates for U and V will match again. Using the estimate of U for updating in both the first and second mode may lead to divergence [11]. The matrix W is not updated but set equal to the identity matrix here. The resulting algorithm, called MC-FR-OI-HOOI, is presented as Algorithm is described below.
Algorithm 1.MC-TR-I-HOOI (S(1).S(2)…………S(k),M)
Comment:M is the number of clusters
step 1. Build a combined similarity matrix 𝐾 SN
𝑘=1 step 2. Obtain U by eigen value decomposition step 3. Normalize the rows of U to unit length step 4. Calculate the cluster idx with k-means on U return (idx: the clustering label)
Here, U is determined by the M dominant mode-1 singular vectors of A, i.e., it follows from the M dominant left singular vectors of A(1).Because of the partial symmetry of A,A(2)yields the same U. We call this method MC-FR-OI-MLSVD.
The pseudocode of MC-FR-OI-MLSVD is as follows:
Algorithm 2.MC-FR-OI-MLSVD (S(1).S(2)…………S(k),M)
Comment: M is the number of clusters
step 1. Build a similarity tensor A step 2. Obtain the unfolding matrix A (1)
step 3. Compute U from the subspace spanned by the M dominant left singular vectors of A (1)
Department of CSE, ECE & EEE, Magna College of Engineering, Chennai-600055, India.
step 5. Calculate the cluster idx with k-means on U return (idx: the clustering label)
4.4 THE GROUPING ALGORITHM
The grouping algorithm consists of the following steps:
1. Given an image or image sequence, set up a weighted graph G =(V,E). And set the weight on the edge connecting two nodes to be a measure of the similarity between the two nodes.
2. Solve (D – W) x=𝜆Dx for eigenvectors with the smallest eigen values.
3. Use the eigenvector with the second smallest eigen value to bipartition the graph.
4. Decide if the current partition should be subdivided and recursively repartition the segmented parts if necessary.
4.5 Normalized Cut
The k-way normalized cut problem is to minimize the links that escape a cluster relative to the total “weight” of the cluster. Once the eigenvectors are computed, we can partition the graph into two pieces using the second smallest eigenvector. In the ideal case, the eigen vector should only take on two discrete values and the signs of the values can tell us exactly how to partition [13] the graph. However, our eigenvectors can take on continuous values and we need to choose a splitting point to partition it into two parts. There are many different ways of choosing such a splitting point. One can take 0 or the median value as the splitting point or one can search for the splitting point such that the resulting partition has the best Ncut =(A,B).
Fig 3. Joint matrix compression in MC-FR-OI
Department of CSE, ECE & EEE, Magna College of Engineering, Chennai-600055, India.
At first glance, weighted kernel k-means and normalized cuts using spectral clustering appear to be quite different. After all, spectral clustering uses eigenvectors to help determine the partitions, whereas eigenvectors do not appear in kernel k-means [14]. However, we saw that the normalized cut problem can be expressed as a trace maximization problem, and in this section. One advantage to our use of an iterative algorithm for these graph problems is that we can use different improvement methods, such as local search, to increase the quality of the results. In situations where eigenvector computation is difficult, for example, when the affinity matrix is large and sparse, and many eigenvectors are desired, our iterative algorithm is particularly useful.
V. DISCUSSION
Based on the clustering performance of the multiview Clustering strategies, first, MKF is efficient when compared with tensor based strategies. Thus, such a simple combination neglects the discriminating capability of each kernel. Second, clustering ensemble methods (SAand AdacVote) rely on discrete hard clustering. Using only the final partition information seems too fragile to integrate. In addition, because the partition of every single-view data is required. Moreover, its optimization mechanism consumes much time. Fourth, for CP-ALS, the failure might be due to the un orthogonal property of the relaxed assignment matrix U after tensor decomposition. The reason is that the similarity matrix in adopted to construct the tensor corresponds to the Ncut-based Laplacian matrix that requires the orthogonal partition in spectral clustering (3).Meanwhile, our tensor-based multiview spectral clustering can be thought of as a “multiview PCA” analysis, which integrates multiview information seamlessly and forms a joint optimal subspace. Therefore, our strategy can extract the latent pattern shared by all views and filter outer relevant information or noise. The tensor-based multiview clustering of optimization integration strategy (MC-FR-OIMLSVD and MC-FR-OI-HOOI) leverages the effect of each single-view data in an appropriate way while the tensor based multiview clustering of matrix integration strategy is able to utilize the linear relationship of multiview data for joint analysis.
VI. CONCLUSION
The proposed work deals with multiview clustering framework based on high-order analogues of the matrix SVD and PCA. This framework can be regarded as a multiview extension of spectral clustering. With our tensor formulation, both heterogeneous and homogeneous information can be integrated to facilitate the clustering task. Here proposed two new multiview clustering strategies: multiview clustering by the integration of the Frobenius norm objective function (MC-FR-OI) as well as the matrix integration in the Frobenius-norm objective function (MCFR-MI). The relevant tensor-based solutions are proposed, which are either iterative optimization or efficient approximation. All of them are capable of utilizing the global information of multiview data while taking the effect of single-view data into consideration [15]. Furthermore, these different methods can be applied to various practical scenarios.
REFERENCES
[1] X. Liu, S. Yu, Y. Moreau, B. De Moor, W. Gla¨nzel, and F. Janssens,“Hybrid Clustering of Text Mining and Bibliometrics Applied to Journal Sets,” Proc. SIAM Int’l Conf. Data Mining, pp. 49-60, 2009.
[2] G.H. Golub and C.F. Van Loan, Matrix Computations. John Hopkins Press, 1989.
[3] Shi, J., & Malik, J. (2000). Normalized cuts and image segmentation .IEEE Transactions on Pattern Analysis and Machine Intelligence, 22, 888–905. [4] Gersho A., Gray R.M.: Vector Quantization and Signal Compression. (Dordrecht: Kluwer Academic Publishers, 1992)
[5] Soong F.K., Rosenberg A.E., Juang B-H., Rabiner L.R.: A vector quantization approach to speaker recognition, AT&T Technical Journal, 66: 14-26,1987.
[6] Alexander DC, Gee JC, and Bajcsy RK (1999) Similarity measures for matching diffusion tensor images. Proc. British Machine Vision Conference (Nottingham),BMVA, 93–102
[7] Duda JT, Rivera M, Alexander DC, and Gee JC (2003) method for non rigid registration of diffusion tensor magnetic resonance images. Proc. SPIE Medical Imaging (San Diego), SPIE, 1186–1196.
[8] Verma R and Davat zikos C (2004) Matching of diffusion tensor images using Gabor features. Proc. IEEE International Symposium on Biomedical Imaging(Arlington), IEEE Press, 396–399.
Department of CSE, ECE & EEE, Magna College of Engineering, Chennai-600055, India.
[10] L. Tucker, “The Extension of Factor Analysis to Three-Dimensional Matrices,” Contributions to Mathematical Psychology, H.Gulliksen and N. Frederiksen, eds., pp. 109-127, Holt, Rinehart& Winston, 1964.
[11] J. Shi and J. Malik, ªNormalized Cuts and Image Segmentation, . IEEE Conf. Computer Vision and Pattern Recognition, pp. 731-737, 1997. [12] El-Yaniv, R., &Souroujon, O. (2001). Iterative double clustering for un supervised and semi-supervised learning. ECML (pp.121–132).
[13] Zha, H., Ding, C., Gu, M., He, X., & Simon, H. (2002). Spectral relaxation for k-means clustering. Advances in Neural Information Processing Systems, 14.