Evolutionary Computation for Sensor Planning:
The Task Distribution Plan
Enrique Dunn
Departamento de Electr´onica y Telecomunicaciones, Divisi´on de F´ısica Aplicada, Centro de Investigaci´on Cient´ıfica y de Educaci´on Superior de Ensenada, 22860 Ensenada, BC, Mexico
Email:[email protected]
Gustavo Olague
Departamento de Ciencias de la Computaci´on, Divisi´on de F´ısica Aplicada, Centro de Investigaci´on Cient´ıfica y de Educaci´on Superior de Ensenada, 22860 Ensenada, BC, Mexico
Email:[email protected]
Received 29 June 2002 and in revised form 29 November 2002
Autonomous sensor planning is a problem of interest to scientists in the fields of computer vision, robotics, and photogramme-try. In automated visual tasks, a sensing planner must make complex and critical decisions involving sensor placement and the sensing task specification. This paper addresses the problem of specifying sensing tasks for a multiple manipulator workcell given an optimal sensor placement configuration. The problem is conceptually divided in two different phases:activity assignmentand tour planning. To solve such problems, an optimization methodology based on evolutionary computation is developed. Opera-tional limitations originated from the workcell configuration are considered using specialized heuristics as well as a floating-point representation based on the random keys approach. Experiments and performance results are presented.
Keywords and phrases:sensor planning, evolutionary computing, combinatorial optimization, random keys.
1. INTRODUCTION
Sensor planning is a growing research area, which studies the development of sensing strategies for computer vision tasks [1]. The goal of such planning is to determine, as au-tonomously as possible, a group of sensing actions that lead to the fulfillment of the vision task objectives. This is impor-tant because there are environments (i.e., dynamic environ-ments with physical and temporal constraints) and tasks (i.e., scene exploration, highly accurate reconstruction) where the specification of an adequate sensing strategy is not a trivial endeavor. Moreover, an effective planner must make consid-erations that require complex spatial and temporal reason-ing based on a set of mathematical models dependent of the vision task goals [2]. Indeed, difficult numerical and combi-natorial problems arise, presenting a rich variety of research opportunities. Our approach is to state such problems in op-timization terms and apply evolutionary computation (EC) methodologies in their solution [3].
The problem of visual inspection of a complex three-dimensional object requires the acquisition of multiple ob-ject images from different viewpoints [4]. Accordingly, to for-mulate a sensing strategy, an effective planner must consider how the spatial distribution of viewpoints affects a specific
task goal, what an adequate configuration for an individual sensor is, how the sensing actions will be executed. These are the kind of general considerations that call for the use of a flexible computing paradigm like EC. This work presents
the ongoing development of the EPOCA [5] sensor
plan-ning system, giving special attention to the task distribution problem that emerges from a multiple manipulator workcell [6].
The literature provides multiple examples of work deal-ing with automated sensdeal-ing planndeal-ing systems which consider a manipulator using a “camera-in-hand” configuration. The HEAVEN system developed by Sakane et al. [7] is an exam-ple in which the camera and light illumination placement are studied. The MVP system developed by Abrams et al. [8] considered the viewpoint planning of one manipulator monitoring the movements of a second robot. The work de-veloped by Triggs and Laugier [9] considers workspace con-straints of a robot carrying a camera with the goal of au-tomated inspection. More recently, Whaite and Ferrie [10] developed an uncertainty based approach for autonomous exploration using a manipulator robot. The next best view problem for automated surface acquisition working with
a range scanner has been addressed by Pito [11].
active vision systems for 3D reconstruction and exploration. Ye and Tsotsos [13] developed a sensor planner system for 3D object search applied in mobile robotics. However, none of these systems have studied the problem of assigning and se-quencing the best order of movements that a multiple robot system needs to perform.
This paper is organized as follows. First, the problem statement is given in Section 2. Then, our approach to the task distribution problem using EC is presented inSection 3. In this section, we address the aspects of search space reduc-tion, solution representareduc-tion, and search heuristics. Experi-mental results are presented next in order to demonstrate the validity and usefulness of the solution. Finally, conclusions and guidelines for future research are provided to end the paper.
2. PROBLEM STATEMENT
The automation of visual inspection tasks can be achieved
with the use of manipulator robots, see Figure 1.
How-ever, the incorporation of such devices makes additional de-mands on a sensing planner. In this example, each cam-era is mounted on the robot hand with the goal of mea-suring the box on the table. Also, additional floating cam-eras represent a set of desired viewpoints. The sensing plan must consider not only the constraints and objectives of the particular visual task but also the operational restrictions imposed by the workcell. Additionally, in the case where multiple manipulators are equipped with digital cameras, a problem of robot coordination needs to be resolved. More precisely, sensing actions need to be distributed among the various sensing stations, and an efficient task specification for the entire workcell should be determined. The EPOCA network design module can determine an optimal sensing configuration for multiple cameras converging on a three-dimensional object [14]. We use this configuration as input for our task distribution problem in the proposed multiple robot workcell. It is assumed that the robots move in straight lines between different viewpoints and that each robot must start and finish each tour from a predetermined configura-tion. In this way, the problem of specifying an efficient task distribution for the manipulator robots consists of the fol-lowing.
(1) Assigning to each of the robots a set of viewpoints from which to obtain an image, seeFigure 2. In other words, determining how many and which viewpoints are to be assigned to each robot.
(2) Deciding on an optimal tour for each of the robots, see
Figure 3. This involves specifying the correct order of each viewpoint in a robot’s tour.
In this way, we have two of the most difficult
combinato-rial problems in computer science, which are the set
parti-tion and traveling salesman problems, see Figures 2and3
for the graphical interpretation of these problems. Actually, our task distribution problem consists of a multiple traveling salesman problem instance. The goal is to specify the optimal
Figure1: Photogrammetric network simulation of four robots.
Figure2: Activity assignment. Each viewpoint is assigned to one of the robots, forming different excluding sets.
Figure3: Tour planning. Each of the sets is ordered, specifying the tour to follow each of the robots.
Definition 1 (Photogrammetric network). A photogram-metric network is represented as an ordered setVofn three-dimensional viewpoints. Each individual viewpoint is ex-pressed asVj, wherejranges fromj=1 ton.
Definition 2 (Robot workcell). A multirobot active vision
system is represented by an ordered set R consisting of r
robots in the workcell. Each individual robot is expressed by
Ri, whereiranges fromi=1 tor.
Definition3 (Operational environment). Each robot has an operational restricted physical space denoted byOi, wherei ranges fromi=1 tor.
Accordingly, the problem statement can be expressed as follows.
Definition4 (Task distribution problem). Find a set ofr or-dered subsetsXi⊆V, whereV= {∪ri=1Xi |Vj ∈Xi, Vj ∈ Oi}such that the total length traveled by the robots is
mini-mized.
From the above definitions, the activity assignment
prob-lem relates each of the n elements of V with one of the
r possible elements of R. Considering that each robot Ri
has assigned ni viewpoints, a problem of sequencing the
viewpoints emerges, which we call tour planning. Our goal is to find the best combination ofactivity assignmentandtour planning in order to optimize the overall operational cost of the task distribution. This total operational cost is pro-duced by adding individual tour costs,Qi, defined by the Eu-clidean distance that each robot needs to travel in straight lines among the different viewpoints. Hence, the criterion is represented as QT = ri=1Qi. Such a problem statement
yields a combinatorial problem which is computationally NP-hard and requires the use of special heuristics in order to avoid an exhaustive search.
3. EC APPROACH TO TASK DISTRIBUTION
Our problem is presented as a combinatorial optimization problem with a large search space. An optimization method based on genetic algorithms is proposed. To obtain a quality solution, three key aspects need to be addressed:search space reduction, solution representation, and search heuristics. The following sections present our approach to these key aspects in order to develop a global optimization method to solve the task distribution problem.
3.1. Search space reduction
Combinatorial problems generally have to satisfy a given set of competing restrictions. In our task distribution problem, some of these restrictions are straightforward; that is, each viewpoint should be assigned to only one robot, each view-point should be visited only once inside a robot tour. On the other hand, implicit restrictions, like theaccessibilityof a robot to a particular viewpoint, need to be determined. Con-sideration of such restrictions can help reduce the size of the search space. This is relevant because in practice a
manip-Figure4: Operational restrictions. The workcell configuration im-poses accessibility restrictions. Hence, when a robot reach is limited, it is possible to reduce the search space for the activity assignment phase.
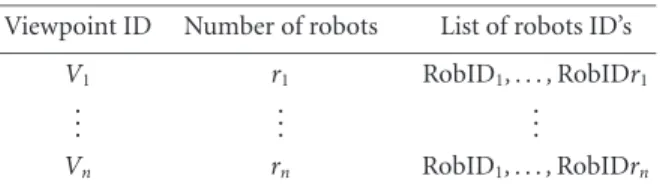
Table1: Structure ACCESSIBILITY containing the number and the list of robots capable of reaching a particular viewpoint.
Viewpoint ID Number of robots List of robots ID’s V1 r1 RobID1, . . . ,RobIDr1
..
. ... ...
Vn rn RobID1, . . . ,RobIDrn
ulator has limited workspace, see Figure 4. The method by which such restrictions are computed is presented next.
Assuming a static and obstacle-free environment, it is reasonable to compute the robots accessibility for a given po-sition and orientation by means of solving the robot inverse kinematic problem. In this work, we consider the PUMA560 manipulator which consists of six degrees of freedom. A three-dimensional computer graphics simulation environ-ment was developed in order to visualize such accessibility restrictions. Multiple manipulators were considered in our computer simulation. The inverse kinematic problem was solved for every robot at each viewpoint. The cases where a robot could access a viewpoint were stored in an auxiliary data structure called ACCESSIBILITY. This structure
con-tains an entry for every viewpoint Vj in order to keep a
record of how many and which robots are capable of reach-ing that particular viewpoint, seeTable 1. Such values remain constant throughout the course of task execution, therefore, they only need to be computed once. The above method eval-uates the restrictions imposed by the physical arrangement of the workcell, as well as the robot revolute joint limitations. Such operational restrictions are incorporated implicitly as an intrinsic element of our optimization method.
3.2. Solution representation
S= 0.41 0.51 0.15 0.79 0.63 0.96 0.84 0.18
S1 S2 S3 · · · Sn
Figure5: Solution encoding. Each of thenviewpoints is assigned a random floating-point valueSiin the range (0,1). These values are stored in a stringS.
values are stored in a representation string denoted by S. Since there arendifferent viewpoints,Swill consist ofn ele-ments, seeFigure 5. Random keys use a heuristic we call the
smallest-value-firstheuristic. In our case, the viewpoint with the smallest corresponding value inSwould be the first view-point in a given permutationP. The viewpoint with the sec-ond smallest value inSwould be the second viewpoint inP, and so forth. In this way, the order of a viewpointVjinside a given permutationPdepends on the magnitude of its cor-responding valueSjwith respect to all the other values inS. To illustrate, given five viewpoints, a possible representation string can be
S=[0.89,0.76,0.54,0.23,0.62]. (1)
The smallest value inSis found at the fourth position, de-noted byS4. Therefore,V4is the first viewpoint in the
result-ing permutationP. The second smallest value is found in the third positionS3, makingV3the second viewpoint inP, and
so on. The resulting permutation of the five viewpoints is
P=V4, V3, V5, V2, V1
. (2)
The random keys approach can be adapted to solve our task distribution problem. The smallest-value-first heuris-tic avoids the generation of unfeasible solutions common to permutation-based representations. Random keys represen-tation also allows our optimization method to apply genetic operators without the need for additional heuristics.
The convention of encoding a possible solution into a string representation has been specified. The question of how to describe the corresponding solution to such a represen-tation is now considered. Recalling the problem statement, initially, there is a set ofnviewpointsVj, and each must be assigned to one of ther possible robots. Using random keys representation, a possible solution is codified into a stringS ofnvalues. As stated inSection 2, we want to optimize the total operational costQT. However, the solution representa-tionSneeds to be decoded into an explicit description of the task distribution problem. Such a description would repre-sent each of ther robot tours. To accomplish this, an aux-iliary data structure called TASKS is proposed to represent the global task distribution among robots, seeTable 2. This structure has an entryTifor each robotRi, which describes that robot tour; that is, Ti lists the sequence of viewpoints assigned to that particular robot. Each of these Ti tours is evaluated to obtain an individual tour costQi, from which the total operational costQT is obtained. The question be-fore us now is how to convert a string representation into a corresponding task distribution description. The following
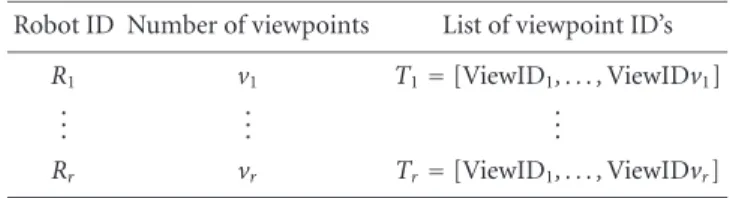
Table2: Structure TASKS containing the list of viewpoints com-prising each robot tourTi.
Robot ID Number of viewpoints List of viewpoint ID’s
R1 v1 T1=[ViewID1, . . . ,ViewIDv1]
..
. ... ...
Rr vr Tr=[ViewID1, . . . ,ViewIDvr]
subsection presents the heuristics used by our method to ob-tain such task distribution description.
3.3. Search heuristics
A solution representationSneeds to be evaluated. Such eval-uation is applied to the task distribution description
con-tained in TASKS. Hence, a mapping M : S → TASKS is
necessary. The mappingMassigns and sequences the
view-points among the different robots and stores the results in
the structure TASKS. The mappingMmakes use of the
so-lution representation data structuresSand TASKS, as well as the precomputed operational restrictions stored in ACCES-SIBILITY. The two distinct phases of activity assignment and tour planning are presented separately.
3.3.1 Activity assignment
Theactivity assignment problem allocates each of the view-pointsVjto one of the possible robots. The goal is to provide an initial unsequenced set of individual robot toursTiusing the following steps.
Step 1. Obtain the rj number of robots capable of reaching that particular viewpoint by consulting the ACCESSI-BILITY structure, seeTable 1.
Step 2. Divide the interval (0,1) into rj equally distributed segments in order to determine the size of a compari-son segment Seg=1/rj.
Step 3. Calculate in whichksegment the random valueSj re-sides, that is,k=Int(Sj/Seg) + 1.
Step 4. Assign the viewpointVj to thekth robot in the cor-responding entry in the ACCESSIBILITY structure. In this way, the assigned robot indexiis given by RobIDk, which is found on the entry that corresponds toVj in-side the ACCESSIBILITY table.
Step 5. Append Vj to the list of viewpoints, Ti assigned to theith robot. The tour descriptionTiis stored in the TASKS structure.
S= 0.41 0.23 0.15 0.79 0.42 0.96 0.64 0.18
Figure6: Activity assignment heuristics. The diagram shows Steps 1 through 4, corresponding to the assignment phase.
Tirepresents a tour of viewpoints assigned to that particular
robot and these tours are stored in the structure TASKS. Un-til this point, the order of each viewpoint inside a given tour has not been specified. This is the problem we approach next.
3.3.2 Tour planning
The tour planning problemconsists of correctly sequencing each of ther robot toursTistored in the structure TASKS. These tours are initially obtained from the activity assign-ment phase presented above, in which every viewpointVjis assigned to one of ther possible robotsRi. The goal of the tour planning phase is to minimize the total operational cost
QT. This situation is equivalent to solvingrdifferent travel-ing salesman problems. The smallest-value-first heuristic can be applied to sequencing problems such as the one presented here. Unfortunately, the rules by which the preceding assign-ments were made in Steps 1 through 4 produce undesirable tendencies in the representation valuesSjthat correspond to each tour specification Ti. This is due to the deterministic heuristic applied for robot assignment. As a consequence, the values corresponding to the viewpoints contained inTiwill be, on the average, higher than those corresponding to the viewpoints inTi−1and will create a bias inside eachTiwhen
directly applying the smallest-value-first heuristic. Therefore,
the values inside S need to be adjusted to eliminate such
unwanted properties. This is accomplished by the following heuristic steps.
Step 6. Recall in which of thekpossible segments of the range (0,1) lies theSjvalue used in the assignment phase.
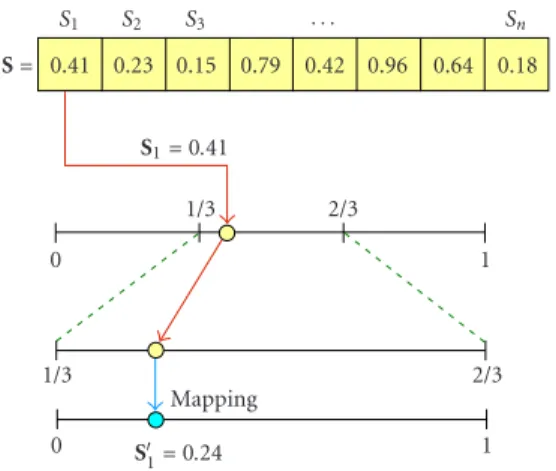
Step 7. Calculate the valueSj in the range (0,1) that reflects the relative position ofSjinside thekth segment. For example, consider the value 0.70 which lies inside the range (0.60,0.80). This value lies exactly in the middle, hence its corresponding value in the range (0,1) is 0.5. A graphic description of this heuristic is presented in
Figure 7.
Figure7: Mapping of the representation string values. Each of the values contained inSis adjusted before applying the smallest-value-first heuristic to the values stored in TASKS.
TASKS
Robot ID No. of views List of viewpoints
R1 3 T1=[V1, V3, V8]
Applying the smallest-value-first heuristic the list
T1is rearranged in the following manner
Robot ID No. of views List of viewpoints
R1 3 T1=[V3, V1, V8]
Figure8: Tour planning. The smallest-value-first heuristic is ap-plied to each robot tour considering the previously adjusted values inS.
Step 8. UpdateSjto store the new valueSj.
Step 9. Apply the smallest-value-first heuristic to each of the unordered robot toursTiusing the values stored inS, seeFigure 8.
These series of steps ensure an unbiased tour sequenc-ing, hence, empowering the search algorithm to more eff ec-tively seek out a global optima from a very large and complex search space.
4. EXPERIMENTATION AND RESULTS
[5]. EPOCA solves the photogrammetric network design problem for complex objects. The problem of task distri-bution emerges as a result of the photogrammetric network design performed by EPOCA. The system can be classified as an EC-based system that addresses the complex goal of automating the planning of sensing strategies for accurate three-dimensional reconstruction.
Two different experiments are presented next: the first is a simple scenario intended to illustrate our method’s func-tionality; the second experiment is somewhat more complex and its goal is to show the effectiveness and flexibility of our system.
4.1. Experiment A
This experiment consists of eight viewpoints to be dis-tributed among four manipulators. The viewpoints are stacked into four pairs, each pair arranged beneath one of the robots initial position, seeFigure 9. The optimal task dis-tribution for this example can be obtained using a greedy heuristic. Hence, such an experiment might seem trivial, but it will exemplify our method’s functionality.
Operational restrictions are computed first, with the goal of determining which robots can access a particular viewpoint. As mentioned inSection 3, to compute such re-strictions, the inverse kinematic problem is solved for ev-ery robot at each viewpoint. The results of such validations are stored in the structure ACCESSIBILITY. The physical arrangement of the robots for Experiment A is such that every camera can be reached by three different robots, see
Table 3.
The genetic algorithm works with a population of codi-fied strings, selecting the best individuals for reproduction. Such reproduction process combines the characteristics of two selectedparentsolutions and provides two newoffspring
solutions which, in turn, will be part of the nextgeneration
of solutions. This process is repeated in an iterative manner until a certain number of generations is executed. At the end of this iterative process, we obtain a set of possible solutions. One of those individuals, which represented the optimal so-lution, was given by the following random keys representa-tion:
S=[0.72,0.71,0.32,0.14,0.81,0.80,0.27,0.07]. (3)
After the assignment heuristic, we determine in which of thek segments each elementSj resides. For the first view-pointV1, there are three possible robots to be assigned, see Table 3; hence, the comparison segment Seg =1/3 =0.33. In this way, following Steps 1 through 5, the corresponding representation value S1 = 0.72 is determined to be in the
third segment, which is delimited by (0.66,1.00). Therefore, the robot to be assigned is the third robot onV1’s entry on
the structure ACCESSIBILITY, in this case RobID=3. The
corresponding robot to be assigned to each viewpointVjis given by
Robot=R3, R3, R1, R1, R4, R4, R2, R2
. (4)
Figure9: Eight viewpoints are to be distributed among four ma-nipulators. Viewpoints are depicted as individual cameras and solid lines connected such cameras illustrate each robot tour correspond-ing to an optimal task distribution.
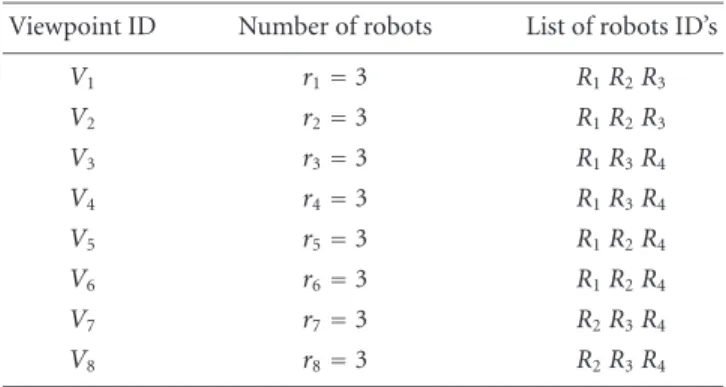
Table3: ACCESSIBILITY restrictions calculated for Experiment A, depicted inFigure 9.
Viewpoint ID Number of robots List of robots ID’s
V1 r1=3 R1R2R3 V2 r2=3 R1R2R3 V3 r3=3 R1R3R4 V4 r4=3 R1R3R4 V5 r5=3 R1R2R4 V6 r6=3 R1R2R4 V7 r7=3 R2R3R4 V8 r8=3 R2R3R4
At this point, we have an appropriately assigned set of viewpoints. The values contained inSwill now be adjusted in accordance with Steps 5 through 9 so that the smallest-value-first heuristic can be applied to the viewpoints assigned to each robot. For the first viewpoint, its corresponding value
S1is adjusted as follows. Recall thatS1=0.72 resides on the
third segment which is delimited by (0.66,1.00). The corre-sponding value of 0.72 on the range (0,1) with respect to the third segment just mentioned is given by the value 0.18. Ap-plying these steps to every value inSyields
S=[0.18,0.15,0.96,0.42,0.45,0.42,0.81,0.21]. (5)
Once the values in S have been adjusted, applying the
smallest-value-first heuristic rearranges TASKS as shown in
Table 4.
Twenty trials were executed and this global minimum distribution was reached in every single execution in an av-erage of 15.1 generations.
4.2. Experiment B
Table4: TASKS for an optimal solution in Experiment A after the tour planning phase.
Robot ID Number of viewpoints List of viewpoint ID’s
1 2 T1=[V4V3]
2 2 T2=[V8V7]
3 2 T3=[V2V1]
4 2 T4=[V6V5]
Figure10: Thirteen viewpoints are to be distributed among four manipulators. Viewpoints are depicted as individual cameras.
Figure11: Best solution found by the genetic algorithm for the con-figuration shown inFigure 10.
photogrammetric network consisting of 13 cameras in an op-timal manner, seeFigure 10. Working with this fixed config-uration, we executed several tests. First, to test our method’s functionality, we executed the task distribution planner. Sev-eral possible solutions are obtained over the course of multi-ple executions, two of such solutions are depicted in Figures
11and12. Notice that the best solution found, represented inFigure 11, does not incorporate all of the available robots.
Figure 12shows a more typical solution which is also found by our system.
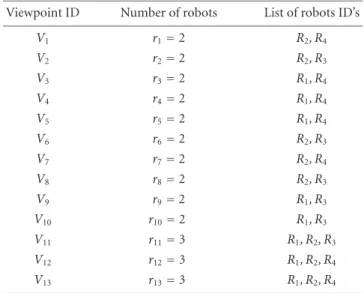
In order to test the method’s adaptability, two of the four manipulator robots were disabled. This additional restriction is reflected only on changes to the values stored in Table 5.
Figure12: Another solution found by the system that corresponds to the configuration shown inFigure 10.
Table5: ACCESSIBILITY restrictions calculated for Experiment B, depicted inFigure 10.
Viewpoint ID Number of robots List of robots ID’s
V1 r1=2 R2, R4 V2 r2=2 R2, R3 V3 r3=2 R1, R4 V4 r4=2 R1, R4 V5 r5=2 R1, R4 V6 r6=2 R2, R3 V7 r7=2 R2, R4 V8 r8=2 R2, R3 V9 r9=2 R1, R3 V10 r10=2 R1, R3 V11 r11=3 R1, R2, R3 V12 r12=3 R1, R2, R4 V13 r13=3 R1, R2, R4
The system is expected to distribute tasks among the two re-maining robots. Results from such tests are shown in Figures
13and14. In these cases theactivity assignmentproblem be-comes visually more simple to resolve, but the difficulty of thetour planningproblem becomes more evident since each tour will consist of more viewpoints.
Since our approach is based on EC techniques, the de-termination of the task distribution plan is the product of the evolution process over a population of possible solutions. Therefore, fitness values of each of these individuals, and of the population in general, reflect the effect of such evolu-tion. In this way, the population fitness values evolve over the course of several generations until an optimal solution is found, seeFigure 15. The stepwise decrements in the best fitness line point out the combinatorial aspect of our search, while the average fitness confirms the positive effect of the evolution process.
Figure13: Solution found by the system for the case where a pair of robots were disabled from the configuration shown inFigure 10.
Figure14: An environment similar toFigure 13showing the sys-tem’s flexibility to changes in the workcell configuration.
Generation
20 40 60 80 100 120
Oper
ational
cost
in
mm.
1000 1500 2000 2500 3000 3500 4000 4500 5000 5500
Best fitness Average
fitness Worse fitness
Figure15: Population fitness over the evolution process.
Figure 15and the overall performance depend on the genetic algorithm operational parameters. A single point crossover operator, subject to a probability Pc = 0.95, was utilized. Furthermore, the mutation operator consisting of an addi-tive value obeying a normal distribution N(0,0.2) for each of the elements in the representation string was also applied according to a probabilityPm=0.001.
Execution number
10 20 30 40 50
Oper
ational
cost
in
mm.
1720 1760 1800 1840 1880 1920 1960
Gready search
Exhaustive search
Figure 16: Genetic algorithm performance over multiple execu-tions. The obtained solutions are always better than a greedy search, reaching the global optima 14 out of 50 times.
An appreciation of the effectiveness of the proposed
methodology is obtained from the comparison of its solu-tions against those offered by alternative methodologies. The proposed methodology is compared to an exhaustive search and a greedy heuristic. The results for the fixed configura-tion shown in Figure 10are presented inFigure 16. As the figure illustrates, our algorithm consistently outperforms a greedy heuristic in terms of the quality of the proposed solu-tions. The advantage obtained with the genetic algorithm ap-proach refers to the computational cost; considering the EC algorithm requires about 3 seconds against 14 hours for an exhaustive search. On the other hand, our approach reaches a global optima 28% of the time over the course of 50 execu-tions, coming within an average of 2.9% to global optima. As these results reflect, there is an obvious compromise between solution quality and computational efficiency.
5. CONCLUSIONS AND FUTURE WORK
The development of an effective sensor planner for
auto-mated vision tasks implies the consideration of operational restrictions as well as the vision tasks objectives. This work presents a solution for the task distribution problem inher-ent to multiple robot workcells. The problem is conceptual-ized as two separate combinatorial problems: activity assign-ment and tour planning. A genetic algorithm-based strategy that concurrently solves these problems was presented along with experimental results. The approach employs auxiliary data structures in order to incorporate accessibility limita-tions and to specify a task distribution plan. The evolutionary nature of the optimization method allows for multiple ap-proximate solutions of the optimization problem to be found over the course of several executions. Performance consider-ations support the use of the proposed methodology com-pared to a greedy heuristic or an exhaustive search.
be modified in search of improving the evolutionary algo-rithm performance. Also, a rigorous analysis of the proper-ties of the heuristics used is needed. At present, we are work-ing toward a real implementation of our algorithms for intel-ligent sensor planning.
ACKNOWLEDGMENTS
This research was founded by Contract 35267-A from CONACyT and under the LAFMI Project. The first author was supported by scholarship 142987 from CONACyT. Fig-ures1,2,3,4,9,10,11,12,13, and14were generated with software written at the Geometry Center. The authors thank the anonymous reviewers for their suggestions which greatly helped improve this paper.
REFERENCES
[1] K. A. Tarabanis, P. K. Allen, and R. Y. Tsai, “A survey of sensor planning in computer vision,” IEEE Transactions on Robotics and Automation, vol. 11, no. 1, pp. 86–104, 1995.
[2] J. Miura and K. Ikeuchi, “Task-oriented generation of visual sensing strategies in assembly tasks,” IEEE Trans. on Pattern Analysis and Machine Intelligence, vol. 20, no. 2, pp. 126–138, 1998.
[3] G. Olague and R. Mohr, “Optimal camera placement for ac-curate reconstruction,”Pattern Recognition, vol. 35, no. 4, pp. 927–944, 2002.
[4] T. S. Newman and A. K. Jain, “A survey of automated visual inspection,” Computer Vision and Image Understanding, vol. 61, no. 2, pp. 231–262, 1995.
[5] G. Olague, Planification du placement de cam´eras pour des mesures 3D de pr´ecision, Ph.D. thesis, Institut National Poly-technique de Grenoble, France, October 1998.
[6] G. Olague and E. Dunn, “Multiple robot task distribution: Towards an autonomous photogrammetric system,” inProc. IEEE Systems, Man and Cybernetics Conference, vol. 5, pp. 3235–3240, Tucson, Ariz, USA, October 2001.
[7] S. Sakane, R. Niepold, T. Sato, and Y. Shirai, “Illumination setup planning for a hand-eye system based on an environ-mental model,”Advanced Robotics, vol. 6, no. 4, pp. 461–482, 1992.
[8] S. Abrams, P. K. Allen, and K. A. Tarabanis, “Dynamic sensor planning,” inProc. IEEE International Conf. on Robotics and Automation, Atlanta, Ga, USA, May 1993.
[9] B. Triggs and C. Laugier, “Automatic task planning for robot vision,” inProc. Int. Symp. Robotics Research, Munich, October 1995.
[10] P. Whaite and F. P. Ferrie, “Autonomous exploration: Driven by uncertainty,”IEEE Trans. on Pattern Analysis and Machine Intelligence, vol. 19, no. 3, pp. 193–205, 1997.
[11] R. Pito, “A solution to the next best view problem for auto-mated surface acquisition,” IEEE Trans. on Pattern Analysis and Machine Intelligence, vol. 21, no. 10, pp. 1016–1030, 1999. [12] E. Marchand and F. Chaumette, “Active vision for complete scene reconstruction and exploration,”IEEE Trans. on Pattern Analysis and Machine Intelligence, vol. 21, no. 1, pp. 65–72, 1999.
[13] Y. Ye and J. K. Tsotsos, “Sensor planning for 3D object search,” Computer Vision and Image Understanding, vol. 73, no. 2, pp. 145–168, 1999.
[14] G. Olague, “Automated photogrammetric network design us-ing genetic algorithms,” Photogrammetric Engineering & Re-mote Sensing, vol. 68, no. 5, pp. 423–431, 2002, Paper awarded
the “2003 First Honorable Mention for the Talbert Abrams Award”, by ASPRS.
[15] J. C. Bean, “Genetic algorithms and random keys for sequenc-ing and optimization,” ORSA Journal on Computing, vol. 6, no. 2, pp. 154–160, 1994.
Enrique Dunn received a computer en-gineering degree from Universidad Au-t ´onoma de Baja California, in 1999. He ob-tained the M.S. degree in computer science from CICESE, Mexico, in 2001. Currently, Dunn is working towards the Ph.D. degree at the Electronics and Telecommunications Department, Applied Physics Division, CI-CESE, Mexico. His research interests in-clude robotics, combinatorial optimization,
evolutionary computation, close range photogrammetry, and 3D simulation. He is a student member of the ASPRS.
Gustavo Olagueholds a Bachelor’s degree (Honors) in Electronics Engineering and a Master’s degree in computer science from the Instituto Tecnol ´ogico de Chihuahua, Mexico, in 1992 and 1995, respectively. He received the “Dipl ˆome de Doctorat en Im-agerie, Vision et Robotique” (Ph.D.) from Institut National Polytechnique de Greno-ble, France, in 1998. From 1999 to 2001, he was an Associate Professor of computer