FULL PAPER
The 2010 seismovolcanic crisis at Taal
Volcano (Philippines)
Jacques Zlotnicki
1*, Y. Sasai
2, M. J. S. Johnston
3, F. Fauquet
1, E. Villacorte
4and J. M. Cordon Jr.
4Abstract
Typical eruptions of Taal Volcano in the Philippines are frequent and violently explosive. The last devastating phrea-tomagmatic eruption from 1965 to 1977 resulted in the death of about 200 persons. For this and other earlier events, no warnings of impending eruptions were issued. Since this time, volcanic crises involving episodes of seismicity, deformation, gas release, temperature change, etc., have occurred frequently.Each of these did not, but possibly could have, evolved into an explosive eruption. One such event occurred between April 2010 and March 2011. This paper reports various types of geophysical data (electric/magnetic field, ground temperature, seismicity and ground deformation) taken during this period of activity together with the current state of geophysical knowledge about the volcano in order to throw light on activity evolution. While the 2010 seismovolcanic crisis was preceded by unusual changes in electric field, ground tilting and uplift, the major signals from all data were concomitant with the evolu-tion of the crisis. On April 20, 2010, felt earthquakes first started to occur. The numbers increased sharply after April 29 with repeated pulses of seismicity that ended finally in March 2011. Overall, we can identify three periods of seismic activity, from April 20 to August 4–8, from August 4–8 to November 18, and from November 18 to March 28, 2011. Although only a single tiltmeter was in operation, it recorded three phases of deformation that correspond gener-ally with the pulses in seismic activity. Phase 1 appears to correspond to inflation at a depth of about 5 km just to the NW of Main Crater Lake from April 20 to June 11, 2010. This resulted in an eastward tilting of the northern flank of the volcano. This apparently triggered rapid but shallower inflation (Phase 2) in the hydrothermal region of the volcano under the northern edge of Main Crater Lake from June 11 to July 13 just to the SE of the initial deeper source as indicated by northward tilting of the volcano’s northern flank. Progressive deflation began after July 13. By March 28, 2011, the deformation state recovered to the pre-crisis level and felt seismic activity ceased. Apparent related changes in seismicity, tilt, magnetic and electric fields occur during smaller NS inflations in the Phase 3 deflation—Phase 3a (July 13 to August 4–8), Phase 3b (August 4–8 to November 18) and Phase 3c (November 18 to March 28, 2011). These likely result from interrelated stress change, fluid/gas migration and thermal activity at depth and in the hydrothermal system. The rapidity of changes in the state of the volcano over a matter of hours during this entire process indicates rapid communication occurs between processes at depth and in the hydrothermal system and this could easily result in the dramatic evolution to violent phreatic explosions with little warning.
Keywords: Taal Volcano, Multi-parameters monitoring, Tilt, Seismicity, Electromagnetism, Electricity, 2010 crisis, Volcanic risk
© The Author(s) 2018. This article is distributed under the terms of the Creative Commons Attribution 4.0 International License (http://creat iveco mmons .org/licen ses/by/4.0/), which permits unrestricted use, distribution, and reproduction in any medium, provided you give appropriate credit to the original author(s) and the source, provide a link to the Creative Commons license, and indicate if changes were made.
Open Access
*Correspondence: jacques.zlotnicki@wanadoo.fr
Introduction
Taal Volcano is a huge active stratovolcano, located at the southwestern end of the Macolod corridor in the large convergence zone between the Eurasian and Philippine tectonic plates (Fig. 1a) (Galgana et al. 2007). The cur-rently activity is confined to Volcano Island in the center of an older water-filled caldera about 25–30 km in diame-ter that last erupted about 5000–7000 years B.P. (Ohkura et al. 2001; Ramos 2002; Galgana et al. 2007). Resurgent volcano growth that formed Volcano Island together with eruptions of large volumes of ash (e.g., 1749, 1754) and weak tectonic uplift have combined to progressively iso-late the older caldera from the China Sea (Maso 1991; Ramos 2002; http://www.iml.rwth-aache n.de/Petro graph ie/taal-mas/ta-maso.htm).
Volcano Island is now a 5-km wide, 311 m high, resur-gent dome within the older caldera that is now filled with fresh water to a depth of about 180 m thereby forming Taal Lake (“TL” hereafter). At the top of Volcano Island, a smaller central crater lake with a diameter of about 1.2 km has formed (Fig. 1b). This 75 m deep acidic lake, called Main Crater Lake (“MCL” hereafter), has an aver-age water temperature of 33 °C (Fig. 2) (see also Arpa et al. 2013).
Eruptions on Taal can be powerful and violent. Phre-atic, phreatomagmPhre-atic, plinian and strombolian erup-tions possibly accompanied by pyroclastic surges and large ash clouds may happen with little warning, and until now, no eruptions have been forecast well in advance. Volcanic Explosivity Indices [VEI (Newhall and Self 1982)] can be high as 4, as for the 1716, 1749, 1754, and 1965 eruptions (http://www.volca no.si.edu/volca no.cfm?vn=27307 0; Zlotnicki et al. 2017). To put this in perspective, ash clouds reached Manila metropolitan city during the 1911 eruption for which the VEI was only equal to 3 (http://volca no.si.edu/volca no.cfm?vn=27307 0).
The dynamics of the eruptions are apparently con-trolled by interactions between a magma reservoir (and escaping hot gases and fluids) with ground water from the China Sea, Taal Lake and the Main Crater Lake in addition to the seasonal rainfall (about 5 m/y) (Delmelle et al. 1998). Considerable evapotranspiration associated with powerful hydrothermal dynamics results in ther-mal transfer and mineralization of solid rocks through active fissures, geyser activity and fumarole activity in the upper part of the volcano (Cardenas et al. 2012). These processes mechanically weaken the different lithologies
of the volcanic edifice. Major sources of CO2 degassing emanate from the magmatic source(s), geothermal areas, active fissures, and the MCL (Zlotnicki et al. 2009b; Pérez et al. 2011; Maussen et al. 2018). The CO2 flux can be on the order of 500 t/d during quiet periods and can reach as much as 4000 t/d during large seismic activity (Arpa et al. 2013; A. Bernard personal communication). Most of these features arise from a large hydrothermal region overlying deeper magmatic bodies (Delmelle et al. 1998; Zlotnicki et al. 2009a, 2017; Fikos et al. 2012; Yamaya et al. 2013; Alanis et al. 2013).
In particular till 2010, strong CO2 degassing and high heat flow occurs along east–west orientated fissures just to the north of MCL till Daang Kastila area (“DAK”) (Fig. 1b). Other sets of small fissures showing high heat flow occurred on the outer northern flank of the cra-ter and along the northern shoreline of Taal Lake dur-ing large seismic crises (1992–1994) (“Pira-Piraso and Calauit districts”) (Fig. 1b). (Harada et al. 2005; Zlotnicki et al. 2009a, b). These fissure areas are apparently linked at depth as shown by 13 audio-magnetotelluric sound-ings made in 2007 along a north–south cross section of the volcano (Zlotnicki et al. in preparation) and by the
apparent resistivity mapping of this region of the volcano [Fig. 3a(a), a(b)] (Fikos et al. 2012).
The bottom topography of MCL shows fissures striking N120°E at the bottom of the Lake through which intense fluxes of hot gases are passing (Figs. 2a, b, 3a). These fis-sures are particularly apparent in a bulge of about 1 Mm3 under the north part of the lake (Fig. 2a). Most likely, this bulge appeared during the 1992 and 1994 seismic crises since extensions of these fissures opened on land and in the cliff forming the crater rim at this time. Further to the east, fissuring progressively decreases, bends to the southeast and disappears before reaching the crater rim.
The deep resistivity structure was determined using wideband magnetotelluric sounding surveys (Fig. 3c). The 2-D modeling results (Yamaya et al. 2013) show a zone of higher resistivity beneath the MCL that apparently extends downward from about 0.5 km to about 4 km depth. In this central zone, located at about 2.5 km depth, the resistivity has values between 20 and 100 Ohm m as compared to values smaller than 10 Ohm m outside the zone. The results from 3-D modeling of the resistivity structure (Alanis et al. 2013) identify the location and the shape of the hydrothermal reservoir beneath around the center of MCL to be approximately 3 km wide and cen-tered at about 2.5 km depth. This zone could correspond to the part of the hydrothermal system where tempera-tures exceed 200 °C. Both Yamaya et al. (2013) and Alanis et al. (2013) concluded that the magmatic body indicated by GPS networks is likely at a depth between 4 and 6 km under MCL (Lowry et al. 2001; Bartel et al. 2003; Galgana et al. 2014).
Since 1572, 33 historical eruptions have been identi-fied. The most recent violent phreatomagmatic eruption began in 1965 and ended in 1977. This produced pyro-clastic flows that reached as far as the southwestern rim of the old caldera (Moore et al. 1966). Since that time, activity has been characterized by episodes of deforma-tion and seismicity without surface eruptive products. Such active periods occurred in 1992 with up to 2550 felt events per day and during 1994 with up to 1550 felt earthquakes per day, respectively. During this time, infla-tion reached 16 cm at DAK and about 10 cm near Calauit to the southeast and the temperature of the MCL rose to 39–41 °C (Lowry et al. 2001; Bartel et al. 2003; Galgana et al. 2014).
Since 1994, periods of inflation occurred in Febru-ary–November 2000 and in June 2004–March 2005 when extension rates of 145 mm yr−1 and uplift rates of 220 mm yr−1 were observed by Bartel et al. (2003) and Galgana et al. (2014) with no obvious correspondence between deformation and seismicity. The authors fit these deformation data with simple point-source Mogi mod-els and finite-element modmod-els for elastic and viscoelastic
material and concluded that the deformation could have been generated by a change in pressure (or volume) of a source at a depth of about 5 km beneath Daang Kastila (DAK—Fig. 1b) in 2000, and under the eastern shore of MCL (MCL—Fig. 2a) in 2005. It is consistent with the concept of episodic inflation phases being caused by intermittent intrusions of magma into a shallow reser-voir of magma at about 5 km depth and deflation phases caused by exsolution of magmatic fluids and gases into an overlying unconfined, but not yet identified at that time, hydrothermal system.
After the large seismic crisis in early 2005, during which some hundreds of inhabitants’ spontaneously evacuated Volcano Island for a few days, the seismic-ity decreased. Occasional minor swarms did occur over several weeks each year. In spite of decreasing seis-micity, the Philippines Institute of Volcanology and
Seismology (PHIVOLCS, http://www.phivo lcs.dost.gov. ph/) recorded leveling data that showed persistent low and gradual inflation of the volcano with largest ampli-tudes on the west/northwest sector. The maximum uplift reached 18 mm along the western survey line between 2005 and mid-2010.
In summary, the present day knowledge of the struc-ture within Taal Volcano indicates:
1. A steady state magmatic source of unknown shape may be located between 4 and 6 km depth below the MCL (Zlotnicki et al. 2017). Its exact location is not well constrained, and it may migrate with time, oscil-lating from the northern flank to the inner northern part of the MCL.
2. High gas flow and volcanic fluids emanate from this magma reservoir and contribute to the activity of the hydrothermal system located directly above the res-ervoir under the MCL.
3. At depths shallower than about 2 km, the hydrother-mal system vents either into the northern part of the crater where higher gas concentrations and thermal fluxes are observed or into the 400 m long fissures system on the north flank that apparently opened during the 1992 and 1994 deformational and seismic swarm crises. In both of these areas, regions of high heat flux are observed and are reactivated during periods of sporadic deformation and seismic activity.
In 2005, The international Inter-Association on Elec-tromagnetic Studies of Earthquakes and Volcanoes (EMSEV, http://www.emsev -iugg.org/emsev /), in coop-eration with PHIVOLCS joined together in an effort to provide repeat surveys and continuous monitoring of many geophysical parameters on Taal Volcano. Real-time monitoring of many of these parameters was provided through continuous telemetry back to the PHIVOLVCS Buco Observatory located on the northern shore of TL. This paper concerns observations, comparisons, possi-ble physical explanations and implications obtained from data prior to and during the most recent seismovolcanic crisis on Taal Volcano in 2010–2011.
Instrumentation
Multi‑parameter installations
Construction of the first multi-parameter installation was started in 2005 at Daang Kastila (DAK) near the fis-sures field on the northern flank of the volcano (Fig. 1b). At this site, a self-recording proton magnetometer DAK monitoring the total intensity of the magnetic field (TMF) with a sampling rate of 1/min and resolution of 0.1 nT was installed together with two horizontal com-ponents of the electric field obtained from two 127 and
44-m long NS and EW lines with buried non-polarized Pb-PbCl2 electrodes. A seismometer monitoring RMS (root mean square) seismic noise activity, ground tem-perature sensors set up along the electric lines and a self-leveling borehole insulated tiltmeter supplied by the US Geological Survey were all operational by early March 2010. The ground temperature sensors were installed at depths of 40 and 80 cm. The tiltmeter was installed in a 1-m deep borehole and provide continuous data on the NS and EW components of tilt at a resolution of less than 0.01 μrad. The daily variation in temperature at the sen-sor is less than 0.1 °C. The tiltmeter, its installation and the telemetry were calibrated together using ocean-load corrected solid earth tides. All data except the total field magnetic data are sampled on an 8-channel 24-bit data logger DAK every 2 s and are telemetered in real-time to the PHIVOLCS Buco Observatory.
The second recording site (MCL) was established to the east of MCL (Fig. 1b). A second proton magnetom-eter MCE was installed close to a 3-component fluxgate magnetometer (resolution 0.01 nT) installed in an insu-lated cavity in the ground. Two NS and EW horizontal electric dipoles of lengths 87 and 81 m were connected to non-polarized Pb-PbCl2 electrodes buried at about 80 cm depth. Ground temperature sensors were also installed
at 40 and 80 cm depths with these electrodes and in the center of the array. The eight channels of data were simultaneously recorded every 2 s on an 8-channel 24-bit data logger. Finally, a third data logger was set up on a large boulder rock that protrudes above water surface in the MCL to record the water level and temperature of the MCL. Water level and temperature data were sampled every 15 min. Unfortunately, the water level recorder has not worked well. The stability of the electrodes was routinely checked with periodic ground surface measure-ments (Ladanivskyy et al. 2017). Repeat surveys of self-potential, temperature, differential magnetic field, and leveling were made approximately biannually to provide better information on spatial variations.
Background seismicity, uplift and temperature data: January 2005 to January 2010
During this period, the PHIVOLCS seismic network consisted of a few single-component vertical seismic stations that were used primarily for the determination of the daily rate of volcanic earthquakes. From 2005 to 2010, Taal Volcano regularly exhibited minor seismic swarms that decreased in severity (Fig. 4). However, dur-ing some of these seismic swarms PHIVOLCS raised the volcano alert level to 1 on a 5-level scale, meaning that
low to moderate level of seismicity, ground deforma-tion, increase in ground and water temperatures and increase in bubbling and/or fumarolic activity were being observed. During 2009 and early 2010, seismic activ-ity was generally low. From July to October 2009, a con-tinuous decrease in the ground temperature gradient of 3 °C/m per year was measured at the MCL station with some indications of a similar decrease at DAK. This was followed by variations of 2 °C/m at both sites from Octo-ber 2009 to the start of the seismic crisis in April 2010.
Repeat measurements of three level lines from the TL shoreline on Volcano Island were made by the PHI-VOLCS team approximately biannually after 1999 although more frequently during periods of activity. Just one of these lines (north flank) goes from the shoreline to the crater rim. No noticeable changes were observed on the northern flank between 1999 and 2004. Wide-spread uplift became more evident after January 2005 and between 2005 and mid-2007 with maximum changes of 12 mm, 15 and 6 mm measured along the west, north and southwest radial uphill lines, respectively (M. Lendio personal communication). Simple modeling suggests this uplift could be produced by a pressure or volume change located at a depth of about 5 km under the MCL near the northwestern border of the crater rim. From 2007 to 2010, the deformation remained constant or slightly decreased until the end of March 2010 when it increased sharply.
Other background geophysical data: January 2008 to April 2010
Prior to mid-2009, the horizontal components of the electric fields at DAK and MCL remained on their respective long-term trends, showing only occasional changes less than 200 mV/km in amplitude. Some are apparently linked to changes in the ground temperature and rainfall (Fig. 5) and some are not. From mid-2009, the NS components at both DAK and MCL increased then systematically decreased until early 2010. The EW components did the opposite. Note that NS component of the electric field at DAK is inverted (SN) and is drawn at the top of all data plots in Figs. 5 and 6 for easier com-parison with the other records during the crisis.
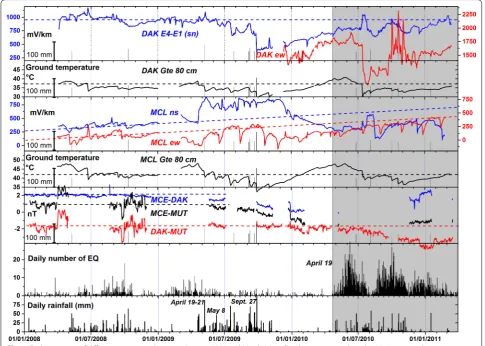
Figure 6 shows daily records between January 2010 and March 2011 of the horizontal north–south and east–west components of electric fields at DAK and MCL stations, the total magnetic field differences between stations DAK and MCE and the Muntinlupa magnetic Observatory MUT, located at 30 km north from the volcano, as well as local magnetic differences between MCE and DAK sta-tions, ground temperature at 80 cm depth at DAK and MCL, daily number of earthquakes provided by PHI-VOLCS, and daily rainfall at Buco Observatory. Dashed
lines through the various parameters are derived from the quiet periods of data during 2008 to mid-2009.
Daily values of the total magnetic field differences [MCE-DAK] are remarkably constant during 2008 and early 2009. No changes at MCE and DAK apparently occurred during this time since the differences [MCE -MUT] and [DAK-MUT], obtained using the reference station MUT some 30-km from Taal, are also constant in spite of some gaps in the data. Although only sparse data were available in TMF from early 2009 to January 2010, the difference [MCE-DAK] decreased by 0.5 nT in June 2009 and by 1.8 nT in December 2009. These changes appear confined to the MCE since the difference [DAK -MUT] remained constant. The magnetic field difference data [DAK-MUT] remained relatively flat from early October 2009 to July 13, 2010, implying that little change was observed at DAK during the initial stages of the 2010 crisis.
To quantify rainfall effects in the electric and mag-netic field data, we compare daily rainfall (bottom plot on Fig. 5) with these data (upper plots on Fig. 5) and also look in detail at any daily rainfall events of more than 50 mm that are plotted on each of the electric and mag-netic field axis. By comparing rainfall and magmag-netic data during 2009 when the seasonal rainfall on Taal Volcano was significantly more than in previous years and in 2010 (Fig. 5) (2007: 1445 mm, 2008: 1218 mm, 2009: 1959 mm, 2010: 1120 mm), it is clear that rainfall does not (and should not) produce any effects in the absolute mag-netic field data. In the electric field data, rainfall effects in 2009, if they occur, are transient in nature and decay quickly (days). Examples are seen at DAK with large rain-falls such as the large May 8, 2009 rainfall (88 mm) and during the typhoon on September 27, 2009 (105 mm). The issue is clearly complex since similar longer-term changes occur at other times not related to rainfall (e.g., late July, September, early December) and dominate the small effects at times of large rainfall.
The April 2010–March 2011 seismovolcanic crisis
Seismicity
November 18 and March 2011 (Period III, November 18 to March 2011). The three periods of seismic activ-ity, each lasting about 3.5 months, resulted in a total of about 3000 felt earthquakes. This number is compara-ble to the total number of earthquakes recorded in the five-year period between 2005 and March 2010.
Long-period (LP) earthquakes usually associated with fluid oscillation in cracks (Chouet 1992; Julian 1994) first appeared after June 2. During the next few weeks, earthquakes with intensities between I and III were felt until July 2. A Level 1 Volcano Alert was first announced by PHIVOLCS on April 29. This was increased to Level 2 on June 8. The level 2 Alert required evacuation of elderly and young people from Volcano Island. The Alert Level was lowered back to 1 on August 2, 2010, and remained here until March 2011.
Level lines
Uplift of 10.3 mm, 11 mm, and 10 mm was observed from January to July 2010 along the west, north and southwest lines, respectively (see line locations in Fig. 9a) (PHIVOLCS personal communication).
Ground tilt recorded on the north flank
The NS and EW components of tilt at DAK monitor tilt of the volcano (Fig. 1b) in approximately radial and tan-gential directions using a tilt convention where positive tilts are down toward the north and the east, respec-tively. During the few weeks following the installation, the tiltmeter exhibited an initial tilt toward the south (i.e., toward the volcano and its crater lake) (Fig. 6).
Small transient changes occurred before the first onset of seismicity, but the first spectacular transient signals of various types were observed on April 29 (Fig. 7a). From
May 15 to June 11, tilt at DAK was systematically down to the east, reaching a maximum amplitude of 27.1 μrad on June 11. From June 11 to July 13, tilt at DAK was sys-tematically down to the north, reaching a maximum amplitude of 30.3 μrad on July 13. Both components then initiated a long-term decrease back toward their respec-tive pre-crisis levels with superimposed north–south tilt perturbations of some months duration which corre-sponded generally to the periods of seismicity (Figs. 5, 6, 8). Tilt had mostly recovered to pre-crisis levels when seismicity ceased in March 2011. Thus, three main phases of tilt variations occurred during the seismovolcanic cri-sis: Phase 1 from April 20 to June 11, Phase 2 from June 11 to July 13, and Phase 3 from July 13 to March 31, 2011.
We investigated the possibility that either tempera-ture, or rainfall, or both might have contaminated the tilt data. On rainfall, we initially focused on the effects of the five largest rainfalls of more than 50 mm on elec-tric field and tilt. The most important of these was the 52 mm event on Jan. 15, 2011, after most volcanic activ-ity had ceased. This event provides a rainfall calibration that allows assessment of tilt responses in the middle of the activity to similar large rain events. We see no con-sistent large signals that we can ascribe to rain in the tilt data. We then looked further at the 12 rainfall events of between 25–50 mm and find these conclusions are not changed. All 17-rain events greater than 25 mm are shown on the time axes of each parameter in Fig. 6 for
easier assessment of the relevance of this issue. Further-more, we note that since there was no rainfall between April 10 and May 1, on June 10, and between July 8 and 13, this indicates that the transient tilt signals during these times cannot be ascribed to rainfall. Furthermore, since the events coincide with changes in seismic activ-ity, deformation and electric signals, they are most likely a consequence of activity within the volcano.
On the issue of the effect of temperature on the ter electronics, the temperature sensitivity of the tiltme-ter components is (0.02% of range)/°C. The daily variation of the temperature at the depth of the tilt sensors is less that 0.1 °C peak-to-peak. Annual temperature changes at this depth are about 10 °C. Expected temperature-related tilt effects are 0.002 μrad daily and 0.2 μrad annu-ally. At short periods (days), the primary signal we see is due to the M2 solid earth tidal loading (~ 0.2 μrad at a 12.4 h period) not temperature (24 h period). Observed long-term signals are far in excess of 0.2 μrad. Thus, temperature cannot be the cause of the rapid signals we observe on different sensors at the exact times of onset of new activity, although the question might be raised whether the overall loose correspondence between tilt and temperature during long periods of volcanic activ-ity may reflect some of the longer-term changes in tilt are caused by temperature. This does not seem to be the case since, if it were true, we should have also seen large changes in tilt for the reversible changes in temperature gradient at DAK and MCL in mid-April (2.5 °C/m) and early May (~ 5 °C/m). Furthermore, while the increase in temperature gradient at both DAK and MCL in late May does correspond to an increase in the EW tilt component (Phase 1), it does not correspond to an increase in the NS tilt component. The temperature gradient stays flat from June 10 to July 13 (Phase 2) with short-term fluctuations but the NS component increases while the EW compo-nent decreases with fluctuations that do not occur at the same time as the gradient fluctuations.
Ground temperature and temperature gradients inside and outside the crater
Figure 5 shows the variations of the ground temperature at 80 cm depth between 2008 and March 2011. Before May 2009, the average temperatures inside and outside the crater rim at DAK and MCL were 35 °C and 42.7 °C, respectively, and annual variations were less than 3 °C. In contrast, ground temperatures reached 40.8 °C and 48 °C during the climax of seismic activity during June 2010.
From mid-2007, average thermal gradients measured at MCL indicated a decrease particularly during mid-2009 to early 2010 that reversed after March 2010 when the crisis began (Fig. 4). Compared to the average ther-mal gradient of 13 °C/m in July 2007, the gradient at MCL in April 2010 was 3.1 °C/m (Figs. 4, 6). Since the temperature gradient and the temperature at the deepest sensor (T80—80 cm deep) at MCL both increased from January to March 2010, it is apparent that increasing temperature at the deeper sensor is driving the gradient measurements. No significant rainfall occurred during this period. At the DAK station, the average gradient was 9 °C/m in 2009 (Fig. 4) and reduced to 0.5 °C/m during April 2010 (Fig. 6). After May 23, the average gradients at MCL and DAK increased rose to mean levels of 8.5 and 7.5 °C/m, respectively, during the seismovolcanic crisis.
During the crisis, intermediate-term (weeks) and short-term transient (7–10 days) changes in thermal gradients were observed at both MCL and DAK. Inter-mediate-term changes can be observed between April 24 and May 23 with gradient changes reaching 6 °C/m on May 3. Smaller changes of about 2–3 °C/m and 2–3 weeks duration occurred several times during the previous three months (see black triangles in Fig. 6). No rainfall occurred during these times. Short-term changes, characterized by sharp transient anomalies of a week to about 10 days duration, occurred on June 10 and July 13 (black diamonds in Fig. 6). No rainfall occurred dur-ing these events. Other short-term changes occurred on
Fig. 7 a Transient signals recorded at 2 s sampling rate during April 29, 2010. Upper plots are from the DAK site. Left: Horizontal components of tilt, NS (black) and EW (blue). Middle: Electric field components, SN (black) and EW (blue). Right: Ground temperature at 40 cm depth (black) and seismic RMS noise (blue). Lower plots are from the MCL site. Left: Horizontal north and east components of the magnetic field, H (blue) and D (black), respectively. Middle: Electric field components, NS (black) and EW (blue). Right: Ground temperature at 40 cm depth (black) and seismic RMS noise (blue). b Transient signals recorded at 2 s sampling rate during June 10, 2010. Upper plots are from the DAK site. Left: Horizontal components of tilt: NS (black) and EW (blue). Middle: Electric field components, SN (black) and EW (blue). Right: Ground temperature at 40 cm depth (black) and seismic RMS noise (blue). Lower plots are from the MCL site. Left: Horizontal north and east components of the magnetic field, H (blue) and D (black), respectively. Middle: Electric field components, NS (black) and EW (blue). Right: Ground temperature at 40 cm depth (black) and seismic RMS noise (blue). c Transient signals recorded at 2 s sampling rate (DAK and MCL) between July 11 and 14, 2010. Upper plots are from the DAK site. Left: Horizontal components of tilt, NS (black) and EW (blue). Middle: SN (black) and EW (blue) electric field components. Right: Ground temperature at 40 cm depth (black) and seismic RMS noise (blue). Lower plots are from the MCL site. Left: Water temperature in Main Crater Lake (15 min. sampling). Middle: Electric field components at MCL, NS (black) and EW (blue). Right: Ground temperature at 40 cm depth (black) at MCL and seismic RMS noise (blue) at DAK
October 1, 19 and 20 and November 1 and 2 as a result of rainfall greater than 25 mm. While these rain events were not seen on the tilt records, they did induce large rapid temperature decreases along fissures (see Fig. 5 and black diamonds in Fig. 6).
Magnetic and electric fields recorded inside and outside the crater
The magnetic field difference data [DAK–MUT] (Fig. 6) remained relatively flat from early October 2009 to July 13, 2010, implying that little change was observed at DAK during the initial stages of the 2010 crisis. From July 13, 2010, to early 2011, DAK decreased systematically by about 2.5 nT before starting to recover back to its 2009 baseline in early 2011. The little data that exists from [MCE–MUT] supports a decrease also at MCE of about 1 nT by late 2010.
The horizontal components of the electric field recorded at MCL and DAK between January 1, 2010, and July 13, 2011, remained generally smooth and sta-ble (Fig. 6). After July 13, 2010, huge electric signals of 800 mV/km in amplitude were seen on both independ-ent arrays in concert with the large temperature changes, transients in temperature gradients (see black triangles in Fig. 6) and changes observed in the tilt data at DAK signaling with the beginning of the deflation (Figs. 6, 8). We return to the question whether the electric field
changes during the crisis could arise from rainfall effects. As noted above, comparison of electric field with rainfall during non-active times (Fig. 5) shows this not to be the case. Where rainfall effects are observed, they are gener-ally small and decay quickly compared to the much larger longer-term changes observed during this volcanoseis-mic crisis.
Short‑term transient signals
In addition to large variations in the different parameters during the main periods of the seismovolcanic crisis, short-term signals of few hours to a few days duration were independently recorded throughout the crisis at both DAK and MCL stations (Fig. 7a–c). These signals sometimes have delays from seconds up to a few tens of minutes between separated stations and appear related to changes in the volcanic activity. Examples of simultane-ous tilt, magnetic, electric, temperature and seismic tran-sient signals recorded at a 2-s sampling rate are shown in Fig. 7a–c. These effects may or may not occur with changes in swarm activity but no detailed correspond-ence exists between these signals and earthquake seismic waves from either local swarm activity or from larger earthquakes that are commonly recorded as seismograms on the tiltmeter. An example of a tilt seismogram from a M5.2 earthquake at 16:46 UT some 220 km to the east can be clearly seen in the tiltmeter records at 16:47 UT in Fig. 7a.
The transient signals shown in Fig. 7a–c likely result from a combination of related elastic, viscoelastic and/ or hydrodynamic processes within the volcano together with more complex fluid flow models in layered porous media such as discussed by Ingebritsen et al. (2015). Unfortunately, we are not able to constrain such models with the few data we have.
The first set of events occurred on April 29, when the DAK tiltmeter showed its first large variations of about 1 μrad down to the southeast (Fig. 7a). Transient elec-tric field signals occurred at the same time at DAK and MCL with amplitudes of 150 and 10 mV/km, respectively. Simultaneously, seismic swarm bursts were recorded at both sites together with a temporary decrease in the ground temperature of 3.2 °C in amplitude at DAK sen-sor located nearby one of the 1992–1994 active fissures. A smooth decrease in temperature was observed a little later at MCL. No noticeable transient magnetic change was observed at that period.
The second set of transient events were recorded on June 10 (Fig. 7b). Tilt signals at DAK indicate a rapid tilt down to the north of almost 5.5 μrad and 4.6 μrad down to the east that largely decayed during the next few hours. This was preceded and followed by changes in electric field at both DAK and MCL of up to 100 mV/
km in amplitude. The tilt changes were accompanied by increased seismic swarm noise and a decrease of 4.8 °C in the ground temperature at DAK together with smaller fluctuations in ground temperature and decreases in both NS and EW electric field components of less than 80 mV/ km at MCL.
The third set of transient events occurred from July 12 to July 14 (Fig. 7c). Tilt was initially down to the north by about 80 μrad at 7:26 UT on July 12. A transient fol-lowed by a decay over several hours occurred at the same time on the east component. This was followed at 17:32 UT on July 13 by large decaying tilt down to the ESE over about 8 h. Seismic activity increased slightly on July 11 at about 5:00 UT and again at 7:26 UT on July 12. Con-currently, water temperature in MCL increased by 0.2 °C while disturbances in the electric fields at DAK and MCL of ~ 300 mV/km are apparent from July 11 to July 14. Step changes and decaying changes in ground temperature occurred at DAK and MCL around 18:00 UT on July 13 (Fig. 7c). Overall, this set of events on July 12–14 indi-cated the start of tilt recovery down to the southwest, consistent with deflation of the volcano (Fig. 6). This turning point in Taal activity was accompanied by a large temperature change in MCL, electric fields disturbances at DAK and MCL, as well as in ground temperatures inside and outside the crater (Fig. 7c).
These three sets of large and inter-correlated transient signals recorded at both DAK and MCL stations identify the start of each of three major phases in the 2010 seis-movolcanic crisis at Taal Volcano: (1) the initial increase in seismicity (April 29), (2) the change within a day (June 10–11) of the tilt from an eastward to a northward direc-tion at DAK for the next month, and (3) the beginning of the deflation of the volcano (July 13). These observa-tions indicate that (1) the 2010 volcanic activity impacted a large part of the volcano centered on the northern part of the crater, (2) major fissures located in the northern part of MCL, the inner part of the crater and the main 1992–94 active fissures located in the northern geother-mal field were simultaneously reactivated during major onsets of activity, and apparently are linked to processes within the volcano at depth during this time (see Zlot-nicki et al. 2017).
Phases of activity and modeling
In summary, three primary episodes of seismicity, tilting, electromagnetic fields, ground temperatures and other parameters were observed during the 2010 crisis on Taal Volcano before the activity finally ended in March 2011 (Fig. 6). Within current knowledge of the existing fault structure and hydrothermal system on Taal Volcano, we now attempt to identify relatively simple but likely
dynamic processes that resulted during this 2010 crisis from these multi-disciplinary data.
The three phases of activity
As discussed above, the daily number of earthquakes can be characterized by three decreasing bay-shapes peri-ods (in gray in Fig. 6). The first period (Period I) starts on April 20, 2010, and ends between August 4 and 8. The second period (Period II) covers the period August 4–8 to November 18, and the last period (Period III) lasts from November 18 to about March 20, 2011.
The temperature gradients measured at MCL and DAK stations show a general correspondence of both shorter-term and longer-shorter-term positive anomalies occurring throughout. The shorter-term anomalies appear to occur sometimes with changes in deformation such as during the onset of the crisis on April 29, on June 10, on July 13 and August 8 (Fig. 6). Overall, the longer-term changes in thermal gradients appear to correspond generally to the three periods of seismic activity: April 29 to August 4 to 8, August 4 to 8 to November 18, and November 18 to March 2011 (Fig. 6). Both temperature gradients show hints of 3-month long variations similar to those seen in tilt and seismicity data at DAK (Fig. 6). At DAK, the peri-ods were from May 23 to about July 25, July 25 to Novem-ber 9, and from NovemNovem-ber 9 to February–March 2011. At MCL, indications of gradient change are from May 23 to about August 16, from August 16 to about November 10, and from November 10 to February–March 2011 (Fig. 6).
The components of DAK tiltmeter show three general phases of activity: Phase 1 tilting, largely down to the east from April 15 to June 11, Phase 2 tilting, largely down to the north from June 11 to July 13 and Phase 3 tilting, largely down to the southwest with superimposed epi-sodes of north then south tilting from July 13 to March 28, 2011 (Fig. 6). This is perhaps best seen in a tilt vec-tor diagram shown in Fig. 8 that is derived from the hori-zontal tilt components as a function of time. The sum of the three different tilt phases indicates apparent overall reversibility of the entire episode (black arrows in Fig. 8), since the final values reached in March 2011 were almost those during the pre-crisis period in April 2010. For sim-ple sources at depth under the MCL, Phase 1 and Phase 2 would be consistent with inflation while Phase 3 after July 13 (Fig. 8) would be consistent with deflation with three sub-episodes (Phases 3a, 3b and 3c) of superimposed inflation/deflation.
southwest tilt (black arrow corresponding to Phase 3b in Fig. 8) on which the sequence of north and then south tilt is superimposed (medium green dots in Fig. 8). Finally, Phase 3c (dark green dots in Fig. 8) more or less follows Period III in seismic activity (Fig. 6) with the general southwest tilt (black arrow corresponding to Phase 3c in Fig. 8) on which a north and then south tilt is super-imposed. As mentioned above, both the tilt at DAK and seismicity mostly recovered to pre-crisis background levels by March 2011. The different behaviors in the tilt data appear to require the existence of at least two active sources of deformation during the crisis.
The electric field recorded at both DAK and MCL sta-tions show that, until July 13, 2010, electric variasta-tions at DAK and MCL generally remain less than 200 mV/km in amplitude (Fig. 6) although some large variations are observed at MCL in mid-May (~ 100 mV/km) at the start of the crisis and at DAK at the peak of the crisis after June 11 (~ 200 mV/km—see black circles in Fig. 6) at the start of Phase 2. This result is consistent with suggestions that electric field changes result largely from near-surface processes. The amplitudes of the observed signals are in agreement with electric field observations on other types of volcanoes where no large eruptive events occur but where thermal ground fluids and gas move upward through fissures and geological interfaces (i.e., Hashi-moto and Tanaka 1995; Michel and Zlotnicki 1998).
After July 13 (start of Phase 3), much larger short-term electric signals appear at both the DAK and MCL sta-tions (Fig. 6). The likely reason is that these electric field changes are more sensitive to shallow triggered activity in the hydrothermal system at depths of less than 2–3 km (Zlotnicki and Nishida 2003; Aizawa 2008; Revil et al. 2008).
Modeling
Modeling of the deformation data
It is not possible to uniquely determine complex model parameters and their evolution with time with so few tilt and level line data. Nevertheless, it is possible to check for consistency between the data observed on Taal Vol-cano with the simplest volcanic inflation/deflation sources while also using whatever independent model constraints we can obtain to guide our choice of models and to help to understand the involved mechanisms. The leveling line data obtained by PHIVOLCS (PHIVOLCS
personal communication) provide some spatial coverage but the data are infrequently sampled and the lines are short. The data indicate that inflation was observed in both data sets when the seismic activity abruptly rose in April 2010. The changes from January to July, 2010 show uplift of about 1.03 cm, 1.1 cm and 1.0 cm, respectively, along the west, north and southeast lines (PHIVOLCS personal communication). These data can be fitted with a simple inflation source at a depth of 5 km just to the northwest of MCL on the N120°E Regional Tectonic axis during the Phase 1 activity (Fig. 9a). This axis is along the direction of surface fissure lines discussed earlier and approximately lines up with locations of recent erup-tions to the northwest (Figs. 1b, 2a, b) (i.e., Alcaraz 1966; Ramos 2001).
We use this source location and depth as the starting point of attempts to fit the observed Phase 1 tilt data since it is consistent with the simplest source necessary to pro-duce the largely eastward tilt observed. The formulation by Davis (1986) for a pressurized prolate ellipsoid of arbi-trary orientation was used for calculation of surface tilts, strains and displacements as a function of source pres-sure and geometry. To reduce the number of variables, the ellipsoid was assumed to be vertical (major axis “a”) and the two semi-minor axes “b” and “c” were assumed to be equal in length and approximately equal in length to the semi-major axis. Thus, we have close to a simple spherical or Mogi elastic source model. We have just too few data to investigate more realistic source models that would use a layered viscoelastic medium and include effects of topography. The shear modulus was assumed to be 1 GPa. Using this model, the observed tilt at DAK during Phase 1 can be matched with a source pressure of 5 MPa located at 5 km depth, with semi-minor axes “b” and “c” equal to 1 km in directions N30°E and N120°E, respectively, and the vertical semi-major axis “a” equal to 2.5 km, as shown in Fig. 9b. We use the method of Marquardt (1963), as described in Bevington (1969), for least-square estimation of nonlinear parameters. Because of the few data we have and to be approximately consist-ent with the displacemconsist-ents indicated on the level lines, we constrain the source to be on the Regional Tectonic Axis and solve for just the position (where x-axis position is a function of the y-axis position) and the semi-major axis “a.” We also carried out a grid search over the area in order to verify the validity of the inversion solutions.
Fig. 9 a Schematic showing locations of proposed sources for Phase 1 and Phase 2 under Taal Volcano and the location of tiltmeter DAK. Leveling lines performed by PHIVOLCS are shown as black dashed lines. b Calculated tilt at DAK during Phase 1 (April to June 11, 2010, Phase 1 in Fig. 8) from an inflation source at a depth of 5 km. The surface projection of this source is 1 km to the east of DAK. See text for source details. c Calculated tilt at DAK during Phase 2 (June 11 to July 13, 2010, Phase 2 in Fig. 8) from an inflation source at a depth of 2.5 km. The surface projection of this source is 1 km to the south of DAK under the MCL. See text for source details
With so few parameters, these models serve only as a loose indication of what likely happened.
Phase 2 tilt from June 11 to July 13 cannot be explained with the same simple pressure source used to explain the tilt in Phase 1. For a simple Mogi-like volume source, uplift and NS tilting at DAK is only possible if a simple source of pressure is to the south of DAK. Since the tilt-ing was largely down to the north, the pressure source is likely to the south in the hydrothermal system under the MCL where other parameters show higher activity than those outside the crater. This is still along the regional tectonic axis on the N120°E fissure line (Fig. 9a). While the source could be at a 5 km depth, other independent data suggest that it is shallower. Firstly, during this same period, the first seismic long-period (LP) events started to occur. Seismic LP events are usually associated with fluid resonance in cracks (Chouet 1992; Julian 1994) and this suggests that fluids in the hydrothermal system are the most likely cause. Second, electric data suggest acti-vation and development of processes in the hydrothermal system largely after June 11. If the system was being pres-sured the most likely depth was below 2.5 km, or below the cap of the hydrothermal system as it was described by magnetotelluric surveys (Yamaya et al. 2013; Alanis et al. 2013). Third, the pulses in ground temperature gra-dients along the EW 1992–1994 fissures at Daang Kas-tila that are linked at depth in the hydrothermal system (Fikos et al. 2012; Zlotnicki et al. 2017) indicate its pro-gressive activation with time (black triangles in Fig. 6). Again, assuming a shear modulus of 1 GPa, a search for solutions was made at about this depth. The observed tilt at DAK during Phase 2 can be matched with a source pressure of 5 MPa, depth of 2.5 km and b=c= 1 km (“c” in the N120°E direction) with a = 1.3 km as shown in Fig. 9c. Thus, we have the concept of two connected sources, the first deeper source (for Phase 1) feeding a second shallower source (for Phase 2) under the hydro-thermal system.
After July 13 (Phase 3), both sources show overall defla-tion from their peak pressure of about 5 MPa from July 13 to March 2011 with three episodes of increased seis-micity and tilt (Phase 3a, 3b, and 3c). The tilt perturba-tions indicate inflation/deflation events that are most likely from the shallower (Phase 2) source since they are observed as north/south tilting. These are likely caused by gas release, fluid transfers and other processes in the hydrothermal system (Kumagai et al. 2014). The three tilt perturbations can be modeled by transient pressure increase and decrease in the deflating Phase 2 source of about 2 MPa. The occurrence of episodes of LP seismic events, geochemical changes, electric field changes and some magnetic field changes in the hydrothermal region during Phase 3 support this concept.
Modeling of the magnetic data
With so few magnetic field data, it is not possible to uniquely determine complex model parameters and their evolution with time. However, we can investigate the degree to which different physical processes are consistent with the data. TMF data are available at DAK during most of the seismovolcanic crisis, but those at MCE are available only before the crisis and during its last stage. Some small decrease in average TMF at DAK is apparent from mid-May to June 10 (Phase 1), but substantial decreases do not occur until after July 13 (i.e., start of Phase 3). Even larger TMF decreases are observed during Phase 3b and 3c. Thermal demagneti-zation (Hashimoto et al. 2008) is one likely reason for the TMF changes. Because the thermal diffusivity of crustal rocks on active volcanoes is ~ 10−6 m2s−1, sur-face thermal effects during intrusive activity are, on large scales, small and slow although they can be locally large near small scale cracks and fissures due to the transport of heat by fluid and gas. For magnetometers measuring the integrated change in magnetization with heat flow during intrusions on volcanoes, the ampli-tude of these signals can reach several tens of nanoTes-las (nT) over months to years (Kanda et al. 2010). Thus, these signals take a long time to emerge and usually are not in phase with the seismic activity and the rapid deformation events.
We do observe TMF changes on Taal with both rapid deformation events (hours) and with longer-term (days to months) events whose onset and recovery lag in phase with seismic and deformation events but are clearly related to the volcanic crisis. Since Taal Volcano is located at low latitude where the inclination of the geo-magnetic field is 11 degrees, the thermogeo-magnetic effects due to uniform demagnetization with heating should have increased the TMF above any newly demagnetized area. This is opposite in sign to what we observe. How-ever, it is possible to generate thermal demagnetization signals or either sign with more complex fluid and gas flow heating sources that might be expected from gas and fluid injection into hydrothermal system but with so few data we cannot realistically explore demagnetization models.
rocks within the volcano during intrusions. Therefore, we first investigate the piezomagnetic signals in relation with the long-term TMF signals.
Analytical piezomagnetic modeling was performed with the same rigidity of the crust as in the deformation modeling (1 GPa). For such mechanically weak materi-als as tuffaceous rocks, stress sensitivity becomes one order of magnitude higher than for common stiff rocks (Hamano 1983; Hamano et al. 1989), and evidence of such stress sensitivity was found in the crust (Sasai 1991a). Stress sensitivity was therefore fixed to 2 GPa−1. Inclination and declination of the magnetic field at Taal are 11° and 0°, respectively. Harada et al. (2005) con-ducted a magnetic survey over the northern geothermal field and its surroundings and obtained an average mag-netization of Taal rocks equal to 5 A/m. Investigations of a number of piezomagnetic Mogi models indicate a Curie isotherm (when ferromagnetic minerals lose their mag-netic properties) to be between 2 and 3 km depth. Thus, we assume an average depth of 2.5 km. This assumption of the Curie isotherm depth beneath Taal Volcano is sup-ported by the modeling of local geothermal anomalies. Furthermore, Taal Lake belongs to “the Macolod Cor-ridor” rift zone (Defant et al. 1988; Ohkura et al. 2001). A geothermal field known as Bulalo is located in this rift zone only 20 km east from Taal Lake. And according to geothermal well-logging, the ground temperature at the depth of 2.5 km is 320 °C which is in agreement with other estimates of Curie isotherm depths (Clemente and Villadolid-Abrigo 1993).
The lower three curves in Fig. 6 show the time varia-tions of tilt and TMF between January 2010 and March 2011. The magnetic data show some small transitory neg-ative changes of − 0.25 nT and − 0.25 nT during Phase 1 and Phase 2, respectively. A significant long-term nega-tive trend of several nanoteslas occurs in Phase 3 from July 13, 2010, to February, 2011, with episodes during the tilt and seismicity pulses of shorter-term negative changes of − 0.5 nT in Phase 3a, − 0.25 nT in Phase 3b and − 1.0 nT in Phase 3c. From February 2011 to late 2012 (not shown in Fig. 6), the TMF recovered to its ini-tial state prior to the crisis.
As pointed out above, the long-term EW tilt pro-gressively recovered at the end of Phase 3 to the level observed in April 2010 prior to the crisis. The NS tilt recovered in a similar manner but showed three suc-cessive oscillatory NS tilt changes accompanying pulses in seismicity during this recovery stage. The long-term deflation implies monotonous shrinkage of both deep and shallow sources. The three oscillatory NS tilt changes indicate episodes of inflation and deflation of the Phase 2 source whose center is 1 km to the South of DAK.
No analytical solution for computing the piezomag-netic field is available for the Davis’ mathematical for-mulation of an inflated ellipsoidal cavity on a volcano (Davis 1986). Therefore, we computed TMF changes with Mogi models taking care to adjust the parame-ters for the different sources (Sasai 1991b). For Phase 1, the spherical source was positioned at 5 km depth with a pressure source equal to 5 MPa. The radius was fixed to 0.874 km, which gives the same volume as the ellipsoid used in the tilt modeling. For Phase 2, the same depth (2.5 km), location and source pressure (5 MPa) used in the tilt modeling were used. For Phase 3, the source pressures for the models were uniformly decreasing but positive pulses of pressure in the Phase 2 model were added and then removed. Piezomagnetic models were calculated for Phases 1 and 2 (Fig. 10— top left and right) and Phases 3a, 3b and 3c at the time of the maximum pressure changes (Fig. 10—bottom left and right). Parameters and resulting data are given in Table 1.
Computed TMF changes due to the Phase 1 source located at 5 km depth (as in the deformation model) show that only negative signals of about − 0.27 nT should be expected at the DAK and MCE stations. This is consistent with the observed change in the [DAK -MUT] difference data of − 0.25 nT (Fig. 6).
The Phase 2 modeling was computed with a source radius of 0.874 km located at 2.5 km depth. It would correspond to the location of the source within the hydrothermal system described by Alanis et al. (2013) and Yamaya et al. (2013). This model shows that we should expect − 1.2 nT at DAK, which is in agreement with the negative sign but significantly larger than the observation (~ − 0.25 nT). The discrepancy between the observation and the model could result from the fact that the simple spherical source does not take into account the elongated source in a vertical direction. Another possible reason is that the Phase 2 source is located in a non-uniform magnetic structure in which both magnetic layer material and the hydrothermal system coexist. The magnetization should be largely reduced within the hydrothermal reservoir, although we assume that it is the same in both the areas. The source has a shape of a semi-spherical cap outside of which strongly magnetized layers surround the weakly magnetized hydrothermal reservoir.
of transient inflation pulse in the Phase 2 source, is shown in the lower left of Fig. 10. The calculated signal of − 0.3 nT is comparable to the initially observed − 0.5 nT step
but if deflation is included in this solution, this calculated signal should approach zero. The ongoing negative trend in the TMF data is not accounted for.
Fig. 10 Upper left: Computed piezomagnetic TMF change associated with the Phase 1 source. See text for source details. Upper right: Computed piezomagnetic TMF change associated with the Phase 2 source inflation. See text for source details. Bottom left: Computed piezomagnetic TMF accompanying an inflation pulse during overall deflation in Phase 3a. Bottom right: Computed piezomagnetic TMF change associated with inflation pulses during overall deflation in Phase 3b and 3c. In these figures, the horizontal position of each pressure source is indicated by black cross
Table 1 Model parameters of the Mogi sources and calculated TMF for Phases 1 and 2 (Fig. 10—top left and right)
and Phases 3a, 3b and 3c at the time of the maximum pressure changes (Fig. 10—bottom left and right)
(x0, y0) is the horizontal location of the center of the Mogi source, D its depth, a its radius and ∆P the internal hydrostatic pressure, respectively. dF are the computed
values. The origin of the horizontal coordinates is taken at (14.01°N, 121.00°E), which is located around the center of the MCL
Phase x0 (km) y0 (km) D (km) a (km) ΔP (MPa) dF (DAK) (nT)
Phase 1 1.24 − 0.83 5.0 0.874 5 − 0.27
Phase 2 0.76 − 0.01 2.5 0.874 5 − 1.2
Phase 3a 1.0 0.0 2.5 1.5 0.165 − 0.3
Phase 3b 1.0 0.0 2.5 1.5 0.65 − 1.3
The inflation/deflation events could result from injec-tion of hot hydrothermal fluids into the porous materi-als of the external part of the hydrothermal system whose location is indicated by the magnetotelluric soundings (Yamaya et al. 2013; Alanis et al. 2013) while overall defla-tion was occurring. According to the 3-D model of the resistivity structure by Alanis et al. (2013), the shape of the hydrothermal reservoir is rather complicated. In com-puting the piezomagnetic field, we assume that the sur-face projection of the source sphere is located 1 km to the north of the center of the MCL on the N120°E Regional Tectonic axis. Spreading of the hydrothermal fluids through the reservoir is a complicated nonlinear process and the most conservative way to compute the associated piezomagnetic field is simply to estimate the piezomag-netic field due to a Mogi model which has the same size and position as the hydrothermal reservoir and gives the same tilt perturbations at DAK station during Phase 3a. The internal pressure change is estimated as 0.165 MPa (Table 1), which produces the EW tilt of 22 μrad similar to that observed at DAK (Fig. 8). The computed variation at DAK is − 0.3 nT (Lower left of Fig. 10). This is slightly smaller than the − 0.5 nT TMF change observed at DAK (Fig. 6). We note that the electric field at DAK changes by about 100–200 mV in the EW component at the start of Phase 2 and all components at DAK and MCL change dramatically (up to 800 mV/km) at the end of Phase 2.
The maximum signals for models that include overall deflation and intermittent inflation-deflation processes in the hydrothermal system during Phases 3b and 3c were computed with a Mogi source location at 2.5 km depth and with a radius of 1.5 km (Table 1) and are shown in Fig. 10 (Lower right). This model produces signals in magnetic field and tilt of − 1.3 nT vs +15 μrad for both Phase 3b and Phase 3c, respectively. The observed sig-nals are − 0.25 nT and + 15 μrad for Phase 3b and − 1.0 nT vs +15 μrad for Phase 3c. The negative trend in TMF of − 0.2 nT/month continues until February 2011 when it reverses and recovers to its pre-crisis level in late 2012. Thus, piezomagnetic contributions to the TMF appear to be overestimated during the Phase 3b inflation/defla-tion and seismicity episodes but do provide a reasonable explanation for Phase 3c. Overall, the piezomagnetic models do appear to be generally consistent with obser-vations during Phase 1 and with inflation/deflation dur-ing Phase 3a and Phase 3c.
A different physical process appears necessary to explain the longer-term decrease (− 2.0 nT from July 13, 2010, to February 2011) and increase (+2.0 nT from Feb-ruary 2011 to late 2012) in the TMF data that is clearly related to the volcanic crisis but is not in phase with the deformation and seismicity. Thermal demagnetiza-tion/remagnetization effects, likely a consequence of
non-uniform heating and cooling when hot fluids and gas are injected into the hydrothermal system, possibly explain the long-term trend and recovery in the TMF data. We do expect these effects but cannot easily model them without detailed knowledge of the evolving plumb-ing system within the hydrothermal system.
The hydrothermal system is not a closed system, and is connected to the bottom of MCL and the northern geothermal field through multiple fissures (Harada et al. 2005; Zlotnicki et al. 2009a; Fikos et al. 2012) where increased activity was observed after June 2010 (see Zlot-nicki et al. 2017). Finally, we note that the TMF at MCE decreased by − 1 nT well in advance of the heaviest rain-fall in late 2009 (Fig. 5). This also might result from ther-mal remagnetization although similar effects are not seen during 2008 rainfall events. Unfortunately, we do not have any continuous deformation data during this time. We note also that CO2 degassing reached its maximum in March 2011 around the end of the Phase 3c activity (Arpa et al. 2013).
Discussion
The entire process of the 2010 seismovolcanic crisis is complex, and we have too few data to fully constrain many of the details involved. Based on calculations from relatively simple deformation models, expected effects in data from the different parameters recorded before and during the 2010 seismovolcanic crisis, the main key fea-tures of the crisis can be reviewed as follows. During the 2005–March 2010 period, the volcano showed general decreasing seismic activity although small annual seismic crises continued to be recorded. In spite of the lowering general activity, leveling surveys done by PHIVOLCS exhibited a persistent but smooth inflation with a center possibly located to the west of the northern crater rim (PHIVOLCS personal communication). We already had observed positive changes in TMF during the 2005–2006 activity of Taal (Harada et al. 2005; Zlotnicki et al. 2009a). We ascribed such changes as due to the ground temper-ature increase at a very shallow depth (~ a few meters), because the local magnetic field also reflects thermal remagnetization (change in the magnetization of rocks with temperature) in near-surface materials (Hashimoto et al. 2008). The decrease in TMF at MCE by − 1 nT in the middle of 2009 (Fig. 5) might be explained by rain-fall cooling down the near-surface materials in the cra-ter although the heaviest rainfall occurred from three big typhoons late in the year without obvious perturbations. This is previously discussed in Sect. 4.5 “Magnetic and electric fields recorded inside and outside the crater.”
29 (see Fig. 7a) and accelerated until June 10. The defor-mation at this time is accompanied by the opening of fis-sures, short-lived decrease in ground temperatures and large transient electric signals as would be expected from reorganization of ground fluid flow. The surface tempera-ture probably drops because, as fissures are opened in the near surface, the ground surface is cooled even though the temperature at greater depths may be increasing. The question arises regarding whether the initial trend in the tilt data indicating tilt toward the volcano should be removed. This was not done since removing the tilt rate from the entire data set prior to the activity would assume that this tilt rate is uniform and ongoing through-out the record and would skew the entire data set. Thus, we would prefer not to remove trends (when we do not know what they are due to) in order to “correct” the raw data and let the reader clearly see the rates, amplitudes and sign changes (Figs. 6, 8) occurring during the activity.
DAK tilt, as well as infrequent dry leveling surveys performed by PHIVOLCS, indicates inflation centered under the northwestern part of the MCL occurred in April–May 2010. Inflation processes (Phase 1) producing tilt down to the east (April to June 11, Fig. 11a) at DAK are likely due to a deep inflation source located at a depth of about 5 km. This location and depth is similar to infla-tion sources indicated by previous seismic and deforma-tion crises (Lowry et al. 2001; Bartel et al. 2003; Galgana et al. 2014). Subsequent tilt (Phase 2) largely to the north (June 11 to July 13, Figs. 8, 11b) is likely due to triggered inflation at a shallower depth under the MCL. Both sources are located along the regional N120°E fissure line (Figs. 1b, 3a, 11a). This triggered inflation during Phase 2 probably resulted from the transfer of magmatic fluids into the hydrothermal system since LP seismic events, commonly related to the oscillation of fluids in cracks (Chouet 1992; Julian 1994), started occurring during this time.
Most probably, pressure in both the deep source at 5 km depth and the shallow inflation sources at about 2.5 km depth in the hydrothermal system reached a peak and started deflating after July 13 (Phase 3). Both overall deflation and inflation/deflation episodes (Phases 3a, 3b, 3c) apparently activated other parts of the hydrothermal system, producing seismic swarms, huge electrical sig-nals, large changes in thermal fluxes, and transitory re-opening of fissures due to fluids expansion in the porous media (Figs. 7c and 11c). This is observed most clearly in the north–south tilting and decaying seismicity data (Figs. 10d, 11c, e). This interpretation is in agreement with the conclusions from magnetotelluric soundings (Yamaya et al. 2013; Alanis et al. 2013), magnetic, self-potential (SP) mapping and electrical resistivity tomog-raphy (Harada et al. 2005; Zlotnicki et al. 2009a; Fikos
et al. 2012), fluids transfers (Kumagai et al. 2014) and soil degassing surveys (Zlotnicki et al. 2009b; Arpa et al. 2013; Maussen et al. 2018). Pressure or volume change in both the deep and shallow sources apparently slowly decayed from July 13 back to about their values in May 2010. This marked the apparent end of the seismovolcanic crisis.
At the time of the crisis, no noticeable extension of the hydrothermal system was detected by self-potential surveys, in particular to the south of MCL (see Zlot-nicki and Nishida (2003) for the methodology; Zlotnicki et al. 2017). This result means that only the two linked geothermal fields located on both sides of the northern crater rim appear to have been reactivated. Transient tilt signals, electric and ground temperatures signals related to specific events (April 29, June 10, July 11–14, and some others later) show that fissures parallel to the crater rim remain active and were broadly and simultane-ously stimulated by the renewal of deep and/or shallow volcanic activity. It undoubtedly shows that the northern part of the volcano located between the active fissures in MCL and the limit of the northern flank geothermal field is composed of mechanically weak and mineral-ized materials, which could “easily” collapse in the crater or be involved in a future large phreatic eruption. The initial volume involved in a phreatic eruption could be indicated by the extent and depth of the largest active fis-sures delineating the northern geothermal field in 2010 and could be as large as 22 Mm3 (0.6 km (EW) × 0.25 km (NS) × 0.3/2 km (deep)). This would correspond to a Vol-canic Explosivity Index of 3 (Newhall and Self 1982).
A second key outcome is indicated by the dynamics of the inflation sources. The 2010–2011 seismovolcanic cri-sis demonstrates that rapid changes in the location and loading rate of deformation can occur rapidly (within a day) on Taal (e.g., June 11, 2010). Moreover, the 2010 seismovolcanic crisis can be considered as a mild crisis as compared to the 1992–1994 seismic crises for instance, and transfer of pressure or volume loading from the deep source (5 km depth) or the shallow source (2.5 km) in the hydrothermal system was maintained for only a month. This result should be taken into account in future erup-tions scenarios and risks mitigation.
Conclusions
again and sharply increased after April 29. The 2010 seismovolcanic crisis ended in March 2011, after three separate periods of seismic swarm activity with numbers
that slowly decreased with time. The crisis was marked by violent short duration events (i.e., April 29, June 11, July 11 to 14) with opening of fissures on the north flank