Nikolaidou et al. Earth, Planets and Space (2018) 70:95 https://doi.org/10.1186/s40623-018-0865-x
FULL PAPER
Impact of different NWM-derived
mapping functions on VLBI and GPS analysis
Thalia Nikolaidou
1*, Kyriakos Balidakis
2, Felipe Nievinski
3, Marcelo Santos
1and Harald Schuh
2,4Abstract
In recent years, numerical weather models have shown the potential to provide a good representation of the electri-cally neutral atmosphere. This fact has been exploited for the modeling of space geodetic observations. The Vienna Mapping Functions 1 (VMF1) are the NWM-based model recommended by the latest IERS Conventions. The VMF1 are being produced 6 hourly based on the European Centre for Medium-Range Weather Forecasts operational model. UNB-VMF1 provide meteorological parameters aiding neutral atmosphere modeling for VLBI and GNSS, based on the same concept but utilizing the Canadian Meteorological Centre model. This study presents comparisons between the VMF1 and the UNB-VMF1 in both delay and position domains, using global networks of VLBI and GPS stations. It is shown that the zenith delays agree better than 3.5 mm (hydrostatic) and 20 mm (wet) which implies an equiva-lent predicted height error of less than 2 mm. In the position domain and VLBI analysis, comparison of the weighted root-mean-square error (wrms) of the height component showed a maximum difference of 1.7 mm. For 48% of the stations, the use of VMF1 reduced the height wrms of the stations by 2.6% on average compared to a respective reduction of 1.7% for 41% of the stations employing the UNB-VMF1. For the subset of VLBI stations participating in a large number of sessions, neither mapping function outranked the other. GPS analysis using Precise Point Positioning had a sub-mm respective difference, while the wrms of the individual solutions had a maximum value of 12 mm for the 1-year-long analysis. A clear advantage of one NWM over the other was not shown, and the statistics proved that the two mapping functions yield equal results in geodetic analysis.
Keywords: Troposphere modeling, Mapping function, VLBI, GPS, VMF1, UNB-VMF1
© The Author(s) 2018. This article is distributed under the terms of the Creative Commons Attribution 4.0 International License (http://creat iveco mmons .org/licen ses/by/4.0/), which permits unrestricted use, distribution, and reproduction in any medium, provided you give appropriate credit to the original author(s) and the source, provide a link to the Creative Commons license, and indicate if changes were made.
Open Access
*Correspondence: Thalia.Nikolaidou@unb.ca
1 Department of Geodesy and Geomatics Engineering, University of New Brunswick, Fredericton, Canada
Full list of author information is available at the end of the article Introduction and background
In precise space geodetic observation analysis, the prop-agation of signals through the Earth’s neutral atmos-phere is one of the main sources of error. Retardation and bending of the electromagnetic signals toward their way down to Earth’s surface, a combined effect referred to as neutral-atmospheric delay, mainly affects the verti-cal coordinate component of an observing station, if not modeled appropriately.
In the processing/analysis of microwave-based obser-vations, the tropospheric delay is approximated by sepa-ration into a hydrostatic (Davis 1986) and a
non-hydrostatic (Mendes 1999; wet1) part, based on the properties of the main constituent gases: mixed humid air in hydrostatic equilibrium and water vapor, respectively.
In the space geodetic literature, the common formula used to represent the tropospheric delay, in a horizon-tally stratified and azimuthally symmetric atmosphere, is:
in which the total slant delay (dt) is a function of the zenith hydrostatic delay (dz
h) projected to the line of sight using a hydrostatic mapping function (mfh) and the zenith wet delay (dz
w) projected using a wet map-ping function (mfw). Thus, the total slant delay (dt) can
1 We shall call the non-hydrostatic complement delay “wet”, following Davis
(1986) hereafter for simplicity.
(1)
be separated into a hydrostatic component and a wet component, referred to as the slant hydrostatic and wet delay, respectively. As shown in MacMillan and Ma (1997), the selection of the mapping function is crucial as it affects almost all the parameters estimated in geodetic computation, with the main effect being on the vertical component.
Among the several evaluations of mapping functions that have been created in an attempt to achieve preci-sion and accuracy, mapping functions derived employing numerical weather model (NWM) have dominated for at least the last decade. Ray tracing directly in an NWM has proven to be the most effective up-to-date tech-nique to derive mapping functions, such as the Vienna Mapping Functions 1 (VMF1) (Boehm et al. 2006b). Compared to the use of (a) spherical harmonics based on NWM, employed by the Global Mapping Function (GMF; Boehm et al. 2006a), (b) standard atmosphere profiles, used by the Niell Mapping Function (NMF; Niell 1996), or (c) the use of specific parameters such as the 200 hPa geopotential height, employed by Isobaric Map-ping Functions (IMF; Niell 2001), discrete ray tracing has proven to yield the most accurate results.
Tesmer et al. (2007) compared four different mapping functions (NMF, GMF, IMF and VMF1) and demon-strated that VMF1 are the most precise ones with respect to station height repeatability. Two years later, they were recommended for all precise geophysical applications (Boehm and VanDam 2009). As of now, VMF1 are rec-ommended by the latest International Earth Rotation and Reference Systems Service (IERS) Conventions (Petit and Luzum 2010) for all precise geophysical applications.
In 2011, the University of New Brunswick (UNB) implemented a VMF12-like service (UNB-VMF1), which provides atmospheric parameters based on the VMF1 concept/type (Urquhart and Santos 2011). UNB-VMF1 serve three main goals:
• To improve the availability of the VMF1 correc-tions so as to maintain the undisrupted production thereof.
• To be compatible with other numerical weather model products (for example, atmospheric pressure loading parameters, generated using NCEP Re-Anal-ysis 1).
• To increase robustness of the International GNSS Service (IGS)/IERS combined products as it utilizes different NWMs and an independent ray-tracing algorithm (Nievinski and Santos 2010) (considering
2 Hereafter we use “(UNB-)VMF1” interchangeably for the mapping
func-tions or the service. The specific meaning can be easily inferred from the context.
that IGS would recommend VMF1 for operational analysis).
Besides the difference in the ray-tracing algorithm, VMF1 and UNB-VMF1 are differentiated by the selec-tion of the source data for the generaselec-tion of the mapping functions, while VMF1 utilize (since 2002) the opera-tional NWM produced by European Centre for Medium-Range Weather Forecasts (ECMWF), UNB-VMF1 make use of NWM produced by the National Oceanic and Atmospheric Administration (NOAA) National Center for Environmental Prediction (NCEP) and the Canadian Meteorological Centre (CMC).
The spatial resolution of the NWM itself directly impacts the ability to model atmospheric conditions effectively. Moreover, since short-term forecasts are able to capture the rapid changes of the surface temperature, especially at areas of complex terrain or along the coast, where rapid changes of orography occur, it is expected that tropospheric corrections would benefit from an NWM of higher spatial and temporal resolution. Thus, this research is focused on the impact of the NWM’s resolution when alternating the two operational mapping functions: VMF1 and UNB-VMF1.
UNB-VMF1 products have been compared with the VMF1 ones in the past by McAdam (2013). In the posi-tion domain, assessing the gridded products for a subset of (32) IGS stations over 11 years, he concluded that the global bias and RMSE of the two mapping functions agree well with each other at the sub-mm level. A latitude-dependent bias and a small trend at equatorial stations were also confirmed by the Precise Point Positioning (PPP) analysis. This study is distinguished from the pre-vious work as it uses site-specific products as opposed to grid based (interpolated) used in the past. The differ-ence in zenith delays between the two product types has proven to reach cm level for VMF1 (Kouba 2008). More-over, the CMC NWM is employed for the production of the UNB-VMF1 products which has shown advantages over the NCEP model (McAdam 2013).
Page 3 of 16 Nikolaidou et al. Earth, Planets and Space (2018) 70:95
VMF1 development
The superiority of the VMF1 compared to other map-ping functions lies on the one hand on the atmospheric data source: NWM is capable of better accounting for weather phenomena compared to other sources such as radiosondes or climatologies and, on the other hand, on the fine tuning of the Marini’s mathematical formulation (Marini 1972). VMF1 map the atmospheric delay from zenith to the line of sight as an elevation-dependent func-tion according to Marini, normalized by Herring (1992), to yield unity at zenith, as:
where mf is the so-called mapping factor, i.e., the evalu-ated mapping function at a certain elevation angle using the specified coefficients. The a coefficient is determined by ray tracing at a fixed elevation angle of 3.3°. For the hydrostatic mapping function, b and c coefficients have been fitted using ray tracing in monthly mean ECMWF 40-year re-analysis data, at nine different elevation angles. For the wet mapping function, the values deter-mined by Niell (1996) have continued to be used as their error in the mapping function derivation is insignificant.
VMF1 employ the ECMWF NWM, which has a tempo-ral resolution of 6 h and uses a downscaled spatial resolu-tion of the model of 2.5° × 2° (Boehm and Schuh 2004). To retrieve a coefficient, ray tracing at an initial elevation angle of 3.3° is performed which produces the elevation angle used in Eq. (2) (geometric elevation angle ~ 3°). Using the zenith and slant path delays and the predefined b and c coefficients and simply inverting the continued fraction form (Eq. 2), the value for the a coefficient is obtained. This procedure is done for the hydrostatic and wet components separately.
UNB‑VMF1 development
While it follows the same concept to produce the atmos-pheric parameters, UNB-VMF1 utilize a different data source for the ray tracing, an independent ray-tracing algorithm and Gaussian Earth radius of curvature. The latter eliminates the hydrostatic mapping function bias that VMF1 shows as a possible result of using constant Earth radius (Urquhart 2010); both VMF1 and UNB-VMF1 are based on a “normal sphere” whereby the center of the sphere is located along the ellipsoidal nor-mal direction.
UNB-VMF1 utilize two different NWMs: (1) NOAA NCEP Re-Analysis I with a global 2.5° × 2° analysis res-olution, initialized every 6 h and (2) the CMC Global Deterministic Prediction System (GDPS) (Côté et al. 1997) with a temporal step of 3 h and a global resolution
(2)
of approximately 0.6°. The latter, as a modern operational model, contains the latest application of atmospheric physics and parameterizations and the spatially based systematic effects are minimized. Therefore, for this study, we will focus on the CMC GDPS.
VMF1 and UNB‑VMF1 products usage
In spite of the improvement in NWM’s quality over the last years, its use alone can be ambiguous due to mode-ling and forecast errors. Thus, for highest accuracy, when processing microwave observations, a residual zenith delay (usually selected to be the wet delay) is estimated, along with the modeled delay attained utilizing the ray-traced products. While the specific a coefficient (hydro-static or wet) is used to evaluate the mapping function at any specified elevation angle, the hydrostatic zenith delay is utilized as an a priori value for the adjustment to fol-low, i.e., the a priori zenith wet delay is set to zero. Both hydrostatic and wet zenith delays can also be used to calibrate the tropospheric model before the adjustment of the observations as well as to access the quality of the results.
Data, products and assessment strategy
The chosen time span was 1 year: 2014. We acquired the site products of the hydrostatic and wet a coefficient and zenith delays for the VMF1 from the online repository3 of TUW for the GPS and VLBI stations. For the respective UNB-VMF1 products, we followed the procedure described in section “VMF1 development” and ray-traced through the CMC GDPS NWM. The primary data/products consisted of the zenith delays and map-ping function coefficients with a temporal resolution of 6 h. The secondary products consisted of the daily series of the coordinates of the stations as a result of employing the mapping factors and zenith delays in the GPS and VLBI analyses.
To assess the performance of the two mapping func-tions on a site basis, the comparison took place in both the delay and the position domain. For the delay domain, 411 globally distributed GPS stations of the IGS network (Dow et al. 2009) were chosen and 61 VLBI stations, participating in the non-intensive IVS-R1 and IVS-R4 VLBI, 24-h-long, sessions. Since the VLBI stations are colocated by GPS stations, only the results of the latter are presented in detail. For the position domain, 18 glob-ally spread GPS stations and 29 VLBI stations were cho-sen for their location characteristics. Both analyses data/ products span the entire year 2014.
Delay domain
Zenith delays and equivalent height error
Zenith delays are inversely correlated with the estimated station heights (and clock offset); the correlation is abso-lute at 90° elevation angle and drops to about half for low elevation angles, i.e., 5°. For that reason, the com-parison of the zenith delays was considered imperative. The VMF1 and UNB-VMF1 products were compared directly. Specifically, the respective zenith hydrostatic and wet delays were differenced to reveal possible sys-tematic effects and biases. The equivalent height error was computed, according to the rule of thumb by Niell (2001) and refined by Boehm and Schuh (2004). The lat-ter predicts that the delay path error at an elevation angle of 5° will map to the station height at a ratio of 1/5. Esti-mating this error provides an approximate indication of the impact of the difference of the mapping functions on position without any real application of the mapping function on geodetic observations.
Mapping factors and nominal slant delays
Mapping factors, defined as the ratio between the slant and zenith delay, contain possible errors of the Marini continued fraction form coefficients: a, b and c. Since VMF1 use constant/empirical values for the b and c coef-ficients, any mismatch in the mapping factors will reflect differences in the a coefficient induced by the ray trac-ing. Assuming azimuthal symmetry of the neutral atmos-phere, the mapping function and zenith delay errors are inversely correlated in geodetic analysis. Therefore, an error in the mapping factor will not only propagate to the station position but also to the estimated delay (and clock offset). Moreover, opposite to the hydrostatic/wet mapping separation errors caused by inaccurate zenith hydrostatic delays, mapping factor errors cannot be compensated in the adjustment (Tregoning and Herring 2006). To assess this error, mapping factors were pro-duced for both VMF1 and UNB-VMF1 at eight eleva-tion angles: 3°, 5°, 10°, 15°, 20°, 30°, 45° and 60°. In order to compare the mapping functions to metric units, the mapping factors were scaled by nominal delays at the elevation angle that showed the maximum differences. The produced nominal slant delays were the product of the evaluated mapping function with the nominal zenith delay: 2300 mm for the hydrostatic and 250 mm for the wet component, respectively.
Position domain
Although a common way to benchmark the solution would be comparing against the IGS station coordinate solution, most of the analysis centers contributing to the combined solution utilize VMF1. Since this choice directly affects the station coordinates, it would make
such a comparison unfair. To acquire an objective rep-resentation of the accuracy of the two solutions (utiliz-ing UNB-VMF1 and VMF1 products), we calculated the weighted root-mean-square error (wrms) of the height component for the 18 globally distributed stations. The daily station position solution was fitted using a linear polynomial in the local geodetic reference frame. Such fitting is necessary to remove possible displacement due to secular deformations primarily long-term crustal motion.
The weighted root-mean-square error was computed according to the formula:
where bi is the estimated height position on the ith day
of year; σi is the formal standard deviation obtained from
the PPP-GAPS or VIeVS@GFZ least-squares adjustment; ˆ
bi is the linear regression polynomial evaluated at the corresponding day of year with b¯ the regression intercept;
v is the regression slope or station velocity; and t is the time (in days). The details for both GPS and VLBI analy-sis are described in the following sections.
GPS Precise Point Positioning analysis
Employing the ray-tracing products (zenith delays and mapping factors) in the UNB’s Global Navigation Satellite System (GNSS) Analysis and Positioning software— GAPS—(Urquhart et al. 2014a, b), in Precise Point Posi-tioning (PPP) (Zumberge et al. 1997) mode, we estimated the position of the station along with the residual zenith (wet) delay, station clock offset and ambiguities. The default modeling of the observations according to the GAPS processing strategy4 was used with cutoff elevation angle of 7°, tropospheric process noise of 5 mm/√h and elevation angle-dependent observation weighting (sine of elevation, correlations ignored). The ray-traced zenith delays and the coefficients were computed using NWM data. Underlying errors in the NWM would certainly propagate into the height estimation during the PPP pro-cess. Thus, to unravel potential systematic errors, the two PPP solutions were processed using identical parametri-zation alternating only the mapping functions (either VMF1 or UNB-VMF1).
For the PPP analysis, the 18 GPS stations of the IGS network that were selected are spread in mid- and high latitudes and vary in altitude and orography. Moreover,
wrms=
Page 5 of 16 Nikolaidou et al. Earth, Planets and Space (2018) 70:95
the wrms was used as an index to the performance of each mapping function realization. The stations’ loca-tions are displayed in Fig. 1, and their locations are shown in Table 1.
VLBI analysis
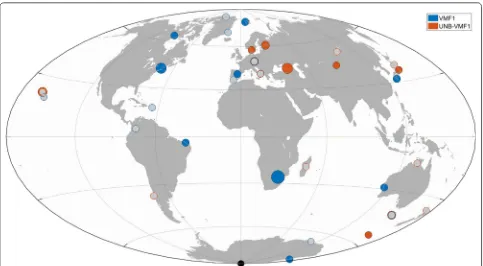
Similarly, the VLBI processing was performed twice, employing the GFZ version of the Vienna VLBI Soft-ware (VieVS@GFZ) (Nilsson et al. 2015) using the stand-ard setup. We present the analysis spanning 1 year of all the IVS-R1 and IVS-R4 VLBI sessions in 2014 for the 29 participating VLBI stations. Their locations are shown in Fig. 2, and their geodetic coordinates are listed in Table 3 of “Appendix.” A summary of both delay and position domain analyses can be found in Table 2.
Results
Delay domain analysis (DDA)5,6
VLBI zenith delay bias, standard deviation and equivalent height error
The zenith hydrostatic delay agreement between UNB-VMF1 and UNB-VMF1 is 2.5 mm or less for 98% of the stations and for 40 of them (71%) less than 2 mm. Their standard deviation varies around 1–2 mm for 91% of the stations and exceeding this number only for 5 stations to maxi-mum 3 mm.
The equivalent height error was computed, according to the refined rule of thumb by Boehm and Schuh (2004). Applying the rule, we observe that all the stations have a mean predicted vertical error of less than 2 mm and the
5 Note: all the limits described in the statistics are inclusive on the left side
but not inclusive on the right side i.e., [a, b).
6 Outliers were excluded because they are not representative of the sample.
Upon further investigation, we have confirmed that some stations had near zero heights even in mountain regions (Boehm, personal communication). Exact details about the discrepancies are unknown as the 2004 height values were not made available.
Fig. 1 Location of the GPS stations analyzed in the position domain
Table 1 Geodetic coordinates of the GPS stations used in the position domain analysis
Station Latitude (°) Longitude (°) Ellipsoidal height (m)
ABPO − 19.02 47.23 1553.0
ALRT 82.49 − 62.34 78.1
BAKE 64.32 − 96.00 4.4
BOGT 4.64 − 74.08 2576.8
CAS1 − 66.28 110.52 22.6
CRO1 17.76 − 64.58 − 31.5
HOB2 − 42.80 147.44 41.1
KOKB 22.13 − 159.66 1167.5
MAC1 − 54.50 158.94 − 6.7
MAT1 40.65 16.70 534.5
MCM4 − 77.84 166.67 98.0
MIZU 39.14 141.13 117.0
MKEA 19.80 − 155.46 3754.7
ROAP 36.46 − 6.21 73.7
SCOR 70.49 − 21.95 128.5
URUM 43.59 87.63 856.1
WTZR 49.14 12.88 666.0
standard deviation is zero for all the stations (maximum value of 0.7 mm). In other words, the rule predicts that, regardless of the mapping function employed, the maxi-mum resulting height error will not exceed 2 mm.
For the zenith wet delay, the absolute bias varies more, up to 19 mm, due to the less predictable value of water vapor. The standard deviation fluctuates around 10–20 mm for 85% of the stations. The equivalent height error of the wet mapping factor is one order of magni-tude less than the hydrostatic one (Boehm et al. 2006b) and is expected to be negligible if one was to employ it in VLBI processing or GPS PPP.
GPS zenith delays bias, standard deviation and equivalent height error
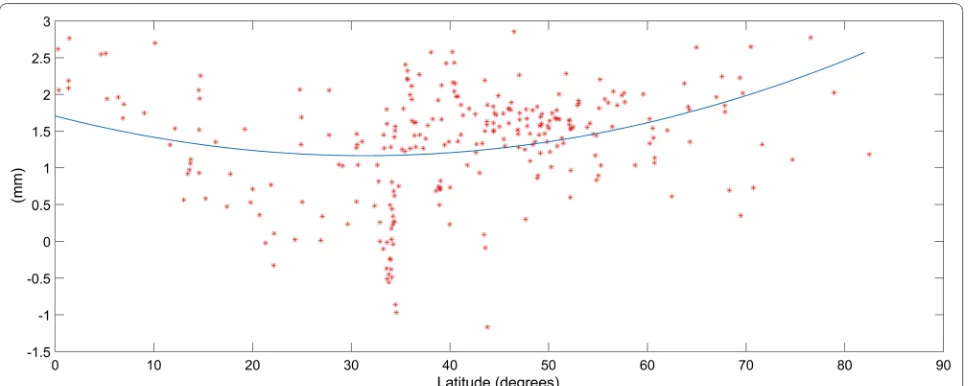
Zenith hydrostatic delays Figure 3 shows the zenith hydrostatic delay bias, between the two mapping fac-tors (UNB-VMF1 minus VMF1) for all the 411 GPS sta-tions. The differences are between − 1.6 and 3.5 mm. It is noticeable that a systematic dependency of the bias with respect to latitude exists and shown by the polyno-mial fitting line. The cause of this latitude-dependent bias is the use of constant radius of curvature for the VMF1 products in contrast to the use of Gaussian Earth radius for the UNB-VMF1 products. A test performed by Urqu-hart et al. (2014a, b) on hydrostatic slant delays, where the UNB-VMF1 employed a spherical Earth of constant radius, yielded similar results to the VMF1, which verifies this hypothesis.
Fig. 2 Location of the VLBI stations analyzed in the position domain
Table 2 Summary of the parameters compared in the analyses and their characteristics
Compared parameters Temporal resolution Units No. GPS stations No. VLBI stations
Delay domain analysis
Zenith hydrostatic delay 6 h mm 411 61
Equivalent height error Zenith wet delay
Hydrostatic mapping factors –
Wet mapping factors Position domain analysis
Weighted root mean square error Daily mm 18 –
Page 7 of 16 Nikolaidou et al. Earth, Planets and Space (2018) 70:95
Equivalent height error The station height error due to the hydrostatic mapping function was computed (Fig. 4). All stations have a (predicted) mean station absolute height error of less than 2.1 mm, and the standard devia-tion is zero for 99% of the stadevia-tions. In other words, regard-less of the mapping function employed the maximum resulting height error is not expected to exceed 2 mm. The largest errors occur at the equatorial zone and fluctu-ate between − 1.5 and − 2 mm. Near the poles, maximum errors of 1.1 mm are reached. It is seen that the station height error has a systematic behavior with respect to lati-tude with positive errors at the poles and negative errors at the equator. As mentioned before, the simplification of the Earth shape to a sphere of constant radius is the cause of this behavior. These findings are in agreement with Urquhart et al. (2014a, b), where 20 GPS stations were processed employing the two mapping functions. Although the errors computed by Urquhart et al. (2014a, b) were absolute for each mapping function and thus big-ger in magnitude, here the two mapping functions were differenced, lessening the discrepancy.
Zenith wet delay For the zenith wet delays, Fig. 5 shows their difference (UNB-VMF1 minus VMF1) with respect to the latitude. The larger dispersion of the values and the magnitude of the bias are notable. The values for the wet delays ranged from − 4.3 to 24 mm for all the stations except IQQE, indicated as the highest value in the figure, where the difference was equal to 34.4 mm. The difference in the NWMs’ (CMC and ECMWF) values is the most likely cause of this discrepancy, as is shown in both the wet delays and the ray-traced a coefficient. The general
larger variation and spread that exists can be attributed to the unpredictable nature of the water vapor content that dominates the wet delay and makes it difficult to model. The discrepancies around the equator and tropics are expected, due to the increase in humidity with decreasing latitude and the fact that the troposphere is thinner at the poles versus the equator (Lutgens and Tarbuck 2010).
GPS mapping factors at different elevation angles and nominal slant delays
In sections (a) and (b), the differences in the mapping fac-tors are presented in a relative (and absolute) manner; following that, in section (c), they are converted to metric system using nominal zenith delays.
Hydrostatic mapping factors The hydrostatic mapping factors agree better than 0.01% (at the ten thousandths level) for an elevation angle of 10° and can be considered identical for any elevation angle above that. At 5° elevation angle, the agreement drops at 0.05% (at the thousandths) and ranges from − 0.0025 to 0.0046. At 3° elevation angle, the maximum differences are noticed which, depend-ing on the station, can reach 0.1% (at the hundredths). The range of those differences is between − 0.0073 and 0.0132. A schematic representation of the hydrostatic mapping function bias at the minimum elevation angle of 3° is displayed in Fig. 6 for all the GPS stations of the delay domain analysis. Although it is highly unlikely that a such low cutoff elevation angle will be employed for geodetic purposes, the figure attempts to depict the maximum pos-sible bias experienced.
Fig. 3 Zenith hydrostatic delay bias (UNB-VMF1 − VMF1) versus latitude for the GPS DDA stations in the Northern Hemisphere; the form is symmet-ric for the Southern Hemisphere ( y=0.001x2−0.034
Wet mapping factors The wet mapping factors between UNB-VMF1 and VMF1 had much more dispersed behav-ior mainly due to the difficulty of accurately predicting the water vapor distribution above the station. Particu-larly, the agreement at the ten thousandths or maximum
difference of 0.02% was reached at elevation of 20° com-pared to the 10° needed for the hydrostatic mapping fac-tors. At 15° and 10° elevation angle, the differences range from − 0.0008 to 0.0012 (maximum difference at 0.03%) and − 0.0027 to 0.0041 (maximum difference at 0.07%),
Fig. 4 Station height error versus latitude due to the hydrostatic mapping function for the GPS DDA stations ( y=1.665 sin(0.03038x−1.582))
Page 9 of 16 Nikolaidou et al. Earth, Planets and Space (2018) 70:95
respectively. The differences increased for 5° elevation angle from − 0.0181 to 0.0281 (maximum difference at 0.3%). It is noticeable that the mapping factor differences for the wet component are one order of magnitude larger compared to the hydrostatic ones. Finally, at 3° elevation angle, the differences rise to 0.0984 starting from − 0.0613 (0.6% maximum difference). In Fig. 7, the wet mapping factor bias for elevation angle of 3° is shown for all the GPS stations of the delay domain analysis.
As shown by the histogram in Fig. 8, the spread of the differences is much larger compared to the hydrostatic mapping factor. A total of 26% of the differences (107 sta-tions) are shared (almost equally) between the bins of dif-ferences varying from 0.020 to 0.025 and from 0.030 to 0.350, indicating a mean bias of a few mm between the two evaluations (UNB-VMF1 and VMF1). Only 18 sta-tions (4%) experienced zero to 0.005 differences, and similar percentiles are recorded for differences up to 0.06.
Fig. 6 Hydrostatic mapping factor (unitless) bias at 3° elevation angle for the GPS DDA stations
However, fewer than 3% of the stations have differences larger than 0.065.
Nominal slant delays In order to compare the mapping factors in a metric system, a scale was applied to them using nominal delays. Specifically, the hydrostatic map-ping factors were scaled using a nominal delay of 2300 and
250 mm for the wet, at the elevation angle that showed the maximum differences.
As shown in the histogram of the slant delays at 3° ele-vation angle (Fig. 9), 61% of the sites (250 stations) expe-rience less than 20 mm difference. Particularly, 31% of the stations differences are between 10 and 20 mm. A total of 17% of the station slant delays agreed well at 5–10 mm
Fig. 8 Histogram of hydrostatic (yellow) and wet (blue) absolute slant factor (unitless) bias at 3° elevation angle for the GPS DDA stations. The larger spread of the wet mapping factor is noticeable along a small positive shift of the mean value
Page 11 of 16 Nikolaidou et al. Earth, Planets and Space (2018) 70:95
and 12% (51 stations) have nearly identical results. Only for 9 stations (2%) the difference exceeds 40 mm.
A schematic representation of the bias for all stations is displayed in Fig. 10. Figure 10 illustrates a small positive bias in the tropics and a negative bias at high latitudes. This bias is mostly the result of using a mean Earth radius for the production of the VMF1 coefficients as opposed to the Gaussian radius model that UNB-VMF1 ray tracer employs (Urquhart et al. 2014a, b; McAdam 2013).
Position domain analysis (PDA)
GPS stations
Figure 11 and Table 4 in “Appendix” show the wrms results for the GPS stations for the entire year 2014, resulting from the PPP analysis using GAPS. For the majority (10) of the stations, the selection of the map-ping function makes no apparent difference in the height component. For the rest of the stations, the results divide between the two mapping functions with four showing a minimal (sub-mm) improvement of 1–2% when using UNB-VMF1 and three when VMF1 was used in the adjustment. The average reduction in the height wrms, for the two mapping functions, is 0.6 and 0.5%, respec-tively. The large discrepancy noted at station ZIMM, i.e., 65% reduction in height wrms when using UNB-VMF1 compared to VMF1, is once again attributed to mis-matching input coordinates at the ray tracing level. The high altitude of ZIMM (957 m) leaves the meteorological parameters particularly sensitive not only to the location
itself, but also to the selection of the NWM: Ground observations and their associated errors will propagate vertically to the higher layers of the atmosphere.
VLBI stations
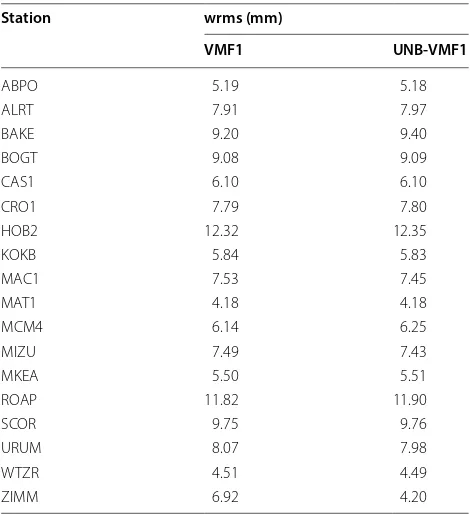
In Fig. 12 and Table 5 in “Appendix”, the wrms results of the height component are shown for the 29 VLBI stations processed using the VIeVS@GFZ. In general, the results agree very well, i.e., less than 1 mm difference of the wrms for 72% of the stations, when alternating the two map-ping functions. For 21% of the stations, the differences reach up to 1.7 mm while exceeding this number, only for 2 sites: HOBART26 and SEJONG; the small number of available observations for these stations is the likely cause of this instability. When using UNB-VMF1, 41% of the stations show a reduction in the height wrms, which reaches up to 1.4 mm (11%) at station ZELENCHK. On the other hand, VMF1 has a maximum reduction in 1.7 mm (26%) at station HARTRAO and reduces the height wrms of 13 more stations (48% of the stations in total). The average reduction in the latter is 2.6% com-pared to 1.7% of the former (UNB-VMF1). However, for the majority of the stations, the difference was at the sub-mm level for both mapping functions. It should be noted that for the subset of stations with large number of solutions, neither mapping function outranked the other. Lastly, the selection of mapping function makes no difference at the stations BADARY, KATH12M and TIGOCONC. It is worth mentioning that the minimum
Fig. 11 GPS PDA stations’ height component wrms in (mm)
Page 13 of 16 Nikolaidou et al. Earth, Planets and Space (2018) 70:95
elevation angle station BADARY observes 12° and only 2% of the observations of station TIGOCONC are below 10°.
Discussion
The slightly larger discrepancies noticed in the wrms of the VLBI analysis compared to the GPS analysis (Tables 4 and 5 in “Appendix”) are most likely a result of the lack of a cutoff elevation angle. Using a cutoff elevation angle of 7°, plus an elevation-dependent weighting scheme of the observations, renders the GPS solution less sensi-tive to effects induced from the lower atmosphere. Thus, even the small differences between the mapping func-tions occurring at low elevation angles are minimized making the results more comparable. The wrms results, although they do not denote which mapping function represents the atmospheric conditions more accurately, provide a good measure of the internal consistency of each realization of Marini’s formula. The results in both GPS and VLBI analysis showed that both mapping func-tions can be considered to provide equal results when it comes to geodetic analysis, as shown by the statistics. For the majority of the sites, the respective wrms difference was less than 1%. With respect to the NWMs, although the performance of the mapping function depends on the location of the site (Fig. 13), CMC (used by UNB-VMF1)
seemed to perform slightly better at the stations near the Atlantic rather than in Europe and Asia where ECMWF (used by VMF1) seemed to prevail. Yet, a higher-density network of stations would benefit an as such location-based assessment of the NWMs. Figure 13 gives an over-all picture of the results for participating GPS and VLBI stations in the analysis.
Conclusion
The choice of mapping function in space geodetic tech-niques affects the slant delays and thus the vertical position, in particular at elevation angles below 20°. In this study, the two state-of-the-art mapping functions, namely the VMF1 and UNB-VMF1, have been consid-ered. Assessment took place in both delay and position domains and on a site-by-site basis.
This study has shown that the two current operational mapping functions, VMF1 and UNB-VMF1, were con-sistent in terms of zenith hydrostatic delay computation with differences below 3.5 mm for the vast majority of the stations examined.
The zenith wet delay differences had a larger spread compared to the hydrostatic ones due to the unpredicta-ble nature of the water vapor content. However, these did not exceed a few centimeters with the maximum values
observed at the equator, where the largest water vapor signals reside.
The equivalent height error due to the hydrostatic map-ping function did not exceed 2 mm globally for any of the GPS stations analyzed herein. However, both the delay components and the height error showed dependency on latitude as a result of different representations of the Earth’s shape in the two ray-tracing procedures.
Comparing the hydrostatic mapping functions, differ-ences were invariable at the tenths; differdiffer-ences at the 0.01 level (unitless) occurred at 3° elevation angle for 87% of the stations. The respective wet mapping function, how-ever, reached twice that value—differences at 0.02 level— for 14% of the stations at the same elevation angle. Yet, owing to the ZWD being at least 10 times smaller than ZHD, the slant delay differences did not exceed 20 mm for 61% of the stations.
In the position domain, results from GPS PPP process-ing usprocess-ing the GAPS software showed that the stations examined yield almost identical results, indicating that both mapping functions perform at the same level. The wrms for the height component did not exceed 12 mm for a yearly analysis, while the differences were at sub-mm level.
In the VLBI data analysis, larger deviations were found, reaching up to 25 mm for the height wrms of the indi-vidual solutions. About half (48%) of the VLBI stations showed a reduction in the height wrms when using the VMF1, ranging from less than 1 to 26% maximum with an average reduction of 2.6%. On the other hand, the use of UNB-VMF1 showed a reduction for 41% of the stations reaching up to 11%, while the average reduction was 1.7%. Moreover, the two mapping functions performed equally for a subset of stations with a large number of solutions available, and for the majority of the rest of the stations, the difference was at the sub-mm level.
Although the wrms discrepancies between the two mapping functions were slightly larger for the VLBI sta-tions, considering the elevation-dependent weighting scheme of the GPS observations, makes the results more comparable. That being said and based on the statistics from both the GPS and VLBI analyses, the two mapping functions can be considered equal for geodetic analysis.
However, as the wrms is an index of the internal con-sistency and not an external validator, further assess-ment using an absolute indicator would be useful. Also, a lengthier VLBI analysis, i.e., spanning several years, would help to obtain more realistic wrms values and eliminate the outliers more efficiently. Still, the use of the weights in the formula corrects for the quality of observations.
For the case of GPS observations, processing using an alternative technique and/or software, perhaps more sen-sitive to the selection of the mapping function or modify-ing the weightmodify-ing scheme of the observations, may reveal results more similar to the VLBI processing.
For the future, further analysis in the position domain including more sites could be beneficial to reach to location-based conclusions regarding the equality of the two NWMs, particularly for stations affected by highly variable weather conditions and/or located at challeng-ing topography, i.e., coastal areas and/or high altitudes. Additionally, expansion of the time span to several years could aid the assessment.
It should be added that in the recent months, the ray tracer employed by VMF1 has been improved and a new set of mapping functions has been developed, called the VMF3 (Landskron and Böhm 2017). Therefore, future work will necessarily involve these new developments.
Abbreviations
CMC: Canadian Meteorological Centre; ECMWF: European Centre for Medium-Range Weather Forecasts; GAPS: Global Navigation Satellite System Analysis and Positioning software; GDPS: Global Deterministic Prediction System; GMF: Global Mapping Function; GNSS: Global Navigation Satellite Systems; GPS: Global Positioning System; IERS: International Earth Rotation and Reference Systems Service; IGS: International GNSS Service; IMF: Isobaric Mapping Func-tions; NCEP: National Center for Environmental Prediction; NMF: Niell Mapping Function; NOAA: National Oceanic and Atmospheric Administration; PPP: Precise Point Positioning; UNB: University of New Brunswick; VieVS@GFZ: GFZ version of the Vienna VLBI Software; VLBI: Very Long Baseline Interferometry; VMF1: Vienna Mapping Functions 1; TUW : Technische Universität Wien.
Authors’ contributions
TN performed the ray tracing to derive the UNB-VMF1 products, carried out the GPS processing and analysis and wrote the main article. KB carried out the VLBI processing and contributed to the post-processing analysis. FN contrib-uted in the design of the delay domain analysis and assisted in issues concern-ing the ray-tracconcern-ing process. MS helped to write the article and supervised the whole project. KB, FN, MS and HS helped to improve the manuscript and provided feedback throughout the project. All authors read and approved the final manuscript.
Author details
1 Department of Geodesy and Geomatics Engineering, University of New Brunswick, Fredericton, Canada. 2 GFZ German Research Centre for Geo-sciences, Space Geodetic Techniques, Potsdam, Germany. 3 Department of Geodesy, Federal University of Rio Grande do Sul, Porto Alegre, Brazil. 4 Institute of Geodesy and Geoinformation Science, Technische Universität Berlin, Berlin, Germany.
Acknowledgements
Page 15 of 16 Nikolaidou et al. Earth, Planets and Space (2018) 70:95
Competing interests
The authors declare that they have no competing interests.
Availability of data and materials
The datasets supporting the conclusions of this article are included within the article and the following links: http://ggosa tm.hg.tuwie n.ac.at/DELAY /, https ://weath er.gc.ca/grib/grib2 _glb_66km_e.html and https ://cddis .nasa.gov/ Data_and_Deriv ed_Produ cts/GNSS/atmos pheri c_produ cts.html.
Ethics approval and consent to participate Not applicable.
Funding
The corresponding author is supported by an offer of financial assistance by University of New Brunswick.
Appendix See Tables 3, 4, 5.
Table 3 Geodetic coordinates of the VLBI position domain analysis stations and number of sessions participated in Station Latitude (°) Longitude (°) Ellipsoidal
height (m) No. of ses‑ sions
AIRA 130.5998624 31.8237944 322.4 11
BADARY 102.2339159 51.7702618 821.6 42
FD-VLBA − 103.9448205 30.6350297 1606.4 5
FORTLEZA − 38.4258585 − 3.8778591 23.1 97
HART15M 27.6842679 − 25.8897363 1409.6 96
HARTRAO 27.6853927 − 25.8897518 1415.7 12
HOBART12 147.4381401 − 42.8055739 41.0 134
HOBART26 147.4405178 − 42.8035860 65.1 19
KATH12M 132.1543178 − 14.3766210 189.0 121
KOKEE − 159.6650977 22.1266380 1176.6 80
LA-VLBA − 106.2455957 35.7751235 1962.4 5
MATERA 16.7040159 40.6495239 543.4 45
MEDICINA 11.6469330 44.5204925 67.2 5
NYALES20 11.8696917 78.9291103 87.3 104
ONSALA60 11.9263544 57.3958363 59.3 30
PIETOWN − 108.1191894 34.3010175 2364.7 6
SC-VLBA − 64.5836330 17.7565811 − 15.0 5
SEJONG 127.3033611 36.5227208 194.6 5
SESHAN25 121.1996589 31.0991628 29.4 7
SVETLOE 29.7819372 60.5323443 86.0 10
SYOWA 39.5862862 − 69.0063246 51.0 6
TIGOCONC − 73.0251485 − 36.8427183 171.0 27
TSUKUB32 140.0887367 36.1031462 84.7 57
WARK12M 174.6632547 − 36.4348089 127.9 66
WESTFORD − 71.4937938 42.6129481 86.8 34
WETTZELL 12.8774503 49.1450079 669.1 113
YARRA12M 115.3456213 − 29.0471648 250.5 119
YEBES40M − 3.0868621 40.5246653 989.1 38
ZELENCHK 41.5651625 43.7878094 1175.0 38
Table 4 GPS PDA stations height component weighted mean square error in (mm)
Publisher’s Note
Springer Nature remains neutral with regard to jurisdictional claims in pub-lished maps and institutional affiliations.
Received: 11 October 2017 Accepted: 18 May 2018
References
Boehm J, Schuh H (2004) Vienna mapping functions in VLBI analyses. Geophys Res Lett 31:L01603. https ://doi.org/10.1029/2003G L0189 84
Boehm J, VanDam T (2009) Modeling deficiencies and modeling based on external data. In: Second GGOS unified analysis workshop, IERS, Grand Hyatt, San Francisco, CA, USA, December 11–12 (Oral presentation) Boehm J, Niell A, Tregoning P, Schuh H (2006a) Global mapping function
(GMF): a new empirical mapping function based on numerical weather model data. Geophys Res Lett 33:L07304. https ://doi.org/10.1029/2005G L0255 46
Boehm J, Werl B, Schuh H (2006b) Troposphere mapping functions for GPS and very long baseline interferometry from European Centre for Medium-Range Weather Forecasts operational analysis data. J Geophys Res Solid Earth. https ://doi.org/10.1029/2005j b0036 29
Côté J, Desmarais J-G, Gravel S, Méthot A, Patoine A, Roch M, Staniforth A (1997) The operational cmc/mrb global environmental multiscale (gem) model. Retrieved from http://colla borat ion.cmc.ec.gc.ca/cmc/CMOI/ produ ct_guide /docs/lib/op_syste ms/doc_opcha nges/E_GEM_t10.pdf. Accessed 30 May 2018
Davis JL (1986) Atmospheric propagation effects on radio interferometry. Ph.D. thesis, Massachusetts Institute of Technology, Department of Earth, Atmospheric, and Planetary Sciences, Cambridge, MA. Also published as AFGL Technical Report 86-0243, U.S. Air Force Geophysics Laboratory, Hanscom AFB, MA. http://hdl.handl e.net/1721.1/27953
Dow JM, Neilan RE, Rizos C (2009) The International GNSS Service in a chang-ing landscape of Global Navigation Satellite Systems. J Geod 83:191–198.
https ://doi.org/10.1007/s0019 0-008-0300-3
Erfani A, Mailhot J, Gravel S, Desgagn M, King P, Sills D, McLennan N, Jacob D (2005) The high resolution limited area version of the Global Environmen-tal Multiscale model and its potential operational applications. Preprints, 11th Conference on Mesoscale Processes, 2428 October 2005, Albuquer-que, NM, American Meteorological Society, 1 M.4
Ghoddousi-Fard R, Dare P, Langley RB (2009) Tropospheric delay gradients from numerical weather prediction models: effects on GPS estimated parameters. GPS Solut 13:281–291. https ://doi.org/10.1007/s1029 1-009-0121-8
Herring TA (1992) Modelling atmospheric delays in the analysis of space geodetic data. In: DeMunk JC, Spoelstra TA (ed) Modelling atmospheric delays in the analysis of space geodetic data, in symposium on refraction of transatmospheric signals in geodesy, Netherlands Geodesy Commis. Ser. 36, edited by J. C. DeMunk and T. A. Spoelstra. Ned. Comm. voor Geod., Delft, pp 157–164
IERS Conventions (2010) Gérard Petit and Brian Luzum (eds.). (IERS Technical Note; 36) Frankfurt am Main: Verlag des Bundesamts für Kartographie und Geodäsie, 2010. ISBN 3-89888-989-6
Kouba J (2008) Implementation and testing of the gridded Vienna Mapping Function 1 (VMF1). J Geod. https ://doi.org/10.1007/s0019 0-007-0170-0
Landskron D, Böhm J (2017) VMF3/GPT3: refined discrete and empirical troposphere mapping functions. J Geod. https ://doi.org/10.1007/s0019 0-017-1066-2
Lutgens F, Tarbuck EJ (2010) The atmosphere: an introduction to meteorology, 11th edn. Pearson, Glenview
MacMillan DS, Ma C (1997) Atmospheric gradients and the VLBI terrestrial and celestial reference frames. Geophys Res Lett 24:453–456. https ://doi. org/10.1029/97GL0 0143
Marini JW (1972) Correction of satellite tracking data for an arbitrary tropo-spheric profile. Radio Sci 7:223–231. https ://doi.org/10.1029/RS007 i002p 00223
McAdam M (2013) Implementation and validation of a UNB Vienna Mapping Functions Service. M.Sc.E. thesis, Department of Geodesy and Geomat-ics Engineering Technical Report No. 284, University of New Brunswick, Fredericton, New Brunswick, Canada
Mendes VB (1999) Modeling the neutral-atmosphere propagation delay in radiometric space techniques. Ph.D. thesis, University of New Brunswick, Dept. of Geodesy and Geomatics Engineering, Fredericton, N.B., Canada, April. Technical Report 199. http://www2.unb.ca/gge/Pubs/Techn icalR eport s.html. Accessed 30 May 2018
Niell AE (1996) Global mapping functions for the atmosphere delay at radio wavelengths. J Geophys Res Solid Earth 101:3227–3246. https ://doi. org/10.1029/95JB0 3048
Niell AE (2000) Improved atmospheric mapping functions for VLBI and GPS. Earth Planets Space 52:699–702. https ://doi.org/10.1186/BF033 52267
Niell A (2001) Preliminary evaluation of atmospheric mapping functions based on numerical weather models. Phys Chem Earth 26:475–480
Niell A, Petrov L (2001) Using a numerical weather model to improve geodesy.
arXiv :physi cs/04011 18v1[physi cs.geo-ph]. 23 Jan 2004
Nievinski FG, Santos MC (2010) Ray-tracing options to mitigate the neutral atmosphere delay in GPS. Geomatica 64:191–207
Nilsson T, Soja B, Karbon M, Heinkelmann R, Schuh H (2015) Application of Kalman filtering in VLBI data analysis. Earth Planets Space. https ://doi. org/10.1186/s4062 3-015-0307-y
Tesmer V, Boehm J, Heinkelmann R, Schuh H (2007) Effect of different tropo-spheric mapping functions on the TRF, CRF and position time-series estimated from VLBI. J Geod 81:409–421. https ://doi.org/10.1007/s0019 0-006-0126-9
Tregoning P, Herring TA (2006) Impact of a priori zenith hydrostatic delay errors on GPS estimates of station heights and zenith total delays. Geophys Res Lett 33(23):L23303. https ://doi.org/10.1029/2006G L0277 06
Urquhart L (2010) Assessment of tropospheric slant factor models: comparison with three dimensional ray-tracing and impact of geodetic positioning. M.Sc.E thesis, University of New Brunswick, Department of Geodesy and Geomatics Engineering, Fredericton, NB, Canada
Urquhart L, Santos MC (2011) Development of a VMF1-like service at UNB. Retrieved from http://unb-vmf1.gge.unb.ca/publi catio ns/VMF1-UNB_ White _paper .pdf. Accessed 30 May 2018
Urquhart L, Nievinski FG, Santos MC (2014a) Assessment of troposphere mapping functions using three-dimensional ray-tracing. GPS Solut 18:345–354. https ://doi.org/10.1007/s1029 1-013-0334-8
Urquhart L, Santos MC, Nievinski FG, Böhm J (2014b) Generation and assess-ment of VMF1-type grids using North-American numerical weather models. In: International association of geodesy symposia, vol 139, pp 3–9). https ://doi.org/10.1007/978-3-642-37222 -3_1