Volume 2006, Article ID 56849, Pages1–10 DOI 10.1155/WCN/2006/56849
Multiuser Interference Mitigation in Noncoherent
UWB Ranging via Nonlinear Filtering
Zafer Sahinoglu1and Ismail Guvenc2
1Mitsubishi Electric Research Labs, 201 Broadway Avenue, Cambridge, MA 02139, USA 2Department of Electrical Engineering, University of South Florida, Tampa, FL 33620, USA
Received 1 September 2005; Revised 13 April 2006; Accepted 13 June 2006
Ranging with energy detectors enables low-cost implementation. However, any interference can be quite detrimental to range accuracy. We develop a method that performs nonlinear filtering on the received signal energy to mitigate multiuser interference (MUI), and we test it over time hopping and direct sequence impulse radio ultra-wideband signals. Simulations conducted over IEEE 802.15.4a residential line of sight ultrawideband multipath channels indicate that nonlinear filtering helps sustain range estimation accuracy in the presence of strong MUI.
Copyright © 2006 Z. Sahinoglu and I. Guvenc. This is an open access article distributed under the Creative Commons Attribution License, which permits unrestricted use, distribution, and reproduction in any medium, provided the original work is properly cited.
1. INTRODUCTION
In time-of-arrival (ToA)-based ranging, the range accuracy depends heavily on how well the ToA of a signal is estimated. Identifying multipath components and finding the leading path is crucial to decrease ranging errors. With its fractional bandwidth of 20%, or at least 500 MHz bandwidth, an ultra-wideband (UWB) signal provides high time resolution mea-sured in nanoseconds, and UWB helps to separate individual multipath components better than narrowband signals [1].
In UWB ranging, tracking of the leading edge is challeng-ing due to a vast number of multipaths and the fact that the line-of-sight (LoS) path may not have the highest amplitude. Traditionally, UWB approaches based on coherent reception require many rake fingers in order to combine energy from the received signal [2]. However, there is a strong desire to drive down UWB radio cost. This has led to an increased in-terest in alternative receiver techniques for UWB that do not require the hardware complexity of coherent rake receptions. One intuitive approach is a trade-offbetween high per-formance coherent receivers and low-complexity noncoher-ent receivers [3]. However, one of the major drawbacks of a noncoherent receiver is its performance in the presence of multiuser interference (MUI). In a multiuser network, nals from multiple devices may interfere with a desired sig-nal and deteriorate the range error drastically. This is because interference suppression techniques such as CDMA are not readily applicable to simple noncoherent receivers. Typically, processing gain is obtained by coherently combining received
signal energy according to transmitted time hopping or DS patterns [4]. However, in coherent energy combining, even a small amount of interference energy may be construed as a leading edge. Therefore, prior to coherent energy combining, it is prudent to remove as much MUI energy as possible.
In this paper, our scope is to make ranging via nonco-herent radios resilient to MUI. We focus on simple energy detectors, and propose a MUI mitigation technique for time-hopping impulse radio (TH-IR) [5] and direct sequence im-pulse radio (DS-IR) UWB systems to sustain submeter range accuracy when MUI is present.
The remainder of this paper is organized as follows. In
Section 2, the literature on UWB ranging is reviewed. In
Section 3, the TH-IR and DS-IR UWB signal models are
given and then the proposed receiver architecture is de-scribed. InSection 4, MUI mitigation via nonlinear energy filtering is explained. Section 5 is allocated to the discus-sion of simulation results. Finally, the paper concludes in
Section 6with a summary of our future work.
2. TOA-BASED UWB RANGING
Tsym=512 ns
Tc=6 ns bk=0 Tp=4 ns bk=1
Tppm=256 ns
(a) DS-IR Tsym=512 ns
Tp=4 ns=Tc
Tf =128 ns
(b) TH-IR
Figure1: Illustration of transmitted waveforms and simulation parameters for (a) DS-IR and (b) TH-IR.
is determined based on the statistics of the amplitude ra-tio and the delay between the strongest and the leading paths. However, the method requires very high sampling rates on the order of the Nyquist rate. In [13], the authors relax the sampling rate requirements and propose a simpler threshold-based detection technique. In [14], the problem is approached as a break-point estimation for signal pres-ence, where temporal correlation arising from the transmit-ted pulse is used to accurately partition the received signal.
Acquisition and ToA estimation can generally be achieved by using various transceiver types; for example, matched filters (or stored-reference receivers), transmitted reference receivers, and energy detectors (ED) [6,15]. The use of energy detectors for synchronization and ToA estima-tion in UWB systems has been investigated in [15–17]. ED receivers using threshold-based ToA estimation techniques are discussed in [18–20], a multiscale product approach that improves the ranging accuracy was investigated in [21], and likelihood-based techniques are proposed in [15]. Two-step hybrid ToA estimation via ED and matched filters is also studied in [22,23], where the energy-detection step provides a coarse ToA estimate, and the matched-filtering step refines the estimate. In [24], a matched-filter receiver’s ability to dif-ferentiate between the desired user signal and interference for TH-IR UWB during synchronization is analyzed.
Our literature survey indicates that the ToA estimation problem for IR-UWB has been analyzed without consider-ation of MUI. Note that although MUI mitigconsider-ation is inves-tigated extensively for IR-UWB systems for symbol detec-tion [25–28], to the best of our knowledge, there is no ref-erence that addresses interfref-erence mitigation for ToA estima-tion with noncoherent UWB radios. This work is intended to fill that gap.
3. RANGING SIGNAL WAVEFORMS AND
RECEIVER FRONT-END
In [19], four different waveforms were compared from the ranging perspective. We adopt two of these: DS-IR and
BPF LNA ()
2
ts
z[n]
z[n] 1D to 2D converter
Nonlinear filter
2D to 1D converter
TOA estimator Energy matrix
generation
Interference removal
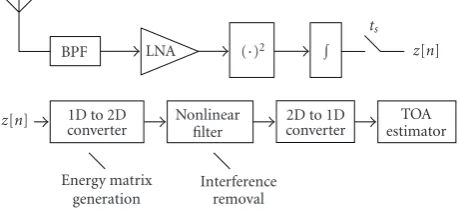
Figure2: Illustration of the energy imaging ranging receiver while processing ED outputs.
TH-IR (see Figure 1), which are currently under consider-ation for standardizconsider-ation in the IEEE 802.15.4a Task Group.
Each IEEE 802.15.4a packet contains a preamble that consists of multiple repetition of a base symbol waveform; the preamble is used for acquisition/syncronization and ranging. We adopt the IEEE 802.15.4a terminology and use the following notations in the sequel:Es(k)denotes the symbol energy from thekth user,Nsymis the number of symbol rep-etition within the preamble,ωis the transmitted pulse shape with unit energy,Tsymis the symbol duration,Tpis the pulse duration,kis the TOA of thekth user’s signal andηis the zero-mean AWGN with varianceσ2
n =N0/2.Lkdenotes the total number of multipath components for thekth user,γl,k andτl,k represent the amplitude and delay of thelth multi-path component for thekth user, respectively, andNsis the total number of pulses per symbol.
A receiver can process the preamble by either template matching (coherent) or energy detection (ED). Although co-herent ranging is superior, the ED receiver offers advantages such as simplicity, operability at sub-Nyquist sampling rates (which determines the range resolution), and low cost. They are also more resilient to pulse-shape distortion.
The ED receiver we study in this paper is illustrated in
samples periodically. We denote these generated energy sam-ples as z[n], and the sampling interval and the number of samples per symbol astsandnb =Tsym/ts, respectively. The z[n] are then regrouped into a 2D matrix.
Once a matrix is formed, it is passed through a nonlinear filter to enhance desired signal energy parts and remove the MUI. Afterwards, the matrix is converted back to 1D time series to locate the leading edge, by means of adaptive search-back and threshold techniques. In what follows, we present signal models for DS-IR and TH-IR systems.
3.1. DS-IR
In DS-IR, a symbol interval is divided into two halves. A group of closely spaced pulses calledburstis transmitted ei-ther in the first or the second half in a pseudorandom pat-tern. With such an orthogonal burst positioning, ranging can be performed in the presence of multiple simultaneously op-erating devices. The received DS-IR symbol waveform from userkcan be written as
ω(ds)mp,k(t)= andTc(ds)is the chip duration (pulse repetition interval) such thatTc(ds)≥Tp. The polarities of the pulses in a burst are used to convey data for coherent reception. Therefore, the spacing between the pulses enables coherent receivers to demodulate the data.
If there areKsimultaneously transmitting users, the re-ceived signal would be
r(ds)(t)=K is the modulation index (i.e., delay) for pulse-burst position modulation (PPM). Note that varying Tppm would change the interburst interval. Hence, multiple orthogonal wave-forms can be generated, and each can be assigned to users of different networks.
The ED output samples at the desired receiver with the DS-IR waveforms is
In TH-IR, a symbol is divided into virtual time intervalsTf calledframes, which is further decomposed into smaller time slotsTc(th)calledchips. A single pulse is transmitted in each frame on a chip location specified by a user-specific pseudo-random time-hopping code. The received TH-IR signal from
userkis codes of userk, respectively. IfKusers are transmittingNsym symbols simultaneously, each with a unique TH code, the re-ceived signal by the desired user becomes
r(th)(t)=
The collected energy samples at the ED receiver would be
z(th)[n]= nts (n−1)ts
r(th)(t)2dt. (6)
3.3. Conventional energy combining (Conv)
A conventional receiver coherently combines the energies over Nsym symbols to improve the signal-to-noise ratio (SNR) using the bit sequence of the desired user in the DS-IR case,1and overNsym×N
spulse positions using the TH se-quences of the desired user in the TH-IR case. Then, a search-back algorithm is applied to locate the leading signal energy. In this paper, we adopt the searchback scheme presented in [19]. With the assumption that the receiver is perfectly synchronized to the strongest energy sample, the algorithm tries to identify the leading edge by searching the samples backward within a predetermined window starting from the strongest sample. In non-LoS environments, the strongest path may arrive as much as 60 ns after the first path [29]. At 4 ns sampling period, this would correspond to 15 samples. Therefore, in the searchback algorithm (seeAlgorithm 1), it would be sufficient to haveW=15.
Each sample within the searchback window is compared to a threshold. Even if it is smaller than the threshold, the algorithm does not terminate; and it allows up towcls con-secutive noise-only samples. This is because clustering of the multipath components yields noise-only regions between the clusters. The threshold ξ that corresponds to a fixed Pfa is given by2[19]
ξ=σedQ−11−1−Pfa1/wcls
+μed, (7)
whereμedandσed are the mean and the variance of noise-only samples. The optimal threshold is a function ofwcls.
1For DS-IR, we assume that we do not combine energies from different pulses within the same symbol in order to avoid weakening the leading edge due to multipath effects [19].
2We defineP
nmax: the index of the strongest energy sample, nle:=the index of the first signal energy sample, W: the searchback window length,
ξ:=noise-based threshold, Leti=nmax,wcls=2,
while i≥nmax−W
if z[i]≥ξorz[i−1]≥ξorz[i−2]≥ξ, i=i−1,
else
break,
endif endwhile
Returnnle=i+ 1.
Algorithm1: Pseudocode for the adaptive searchback algorithm to locate the leading signal energy.
4. ENERGY MATRIX FORMATION
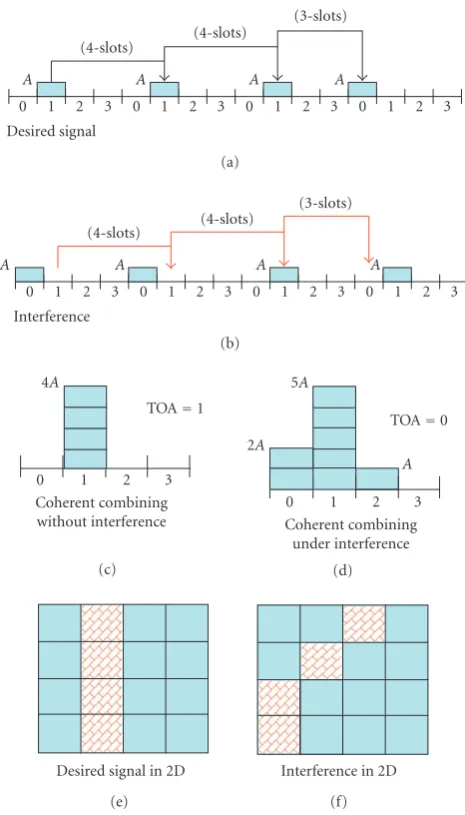
SNR is one of the parameters that range estimation accu-racy heavily depends on. Although the SNR can be improved via processing gain by coherently combining received signal energy samples [22],Figure 3 illustrates poor ranging per-formance after coherent energy combining in the presence of MUI. In the given TH-IR example, the symbol consists of four frames with signal energy integrated and sampled at a period that produces four samples in each frame and 16 samples in total per symbol. The TH code of the desired sig-nal is{0, 4, 4, 3}, and that of the interference is{0, 4, 5, 4}. Coherent combining requires energy samplesz[n] of the re-ceived signal to be combined in accordance with the matched TH code.Figure 3produces the combined energy valuesE[n] such thatE[n]=z[n+0]+z[n+4]+z[n+4+4]+z[n+4+4+3], where 0≤n≤3, assuming that TOA ambiguity is as much as the frame duration. If there is no interference,E[1]=4A andE[n]=0 forn /=1 and the TOA index is 1. In the pres-ence of interferpres-ence, the time of arrival information is very likely impacted, and it is easy to see in the example that TOA index becomes 0 becauseE[0]=2A(seeFigure 3(d)).
We have now illustrated that signal design itself and co-herent energy combining is not sufficient to deal with the detrimental impact of interference. A solution simply lies in considering the collected energy samples from a different view: a two-dimensional energy matrix. Let us create a so-called energy matrixZof sizeM×N, whereMis the number of frames processed and N the number of energy samples collected from each frame. Referring to the previous exam-ple, the size ofZwould be 4×4 and populated as follows:
Z= ⎛ ⎜ ⎜ ⎜ ⎝
z[0 + 11] z[1 + 11] z[2 + 11] z[3 + 11] z[0 + 8] z[1 + 8] z[2 + 8] z[3 + 8] z[0 + 4] z[1 + 4] z[2 + 4] z[3 + 4] z[0 + 0] z[1 + 0] z[2 + 0] z[3 + 0]
⎞ ⎟ ⎟ ⎟ ⎠. (8)
Filling out each column ofZwith samples grouped accord-ing to the received signal’s TH pattern forms vertical lines whenever signal energy is present in all of those samples (Figure 3(e)). The detection of the left-most vertical line
(4-slots) (4-slots)
(3-slots)
A A A A
Desired signal
0 1 2 3 0 1 2 3 0 1 2 3 0 1 2 3
(a)
(4-slots) (4-slots)
(3-slots)
A A A A
Interference
0 1 2 3 0 1 2 3 0 1 2 3 0 1 2 3
(b)
TOA=1 4A
Coherent combining without interference
0 1 2 3
(c)
TOA=0 2A
5A
A
Coherent combining under interference
0 1 2 3
(d)
Desired signal in 2D (e)
Interference in 2D (f)
Figure3: Illustration of coherent energy combining in 1D (a) en-ergy samples from TH-IR desired user, (b) enen-ergy samples from TH-IR interference, (c) coherent combining of energy samples without interference, (d) coherent combining of energy samples with interference, (e) energy image of the desired signal,Z, and (f) energy image of the interference.
gives the time index of the first arriving signal energy. If the interference follows a different TH pattern, intuitively the en-ergy matrix of the interference does not form a vertical line (Figure 3(f)).
Convdoes not account for the MUI, and it directly ag-gregates the energy samples. This is equivalent to summing the rows ofZalong each column, yielding an energy vector. Note that the column sum of the matrix inFigure 3(e) gen-erates the energy vector inFigure 3(c), and column-sum of (e) + (f) results inFigure 3(d).
120 100 80 60 40 20
Column index 80
70 60 50 40 30 20 10
R
o
w
inde
x
Multiuser interference
Self interference TOA of
desired signal
Figure4: Energy image for the DS-IR (E(des)b /N0 = 16 dB,E(int)b / N0=10 dB,tc=4 ns,Ns=4,Tsym=512 ns,Tppm=256 ns,nb =
128). The row index corresponds to symbols and the column index corresponds to the samples within a symbol interval.
whereabout of interference energy, and nonlinear filters can be applied onto the matrix to mitigate this interference. The following subsections explain how to form an energy matrix from DS-IR and TH-IR waveforms.
4.1. Energy matrix of DS-IR
Letλdenote the row index (which is also the symbol index), andκdenote the column index of the matrix. Then, the sam-ples in (3) can be used to populate the matrix as follows:
Z(ds)λ,κ=z(ds)
κ+ (λ−1)nb+bλ,1Tppm ts
, (9)
where 1≤λ≤Nsymand 1≤κ≤nb.
A typical energy matrix of a DS-IR signal after passing through an IEEE 802.15.4a CM1 channel is given inFigure 4
while theEb/N0is 16 dB for the desired received signal and 10 dB for the interference. Clearly, the desired signal forms a vertical line indicating multipath components, whereas the interference pattern is intermittent.
Self-interference may also be present in the energy ma-trix. This occurs when only some of the samples of a column actually overlap with the energy from bursts.
The energy vectorz(ds)that theConvreceiver generates is equivalent to the column-sum ofZ(ds),
z(ds)=1NsymZ
(ds), (10)
where1Nsymis a row vector of all ones.
4.2. Energy matrix of TH-IR
In TH-IR, energy samples given in (6) are grouped together according to the transmitted TH code, and samples of the same group are used to populate a column of the energy
120 100 80 60 40 20
Column index 300
250 200 150 100 50
R
o
w
inde
x
Self and multiuser interference TOA of desired signal
Figure5: Energy image for the TH-IR (E(des)b /N0 =16 dB,E(int)b / N0 =10 dB,tc =4 ns,Ns =4,Tsym =512 ns,Tf =128 ns,nb =
128).
matrixZ(th). As a result, there areN
s×Nsymrows,
Z(th)λ(j),κ=z(th)
κ+ (λ−1)nb+jTf ts
+cj,1Tc ts
,
(11)
whereλ(j)=Ns(λ−1)+j, andj∈ {1, 2,. . .,Ns}. We assume thatTc is an integer multiple oftsto allow the collection of the energies over integer number of pulses.
A typical energy matrix of a TH-IR signal after passing through an IEEE 802.15.4a CM1 channel is given inFigure 5. TheEb/N0is 16 dB for the desired received signal and 10 dB for the interference. Note that MUI and self-interference causes short discrete lines. The actual ToA corresponds to the left-most continuous vertical line inZ(th).
A cause of the self-interference is the imperfect autocor-relation of the TH codes. Note that the energy samples of a column are grouped according to the desired user’s TH code. It is possible that only some of the grouped samples contain energy from the received signal due to a partial overlap with the signal’s TH pattern. Especially if the uncertainty region for the ToA is larger thanTf, the energy collection process would cause more self-interference. Nonlinear filters would not be able to distinguish self-interference from MUI.
Furthermore, to suppress noiseNimgmatrices can be su-perposed, relying on the assumption that the statistics of in-terference and noise are stationary. TheConvwould column-sumZ(th)and would perform edge detection onz(th),
z(th)=1 NsNsymZ
(th). (12)
5. NONLINEAR MATRIX FILTERING
superscript of the energy matrix for DS-IR and TH-IR, and refer to it asZ.
5.1. Minimum filter: min
To remove outliers inZ, which are most likely due to inter-ference, we apply lengthW minimum filter along each col-umn. The minimum filter replaces the center sample with the minimum of the samples within the filter window. Then, the elements of the new energy matrixZ(min)become
Z(min)λ,κ
=min
Zλ,κ,Zλ+ 1,κ,. . .,Zλ+W−1,κ,
(13)
where λ ∈ {1, 2,. . .,Nsym −W + 1} for DS-IR and λ ∈ {1, 2,. . .,NsNsym−W+1}for TH-IR. Once the interference is removed,Z(min)is converted to a vector by the column-sum operation,
z(ds,min)=1Nsym−W+1Z (ds,min),
z(th,min)=1
NsNsym−W+1Z
(th,min), (14)
where Z(ds,min)indicates Minfiltered matrix for the DS-IR andZ(th,min) for the TH-IR. Note that while it significantly removes the interference, theMinfilter may also degrade the desired signal.
5.2. Median filter: median
Median filters are special cases of stack filters that have been widely used in digital image and signal processing [30,31] to remove singularities caused by noise. A median filter re-places the center value in a given data set with the median of the set. A longer median filter makes output noise more colored and is less effective to mitigate interference because any unsuppressed interference energy may propagate onto its neighboring samples. We use a length 3 median filter in our simulations and refer to it asMedian. One way to prevent col-oring of output noise is to apply the median filter in nonover-lapping windows. In the appendix, we quantify the impact of nonoverlapping median filtering on detection performance of DC signals in white Gaussian noise to provide some in-sight into more complex detection problems. In (15),Z(med) is the energy matrix at the output of the median filter,
Z(med)λ,κ
=median
Zλ,κ,Zλ+ 1,κ,. . .,Zλ+W−1,κ.
(15)
After convertingZ(med)into an energy vector, we have
z(ds,med)=1
Nsym−W+1Z (ds,med),
z(th,med)=1NsNsym−W+1Z (th,med)
.
(16)
The leading edge search is performed onz(ds,med)for DS-IR waveforms and onz(th,med)for TH-IR waveforms.
Note that both minimum and median filtering add to the (low) complexity of an energy-detection receiver. As-sume that z[n] are provided by a 16- bit ADC. Then, the memory requirement for storing Z of size M×N would be 2MN bytes. It is known that sorting W numerals has an inherent computational complexity of O(WlogW). Thus, the overall complexity of applyingMedianorMinwould be M(N−W+ 1)O(WlogW).
6. SIMULATION RESULTS
The DS-IR and TH-IR signals are transmitted over IEEE 802.15.4a CM1 (residential line-of-sight) channels. For per-formance comparison, we use mean absolute error (MAE) of ToA estimations over 1000 realizations. DS-IR and TH-IR symbol waveforms of length 512 ns are considered; the other simulation settings are as follows: Tsym = 512 ns, Tppm =
256 ns, Tf = 128 ns, Tp = 4 ns, wcls = 2, andTc = 4 ns for TH-IR and 6 ns for DS-IR, and the integration interval is 4 ns. Energy images are obtained using 80 symbols (yielding 80 rows for DS-IR, and 320 rows for TH-IR), and the images are further assumed to be averaged over 250 realizations.3 For TH-IR, the time-hopping sequence for the desired user is cj,1=[1, 1, 4, 2], and for the interfering usercj,2=[1, 4, 2, 1], where there areTf/Tc=64 chip positions per frame.4
We compare the ranging accuracy of the searchback al-gorithm described in Algorithm 1under different interfer-ence levels. LetE(1)andE(2)denote the symbol energies ceived from the desired user and the interfering user, re-spectively (we also use Eb for the desired user’s bit en-ergy). Then, we simulate the interference levels, whereE(2)/
N0 ∈ {−∞, 0, 5, 10}dB. Energy matrices are constructed,
and MAEs before (Conv) and after nonlinear filtering (Min,
Median) are obtained for all cases using a nonlinear filter window length of 3.
6.1. DS-IR
The MAE results inFigure 6(a)show that in the absence of MUI, theConvandMedianoutperforms Minby achieving MAE as low as 2 ns at Eb/N0 values less than 14 dB. This makes sense intuitively, because when noise is the dominant term,Minpenalizes the signal.
However, at higherEb/N0, the MAE ofMinis better than those of bothConvandMedian, because at highEb/N0, self-interference becomes the dominant factor, and (for certain channel realizations) the multipath components from a pre-vious symbol may extend into the searchback window and still degrade the ranging accuracy ofConvandMedian(see
Figure 4). Minimum filtering remains effective to mitigate self-interference at high SNRs.
3We assume that the bit sequences used in DS-IR repeat at every 80 sym-bols; the total preamble length considered for ranging purposes is there-fore 512×80×250≈10 ms.
22 20 18 16 14 12 10 8 6 4
Eb/N0(dB) 100
101
MAE
(ns)
No interference
Conv Min Median
(a)
22 20 18 16 14 12 10 8 6 4
Eb/N0(dB) 100
101
MAE
(ns)
E(2)b /N0=0 dB
Conv Min Median
(b)
Figure6: MAEs for DS-IR: (a) no interference, and (b)Eb(2)/N0 = 0 dB (wcls=2).
The MAEs of the three approaches atE(2)/N0 ∈ {0, 5, 10}dB are presented in Figures6(b),7(a), and7(b), respec-tively. The MAE error floors of Conv and Medianare ap-proximately 5 ns, 7 ns, and 9 ns at interference levels of 0 dB, 5 dB, and 10 dB, respectively. Whereas,Minprovides a much smaller error floor. When E(2)/N0 = 0 dB and E(1)/N0 is higher than 9 dB,Mincan achieve the MAE of 3 ns (subme-ter range accuracy).Minrequires at leastE(1)/N0=10 dB at E(2)/N0 =5 dB to keep the MAE below 3 ns, andE(1)/N0 = 16 dB atE(2)/N0=10 dB.
6.2. TH-IR
In general, the TH-IR waveform yields higher MAEs when compared to the DS-IR for the simulated set of parameters. This can be explained by higher self-interference from auto-correlation sidelobes of TH-IR waveforms; although TH se-quences with a large zero correlation zones are used in our simulations, for the channels with large maximum excess de-lays, the performance is degraded. In the DS-IR case, Min
effectively suppresses self-interference even at highEb/N0. An interesting observation with TH-IR waveforms is that there exists an optimumEb/N0and the MAE starts increas-ing beyond the optimum even if there is no MUI, because increasing theEb/N0also increases the energy of autocorrela-tion sidelobes; since threshold is set based only on the noise
22 20 18 16 14 12 10 8 6 4
Eb/N0(dB) 100
101
MAE
(ns)
E(2)b /N0=5 dB
Conv Min Median
(a)
22 20 18 16 14 12 10 8 6 4
Eb/N0(dB) 100
101
MAE
(ns)
E(2)b /N0=10 dB
Conv Min Median
(b)
Figure7: MAEs for DS-IR: (a)E(2)b /N0=5 dB, and (b)Eb(2)/N0 = 10 dB (wcls=2).
level, stronger self-interference starts degrading the perfor-mance after the optimum SNR level.5
In the presence of interference, the MAEs of the three ap-proaches atE(2)/N0 ∈ {0, 5, 10}dB are presented in Figures
8(b),9(a), and9(b), respectively.
The presence of interference at levels ofE(2)/N0=0 dB or higher drastically impacts the performance ofConvand Me-dianand as a result their MAE never falls below 6 ns, whereas the MAE of Min remains the same as the no-interference case whenE(2)/N0 = {0, 5}dB. Even whenE(2)/N0 =10 dB, the MAE floor of theMinapproaches 5 ns at very high SNR (E(1)/N0=18 dB).
These results suggest that better searchback and thresh-old techniques need to be developed for the TH-IR case to obtain more accurate ranging. Also, the energy matrix with minimum filtering proves to be effective to deal with inter-ference in the TH-IR case.
7. CONCLUSION
In this paper, we introduce a ranging method that uses a matrix of received energy samples from a square-law device,
22
and applies nonlinear filtering to the matrix to remove out-liers caused by interference. The nonlinear minimum filter is recommended based on our simulation results. After the nonlinear filtering, energy values along each column of the matrix are aggregated. Hence, the two-dimensional data are converted into an energy vector. Then, a searchback algo-rithm is run on the energy vector to locate the leading signal energy.
The effectiveness of this approach is proven by simula-tions conducted using IEEE 802.15.4a channel models. Non-linear filtering changes noise and signal characteristics. Due to space limitations, the impact of nonlinear filtering on the receiver detection performance will be studied in a separate article.
This study reveals the following.
(i) Ranging is quite sensitive to interference, since the leading edge sample may be very weak compared to interference samples.
(ii) A single interference energy sample may prolong the searchback process, and increase ranging error. (iii) In addition to multiuser interference, the searchback
algorithm must handle self-interference.
Finally, we present a framework and provide practical algorithms to mitigate multiuser interference in ToA esti-mation via noncoherent ultra-wideband systems. Our fu-ture work includes development of adaptive algorithms (e.g., minimum and median filters with adaptive window size) for
22
enhanced ranging accuracy under varying levels of interfer-ence, and quantification of the impact of nonlinear filtering on detection performance.
APPENDIX
Consider the problem of detecting a DC level in a known Gaussian noise source, and assume that the noise distribu-tion has zero mean and varianceσ2. Assume that there are Ni.i.d. observations of the test dataz[n]. When there is no signal, the data set belongs to a noise only hypothesisH0, and when signal is present it belongs to hypothesisH1,
H0:z[n]=w[n], n=1, 2,. . . N,
H1:z[n]=A+w[n], n=1, 2,. . . N. (A.1)
The probability of detection,PD, with the Neyman-Pearson detector for this problem is given in [32] as
PD=Q
Note that after lengthWmedian filtering with nonover-lapping windows, the new observation set would have only
20 15
10 5
0
Eb/N0(dB) 0.4
0.5 0.6 0.7 0.8 0.9 1
Pd
Impact of median filtering on detection performance
Before median filtering After median filtering
Figure10: Degradation in probability of detection after length 3 median filtering for “DC level detection in Gaussian noise” prob-lem. HereW = 3, f(3) = 0.44. Note that median filtering with nonoverlapping windows degrades detection performance.
Theoretically, the output density of the length 3 median filter is
p2(y)=6Qz(y)
1−Qz(y)
pz(y), (A.3) where Qz is the complementary cumulative distribution function andpz(y) is the density of the input data. Our nu-merical analysis indicates that f(3)=0.44 providing a close approximation to (A.3). The Kolmogorov-Smirnow test to compare the approximated density function and (A.3) results in the significance level of 0.1%. Then, in consideration of the approximation, the probability of detectionPm
D after median filtering becomes
Pm D =Q
Q−1(PFA−
(N/W)A2 f(W)×σ2
n
. (A.4)
Here, the problem of detecting a DC level in Gaussian noise is addressed for its simplicity, andFigure 10shows that median filtering in nonoverlapping windows would lower the probability of detection. If the length 3 median filter is applied with two-sample overlapping windows, the output noise would be a colored Gaussian, but the size of the ob-servation set would remainN. It may be possible to observe an increase in detection performance. Quantification of the impacts of median filtering with overlapping windows on the detection performance of noncoherent receivers will be stud-ied in detail in our future work.
ACKNOWLEDGMENTS
The authors wish to thank Dr. Philip Orlik and Dr. Andy F. Molisch for their beneficial feedback and comments during the course of this work. We also thank our anonymous re-viewers for their help to improve this presentation.
REFERENCES
[1] Z. Tarique, W. Q. Malik, and D. J. Edwards, “Bandwidth re-quirements for accurate detection of direct path in multipath environment,”Electronics Letters, vol. 42, no. 2, pp. 100–102, 2006.
[2] M. Z. Win, G. Chrisikos, and N. R. Sollenberger, “Performance of Rake reception in dense multipath channels: implications of spreading bandwidth and selection diversity order,”IEEE Journal on Selected Areas in Communications, vol. 18, no. 8, pp. 1516–1525, 2000.
[3] J. Ellis, et al., “IEEE P802.15.4a WPAN alternate PHY -PAR,” January, 2004, doc.: IEEE 802.15-04/048r1.http://www .ieee802.org/15/pub/TG4a.html.
[4] S. Gezici, Z. Tian, G. B. Giannakis, et al., “Localization via ultra-wideband radios: a look at positioning aspects of future sensor networks,”IEEE Signal Processing Magazine, vol. 22, no. 4, pp. 70–84, 2005.
[5] M. Z. Win and R. A. Scholtz, “Impulse radio: how it works,” IEEE Communications Letters, vol. 2, no. 2, pp. 36–38, 1998. [6] L. Reggiani and G. M. Maggio, “Rapid search algorithms for
code acquisition in UWB impulse radio communications,” IEEE Journal on Selected Areas in Communications, vol. 23, no. 5, pp. 898–908, 2005.
[7] J. Yu and Y. Yao, “Detection performance of time-hopping ul-trawideband LPI waveforms,” inProceedings of IEEE Sarnoff Symposium, Princeton, NJ, USA, April 2005.
[8] Z. Tian and G. B. Giannakis, “A GLRT approach to data-aided timing acquisition in UWB radios—part I: algorithms,”IEEE Transactions on Wireless Communications, vol. 4, no. 6, pp. 2956–2967, 2005.
[9] Z. Tian and G. B. Giannakis, “A GLRT approach to data-aided timing acquisition in UWB radios—part II: training sequence design,”IEEE Transactions on Wireless Communications, vol. 4, no. 6, pp. 2994–3004, 2005.
[10] W. Chung and D. Ha, “An accurate ultra wideband (UWB) ranging for precision asset location,” inProceedings of IEEE Conference on Ultra Wideband Systems and Technologies (UWBST ’03), pp. 389–393, Reston, Va, USA, November 2003. [11] R. Fleming, C. Kushner, G. Roberts, and U. Nandiwada, “Rapid acquisition for ultra-wideband localizers,” in Proceed-ings of IEEE Conference on Ultra Wideband Systems and Tech-nologies (UWBST ’02), pp. 245–249, Baltimore, Md, USA, May 2002.
[12] J.-Y. Lee and R. A. Scholtz, “Ranging in a dense multipath en-vironment using an UWB radio link,”IEEE Journal on Selected Areas in Communications, vol. 20, no. 9, pp. 1677–1683, 2002. [13] R. A. Scholtz and J.-Y. Lee, “Problems in modeling UWB chan-nels,” inProceedings of IEEE Conference Record of the Asilomar Conference on Signals, Systems and Computers, vol. 1, pp. 706– 711, Pacific Groove, Calif, USA, November 2002.
[14] C. Mazzucco, U. Spagnolini, and G. Mulas, “A ranging tech-nique for UWB indoor channel based on power delay pro-file analysis,” inProceedings of IEEE 59th Vehicular Technology Conference (VTC ’04), vol. 5, pp. 2595–2599, Milan, Italy, May 2004.
[15] I. Guvenc and Z. Sahinoglu, “TOA estimation with different IR-UWB transceiver types,” in Proceedings of IEEE Interna-tional Conference on Ultra-Wideband (ICU ’05), pp. 426–431, Zurich, Switzerland, September 2005.
Systems and Technologies, pp. 288–292, Kyoto, Japan, May 2004.
[17] K. Yu and I. Oppermann, “Performance of UWB position estimation based on time-of-arrival measurements,” in Pro-ceedings of International Workshop on Ultra Wideband Systems; Joint with Conference on Ultra Wideband Systems and Technolo-gies, pp. 400–404, Kyoto, Japan, May 2004.
[18] I. Guvenc and Z. Sahinoglu, “Threshold-based TOA estima-tion for impulse radio UWB systems,” inProceedings of IEEE International Conference on Ultra-Wideband (ICU ’05), pp. 420–425, Zurich, Switzerland, September 2005.
[19] I. Guvenc, Z. Sahinoglu, A. F. Molisch, and P. Orlik, “Non-coherent TOA estimation in IR-UWB systems with different signal waveforms,” in Proceedings of 1st IEEE/CreateNet In-ternational Workshop on Ultrawideband Wireless Networking (UWBNETS ’05), pp. 245–251, Boston, Mass, USA, July 2005, (invited paper).
[20] I. Guvenc and Z. Sahinoglu, “Threshold selection for UWB TOA estimation based on kurtosis analysis,”IEEE Communi-cations Letters, vol. 9, no. 12, pp. 1025–1027, 2005.
[21] I. Guvanc and Z. Sahinoglu, “Multiscale energy products for TOA estimation in IR-UWB systems,” inProceedings of IEEE Global Telecommunications Conference (GLOBECOM ’05), vol. 1, pp. 209–213, St. Louis, Mo, USA, November-December 2005.
[22] S. Gezici, Z. Sahinoglu, H. Kobayashi, H. V. Poor, and A. F. Molisch, “A two-step time of arrival estimation algorithm for impulse radio ultrawideband systems,” inProceedings of 13th European Signal Processing Conference (EUSIPCO ’05), An-talya, Turkey, September 2005.
[23] S. Gezici, Z. Sahinoglu, H. Kobayashi, and H. V. Poor, “Ultra wideband geolocation,” inUltrawideband Wireless Communi-cations, John Wiley & Sons, New York, NY, USA, 2005. [24] R. Merz, C. Botteron, and P. A. Farine, “Multiuser interference
during synchronization phase in UWB impulse radio,” in Pro-ceedings of IEEE International Conference on Ultra-Wideband (ICU ’05), pp. 661–666, Zurich, Switzerland, September 2005. [25] S. Gezici, H. Kobayashi, and H. V. Poor, “A comparative study of pulse combining schemes for impulse radio UWB sys-tems,” inProceedings of IEEE/SarnoffSymposium on Advances in Wired and Wireless Communication, pp. 7–10, Princeton, NJ, USA, April 2004.
[26] S. Gezici, H. Kobayashi, H. V. Poor, and A. F. Molisch, “Opti-mal and subopti“Opti-mal linear receivers for time-hopping impulse radio systems,” inProceedings of International Workshop on Ul-tra Wideband Systems; Joint with Conference on UlUl-tra Wide-band Systems and Technologies, pp. 11–15, Kyoto, Japan, May 2004.
[27] W. M. Lovelace and J. K. Townsend, “Chip discrimination for large near far power ratios in UWB networks,” inProceedings of IEEE Military Communications Conference (MILCOM ’03), vol. 2, pp. 868–873, 2003.
[28] E. Fishler and H. V. Poor, “Low complexity multi-user detec-tors for time hopping implse radio systems,”IEEE Transactions on Signal Processing, vol. 52, no. 9, pp. 2561–2571, 2004. [29] A. F. Molisch, K. Balakrishnan, D. Cassioli, et al., “IEEE
802.15.4a channel model—final report,” Tech. Rep., 2005, doc: IEEE 802.15-04-0662-02-004a. http://www.ieee802.org/15/ pub/TG4a.html.
[30] H. G. S¸enel, R. A. Peters II, and B. Dawant, “Topological me-dian filters,”IEEE Transactions on Image Processing, vol. 11, no. 2, pp. 89–104, 2002.
[31] N. C. Gallagher Jr. and G. L. Wise, “Theoretical analysis of the properties of median filters,”IEEE Transactions on Acoustics,
Speech, and Signal Processing, vol. 29, no. 6, pp. 1136–1141, 1981.
[32] S. M. Kay,Fundamentals of Statistical Signal Processing: Detec-tion Theory, Prentice Hall, Upper Saddle River, NJ, USA, 1998. [33] L. Yin, R. Yang, M. Gabbouj, and Y. Neuvo, “Weighted median filters: a tutorial,”IEEE Transactions on Circuits and Systems II: Analog and Digital Signal Processing, vol. 43, no. 3, pp. 157– 192, 1996.
Zafer Sahinoglu received the B.S. degree in electrical engineering from Gazi Uni-versity, Ankara, Turkey, in 1994, and the M.S. degree in biomedical engineering, and Ph.D. degree in electrical engineering (with awards) from the New Jersey Institute of Technology (NJIT), Newark, in 1998 and 2001, respectively. In 1999 he was with AT&T Shannon Research Labs. Since March 2001, he has been with Mitsubishi Electric
Research Labs, Cambridge, Mass. His current research interests include MAC and upper-layer issues in wireless sensor networks, and ultra-wideband ranging, and geolocation. He has coauthored a book chapter on UWB geolocation and has authored and coau-thored over 33 international journal and conference papers. He has contributed to MPEG21 standards on mobility modeling and char-acterization for multimedia service adaptation, to ZigBee on cost-aware routing and broadcasting, and to IEEE 802.15.4a standards on precision ranging. He is currently a Technical Vice-Editor in IEEE 802.15.4a TG and Chair of ZigBee industrial plant monitoring profile task group. He holds 11 patents.
Ismail Guvencreceived the B.S. degree in electrical and electronics engineering from Bilkent University, Turkey, in 2001, and the M.S. degree in electrical and computer en-gineering from University of New Mex-ico, in 2002, and Ph.D. degree in electrical engineering from the University of South Florida in 2006. He was with Mitsubishi Electric Research Labs between January and August, 2005, where he worked on UWB