Lateral variations of
P
nvelocity and anisotropy in Taiwan from
travel-time tomography
Chau-Huei Chen1, Yue-Haun Chen1, Horng-Yuan Yen2, and Guey-Kuen Yu3
1Institute of Seismology, National Chung Cheng University, Chia-Yi, Taiwan 2Department of Earth Science, National Central University, Chung-Li, Taiwan 3Department of Civil Engineering, Van Nung Institute of Technology, Chung-Li, Taiwan
(Received August 20, 2002; Revised April 9, 2003; Accepted April 9, 2003)
In this study, the P arrivals of 1726 ray paths with the epicentral distances longer than 200 km from 539 earthquakes that occurred in Taiwan are used to investigate the variation of Pn velocity. The results show that the lateral variation ofPn velocity in Taiwan is quite similar to the pattern of gravity anomaly and strongly related
to several features of Taiwan’s geological structure. The crust is a little thicker (about 39 km) in the Central Range and somewhat thinner toward the east and west. A relatively thin crust (about 35 km) is obtained in the area of Peikang High; however, an unexpected thick crust of greater than 40 km is also found at the corner of southwestern Taiwan. The degree of anisotropy of Pnvelocity is found less than 10% and the fast direction is generally in the E-W direction. This direction is parallel to the axis of compressional stress or the direction of plate motion, indicating that the anisotropy results from the deformation of the upper mantle.
Key words: Pn, anisotropy, tomography.
1.
Introduction
Taiwan is located at the boundary between the Philippine Sea and Eurasian plates, and one of the most spectacular arc-continent collisions occurs there. A better understanding of the subterranean structure of this area is an important topic for geological and geophysical scientists; however, from the past studies, there is little agreement on the dynamic pro-cesses responsible for the crust-mantle structure of the island and surrounding areas (Suppe, 1981, 1985; Rau and Wu, 1995). Lateral variation ofPnvelocity is associated with the changes of the temperature, pressure, and material in upper mantle, while variation in crustal thickness has resulted from many different factors including crustal extension or com-pression, isostatic forces, and magma intrusion (Black and Braile, 1982). Thus, knowledge about the crustal thickness andPn velocity can provide valuable information on crustal deformation, and help us to infer the tectonic evolution of the study area.
In Taiwan, an average of Pn velocity with 7.8 km/s was
first given by Yeh and Tsai (1981). Later, Huanget al.(1998) presented the regionalized Pn velocities with 8.2 km/s, 7.9
km/s, and 8.0 km/s for the regions of the Taiwan Strait, Tai-wan Island, and Eastern Coastal Range, respectively. Lateral variations of the crustal thickness and upper mantleP-wave velocity were estimated by several studies from 3-D velocity inversion (Chenet al., 1994; Rau and Wu, 1995; Maet al., 1996).
The anisotropic properties in the upper mantle are consid-ered to be related to the shear stress of plate motion (Raittet al., 1969; Okal and Talandier, 1980; Hearn, 1984). Kuoet
Copy right cThe Society of Geomagnetism and Earth, Planetary and Space Sciences (SGEPSS); The Seismological Society of Japan; The Volcanological Society of Japan; The Geodetic Society of Japan; The Japanese Society for Planetary Sciences.
al.(1994) have observed a certain degree of anisotropy for
Pn velocity in upper mantle of the northern Taiwan. In our current study, the travel times of Pn are used to derive
bet-ter images of the labet-teral variations of the Pn velocity and its
anisotropy. Meanwhile, the corresponding crustal thickness is also estimated. From these results, a better explanation of the tectonic evolution in Taiwan area is inferred.
2.
Tectonic Setting
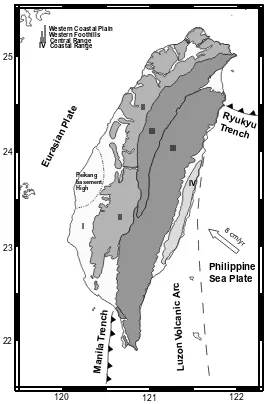
The geological structures of Taiwan trend mainly in a NNE-SSW direction as shown in the simplified geological map (Fig. 1). These trends are parallel to the main topo-graphic trends. The topography of Taiwan is dominated by the Central Range where pre-Tertiary metamorphic com-plexes are exposed. They are most probably exhumed lower crustal material raised to the upper level as a result of re-cent orogeny (Ho, 1986; Lin, 2000). East of the metamor-phic complex is the Coastal Range. These layers are thrust up along a series of echelon faults, striking about N30◦E, with a small angle to the dominant structural trend of the is-land. These thrust layers were successively accreted to the island, beginning around 4–6 million years before present (Lee et al., 1991). The Longitudinal Valley separates the Coastal Range from the Central Range to the west, and is considered to be the suture that juxtaposes older continen-tal rocks and young island arc materials. It also separates the highly seismic Coastal Range (Wuet al., 1989) from the relatively aseismic Central Range. To the west of the pre-Tertiary metamorphic complex are the main Central Range, the Foothills and the Coastal Plain. The Peikang high, as a pre-Tertiary basement, separates the western Taiwan into two parts: the pro-orogenic sedimentary material in north-western Taiwan were formed in relatively shallow shelf
I
II
120 121 122
22 23
8 cm/yr
Philippine Sea Plate
Luzon V olcanic
Ar
c
Manila T renc
h High
Fig. 1. A simplified structural geology map of Taiwan showing: (a) The regional tectonic stress due to the convergence of the Philippine Sea and the Eureasia Plates. (b) The major geological regimes in Taiwan: I. Western Coastal Plain, II. Western Foothills, III. Central Range (forms the backbone of Taiwan), and IV. Coastal Range. The dashed region on the western coast shows the approximate location of the Peikang High (PKH), which is the Tertiary basement high detected from seismic reflection mapping.
ronments, whereas the material in the south-western Taiwan were formed along the former continental slope, as a part of the passive margin of southeastern China. The Coastal Plain of western Taiwan is composed of Quaternary alluvial de-posits, at the shallow depths. The Neogene strata underneath the alluvial are gently folded and getting thinner to the west.
3.
Data and Methodology
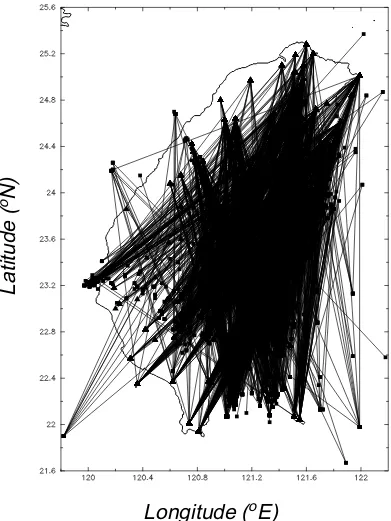
In this study, theP-arrivals of earthquakes in Taiwan area as recorded by the Central Weather Bureau Seismic Network (CWBSN) during the period between 1993 and 2001 have been used. To obtain a high quality data set and ensure that the P-arrivals were Pn phases, a few criteria for selecting the final data were followed: (a) the epicentral distance is greater than 200 km; (b) the focal depth is less than 25 km; (c) the errors of hypocenter determination are within 3 km in horizontal, and 5 km in vertical; (d) thePnarrivals are picked
with errors less than±0.1 s (i.e. the weightings assigned by CWB of observations belong to 0, 1, and 2 only). Based on these criteria, a total of 1768 ray paths from 539 events are
selected as the data set for Pn velocity inversion. The ray
paths shown in Fig. 2 are quite well distributed in crossover the Taiwan area.
In order to investigate the lateral variation of Pn velocity,
the area of Taiwan (21.6◦N to 25.6◦N, 119.8◦E to 122.2◦E) is divided into 240 blocks, thus each block size is 0.2◦ × 0.2◦. The total travel time of each path is the sum of the time across the blocks plus the time-term corrections for the station and source as shown in the following equation (Zhao and Xie, 1993):
ti j ≈ Xi j V0
i j
=i j kSk+ai+bj (1)
whereti jis the travel time of the path from eventito station
j;Xi jis the epicentral distance of the path;Vi j0is the average Pn velocity of the path (Zhao and Xie, 1993); i j k is the
length of the ray path in blockk;Skis the slowness of block k; ai andbj are the time-term corrections for station and
Longitude (
o
E)
Latitude (
o
N)
Fig. 2. Ray paths. Solid triangle and square represent the locations of seismic stations and epicenters, respectively.
then the equation becomes (Hearn, 1996)
1
Vo i j
= 1
Xi j
(Sk+Akcos 2φ+Bksin 2φ)∗i j k+Resi j
(2) where, Ak and Bk are the anisotropic coefficients and φis
the angle of fast direction as measured from the north. The quantity(A2
k+B
2
k)
1/2represents the magnitude of anisotropy
andφ=12tan−1(BkAk).
After rearranging the Eq. (2) and simplifying, we obtain
1
Vo i j
=
i j k(Sk+Akcos 2φ+Bsin 2φ) Xi j
+Ri j (3)
where
Ri j≈ δai+δbj
Xi j (4)
is the error between theoretical calculations and observa-tions. Solving Eq. (3) by the back-projection method (Xie and Mitchell, 1990), the values ofPnvelocity and the coef-ficients of anisotropic terms are obtained. The resolution of the inversion results is expressed as the Point Spread Func-tion (PSF) (Zhao and Xie, 1993). Assuming that the travel-time residual of the Pn velocity inversion predominantly
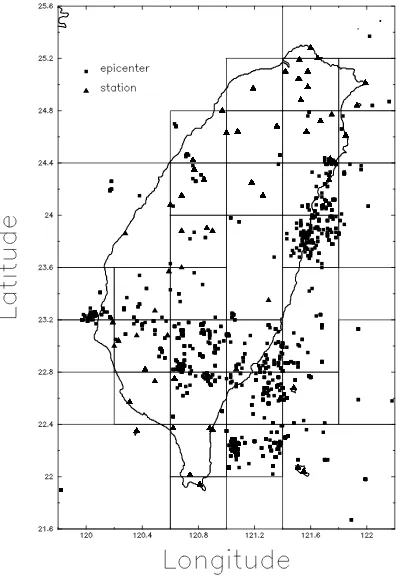
Fig. 3. Sub-regions used in the Moho depth inversion.
δbi with the known Ri j. With the improvements in estima-tion Moho depth, we recalculate thePn velocities. Through
an iteration procedure we are able to obtain Pn velocity and
Moho depth with minimum travel-time residuals. For mak-ing this inversion overdetermined, and reducmak-ing errors in original times, in event locations and arrival-time readings, we merge the unknownsδai andδbi into a new set of un-knowns (Zhao and Xie, 1993) according to the distributions
of stations and epicenters (Fig. 3), and the Moho depth in the subregion is assumed constant.
4.
Results and Discussion
Before inversion, the appropriate initial values of the crustal thickness (H), the crustal P velocity (Vc), and the
upper mantle P velocity (Vm) have to be estimated. In
35
Error(sec )2 Error(sec )2
Fig. 4. (a)Pntravel time curve (bold line) derived from linear regression of arrival time data used in this study. Two thin lines represent the standard errors in fitting. A slight dependence of velocity on the travel distance indicates that the ray paths used in this study do not penetrate the deep mantle. (b) The distribution of RMS travel time residual for various combination of the average crustalPvelocity (Vc) and Moho depth with fixed mantlePvelocity (Vm).
22 23 24 25
120 121 122
7.50
120 121 122
7.4
120 121 122
P
n
Velocity
120 121 122
22 23 24 25
120 121 122
22 23 24 25
120 121 122
22 23 24 25
120 121 122
22 23 24 25
120 121 122
0.6
120 121 122
22
120 121 122
7.50 7.55 7.60 7.65
22
120 121 122
7.8
8 22
120 121 122
Longitude (
oE)
22
120 121 122
34 35 36
22
120 121 122
36
120 121 122
Fig. 6. (a) The Moho depth distribution. (b) The correctedPnvelocity distribution.
(1993) is applied to estimate the upper mantle P velocity (Vm) (Fig. 4(a)); then, fixing Vm, and taking various
com-binations of H andVc, the optimal values of H andVcare
obtained when the minimum travel-time residual of inver-sion is found (Fig. 4(b)). According to these procedures, the values of 7.8 km/s, 6.3 km/s, and 39 km for Vm, Vc,
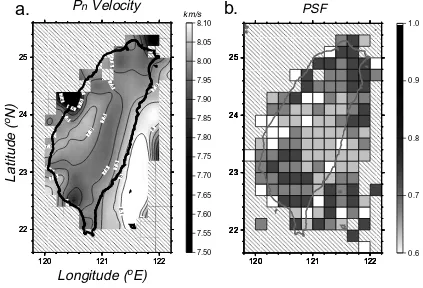
andH, are obtained, respectively. These values are used as the initial values for inversion of Eq. (3). The lateral varia-tion of Pn velocity, as shown in Fig. 5(a), is derived by the back-projection method. The spatial resolution at a given cell can be estimated by the point-spreading function (PSF) calculated for the cell (e.g. Humphreys and Clayton, 1988; Xie and Mitchell, 1990; Zhao and Xie, 1993). We calcu-lated the PSF of each block and found that the spreading of PSF is generally within about 0.3◦(three blocks). For a full understanding of the distribution of the degrees of resolu-tions of the blocks in the entire research area, Figure 5(b) shows the PSF values of each central block (which is sim-ilar to the diagonal element of the resolution matrix in the least square inversion). The path average travel-time resid-ual afterPnvelocity inversion is roughly 0.753 s as shown in
Fig. 4(b). Using Eq. (4), the variation of crustal thickness in Taiwan is calculated and shown in Fig. 6(a). Based on this crustal thickness the lateral variation of Pn velocity is also corrected and shown in Figure 6(b). The path average travel-time residual (0.172 s) after Moho depth correction is 77% less than that before inversion. The distribution of corrected
Pn velocity agrees well with the pattern of gravity anomaly given by Yenet al. (1998). A zone, covering most of the Central Range, is found to have a crustal thickness of about 39 km andPnvelocity of about 7.8 km/s, suggesting that the low velocity observation in the Central Range may not only reflect the high thermal gradient on, but also the variation in
crustal thickness. The crust becomes thinner in both west-ern and eastwest-ern Taiwan as compared with the Central Range. The area of Peikang High, which played an important role in tectonic evolution of Taiwan during late Miocene, also has a relative thinner crust (about 35 km) compared to its sur-roundings. In eastern offshore region, the thinner crust rep-resents the transition structure of the Philippine Sea Plate. A crustal thickness greater than 40 km at the corner of south-western Taiwan has probably resulted from the spreading of the South China Sea in the past, and the Eurasian Plate was dragged down to the mantle (Chemendaet al., 1995, 1996). The deeper Moho depth is also shown by wide-angle reflec-tion profile analysis (Shihet al., 2001).
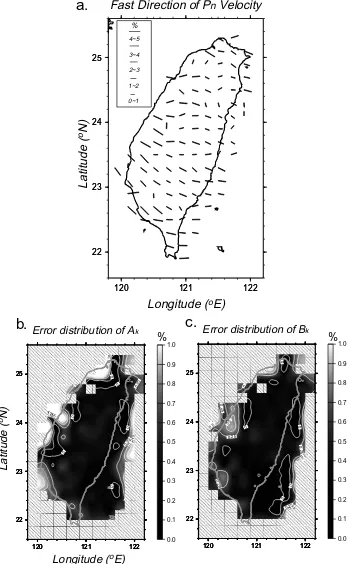
Figure 7(a) shows the distribution of anisotropy for Pn
velocity in Taiwan area. Figures 7(b) and 7(c) show the error distributions of the anisotropic coefficient components
Ak and Bk. From Fig. 7(a), it is easily seen that the fast
directions for Pn velocity are nearly in the E-W direction.
The degree of anisotropy is less than 10%, and the anisotropy in western Taiwan is a little greater than that in eastern. Although a few inconsistent directions are found, but, in general, the fast direction is almost parallel to the axis of compressional stress or the direction of plate motion. This result is consistent with the result obtained from a study of shear wave splitting in western Taiwan (Chen and Yen, 1998). Similar results have also given by Hearn (1996) in California.
5.
Conclusion
From a thorough study on the distributions of the crustal thickness, Pn velocity, and anisotropy in Taiwan area, a few
conclusions are given below:
Fast Direction of P
nVelocity
120 121 122
22 23 24 25
120 121 122
Longitude (
oE)
120 121 122
22 23 24 25
120 121 122
0
120 121 122
0.0
120 121 122
Error distribution of A
k22 23 24 25
120 121 122
22 23 24 25
120 121 122
0
120 121 122
0.0
120 121 122
Error distribution of B
kb.
c.
%
%
Latitude (
o
N)
Longitude (
oE)
Fig. 7. (a) Distribution of the direction of fastPnvelocity. The length of solid line represents the magnitude of anisotropy. The errors of the anisotropic coefficients (AkandBk) are also shown in (b) and (c).
are quite similar to the distribution of gravity anomaly and strongly related to the feature of geological structures in Taiwan.
(2) The area of Peikang High, an important geological structure in western Taiwan, has a relative thinner crust to its surroundings. An unexpected crustal thickness of greater than 40 km is also found at the corner of southwestern
Tai-wan.
from physical modeling,Earth Planet Sci. Lett.,132, 225–232, 1995. Chemenda, A. I., M. Mattauer, and A. N. Bokun, Continental subduction
and a mechanism for exhumation of high-pressure metamorphic rocks: new modeling and field data from Oman,Earth Planet Sci. Lett.,143, 173–182, 1996.
Chen, C. H. and H. J. Yen, A preliminary study on crustal anisotropy in Chia-Nan area of Taiwan,TAO,9, 573–588, 1998.
Chen, C. H., W. H. Wang, and Y. H. Yeh, 3-D velocity structure in Taiwan area: A tectonic implication of continent-arc collision (abstract),Eos Trans. AGU, Fall Meet. Suppl.,75(44), 645, 1994.
Hearn, T., Pntravel time in southern California,J. Geophys. Res.,89, 1843– 1855, 1984.
Hearn, T., Anisotropic Pntomography in the western United States,J. Geo-phys. Res.,101, 8403–8414, 1996.
Ho, C. S., A synthesis of the geological evolution of Taiwan,Mem. Geol. Soc. China,8, 15–29, 1986.
Huang, B. S., K. C. Chen, and H. Y. Yen, Velocity of Pn-waves in the Taiwan Strait and its surrounding area from regional earthquakes,TAO,9, 473– 486, 1998.
Humphreys, E. and R. W. Clayton, Adaptation of back projection tomog-raphy to seismic travel time problem,J. Geophys. Res.,93, 1073–1086, 1988.
Kuo, B. Y., C. C. Chen, and T. C. Shin, Split S waveforms observed in northern Taiwan: implications for crustal anisotropy,Geophys. Res. Lett.,
Suppe, J., Mechanics of mountain building and metamorphism in Taiwan,
Mem. Geol. Soc. China,4, 67–89, 1981.
Suppe, J.,Principles of Structural Geology, 537 pp, Prentice-Hall Inc., N.J., 1985.
Wu, F. T., K. C. Chen, J. H. Wang, R. McCaffrey, and D. Salzberg, Focal mechanisms of recent large earthquakes and the nature of faulting in the Longitudinal Valley of eastern Taiwan,Proc. Geol. Soc. China,32, 157– 177, 1989.
Xie, J. and B. J. Mitchell, A back-projection method for imaging large-scale lateral variations of Lg coda Q with application to continental Africa,
Geophys. J. Int.,100, 161–181, 1990.
Yeh, Y. H. and Y. B. Tsai, Crustal structure of central Taiwan from inversion ofP-wave arrival times,Bull. Inst. Earth Sci., Academia Sinica,1, 83– 102, 1981.
Yen, H. Y., Y. H. Yeh, and F. T. Wu, Two-Dimensional crustal structure of Taiwan from gravity data,Tectonics,17, 104–111, 1998.
Zhao, L. S. and J. Xie, Lateral variations in compressional velocities beneath Tibetan plateau from Pntravel Time tomography,Geophys. J. Int.,115, 1070–1084, 1993.