R E S E A R C H A R T I C L E
Open Access
Risk factors for antepartum stillbirth and the
influence of maternal age in New South Wales
Australia: A population based study
Adrienne Gordon
1,2*, Camille Raynes-Greenow
2*, Kevin McGeechan
2, Jonathan Morris
3,4and Heather Jeffery
1,2Abstract
Background:Maternal age is a known risk factor for stillbirth and delayed childbearing is a societal norm in developed country settings. The timing and reasons for age being a risk factor are less clear. This study aimed to document the gestational specific risk of maternal age throughout pregnancy and whether the underlying causes of stillbirth differ for older women.
Methods:Using linkage of state maternity and perinatal death data collections the authors assessed risk factors for antepartum stillbirth in New South Wales Australia for births between 2002–2006 (n = 327,690) using a Cox
proportional hazards model. Gestational age specific risk was calculated for different maternal age groups. Deaths were classified according to the Perinatal Mortality Classifications of the Perinatal Society of Australia and New Zealand. Results:Maternal age was a significant independent risk factor for antepartum stillbirth (35 –39 years HR 1.4 95% CI 1.12 –1.75; ≥40 years HR 2.41 95% CI 1.8 – 3.23). Other significant risk factors were smoking HR 1.82 (95% CI 1.56 –2.12) nulliparity HR 1.23 (95% CI 1.08 –1.40), pre-existing hypertension HR 2.77 (95% CI 1.94 –3.97) and pre-existing diabetes HR 2.65 (95% CI 1.63–4.32). For women aged 40 or over the risk of antepartum stillbirth beyond 40 weeks was 1 in 455 ongoing pregnancies compared with 1 in 1177 ongoing pregnancies for those under 40. This risk was increased in nulliparous women to 1 in 247 ongoing pregnancies. Unexplained stillbirths were the most common classification for all women, stillbirths classified as perinatal infection were more common in the women aged 40 or above.
Conclusions:Women aged 35 or older in a first pregnancy should be counselled regarding stillbirth risk at the end of pregnancy to assist with informed decision making regarding delivery. For women aged 40 or older in their first pregnancy it would be reasonable to offer induction of labour by 40 weeks gestation.
Keywords: Stillbirth, Maternal age, Risk factors, Population-based, Data linkage
Background
Stillbirth is a devastating pregnancy outcome that is esti-mated to occur in 2.65 million births globally each year [1]. Stillbirth is relatively understudied and the deaths have not been accounted for globally as part of other major mater-nal and child health strategies [2]. In Australia 1 in every 140 babies are stillborn which represented 2188 families in
2008 [3]. Recent meta analyses of population based studies in high income countries showed that the major risk fac-tors for stillbirth were maternal age, smoking and obesity with a population attributable risk of 30% [4]. The increas-ing prevalence of these population risk factors has been postulated to contribute to the lack of any significant de-crease in stillbirth rates in developed country settings over the past 10–20 years [5].
As with other high income settings, the number of women delaying childbearing in Australia continues to increase. New South Wales (NSW) is the most populous state in Australia. The mean maternal age is 30.6 years; approximately 1 in 4 women (23%) deliver a baby aged * Correspondence:adrienne.gordon@email.cs.nsw.gov.au;
camille.raynes-greenow@sydney.edu.au 1
Department of Neonatal Medicine, Royal Prince Alfred Hospital, Sydney, NSW 2050, Australia
2
Sydney School of Public Health, University of Sydney, Sydney, NSW 2006, Australia
Full list of author information is available at the end of the article
35 years or older and 15% of women have their first baby aged 35 or older [6]. Smoking during pregnancy in NSW has declined but remains at 12.7% in the over-all population and particularly high at > 50% in women of Aboriginal or Torres Strait Islander origin [6]. Obes-ity is an increasing problem in pregnant women con-tributing not only to other pregnancy risks such as hypertension but also independently to stillbirth [7,8]. In 2009 40% of Australian women of child bearing age were either overweight or obese [9], and in 2008 60% of pregnant women in South Australia were documen-ted as being overweight or obese [10]. Both smoking and obesity are risk factors modifiable by women who are planning a pregnancy however maternal age is not and the underlying mechanism of the age-associated risk remains unclear. A recent systematic review of ma-ternal age and risk of stillbirth was unable to pool stud-ies to determine the magnitude of stillbirth risk due to significant statistical heterogeneity [11]. Also, few of the included studies analysed antepartum stillbirths (before labour) separately to intrapartum stillbirths (during labour), a significant omission as the underlying causes, the associated risk factors and the suggested denomina-tors for statistical analysis differ [12-14]. Although awareness of increased risks of adverse pregnancy out-come may contribute over time to women having chil-dren earlier there is a need to be able to give accurate risks to older women who are currently pregnant or planning a pregnancy. It is also important to be able to define risk of antepartum stillbirth by gestational age as for risks that are increased near term the option of timed/induced delivery is possible without the conse-quences of prematurity. Two very large recent studies in the US and Norway have assessed risk of stillbirth per ongoing pregnancy by gestational age week for dif-ferent maternal age groups however neither was able to separate antepartum from intrapartum deaths or pro-vide any cause of death information [15,16].
Despite known risk factors for stillbirth many of these deaths remain unexplained and there is an ur-gent need to identify and target appropriate areas for research and prevention of stillbirth. Unexplained deaths account for 41% of stillbirths in NSW and 28% nationally [17]. Stillbirths close to term are more likely to be classified as unexplained than very preterm still-births with 60% of term stillstill-births in NSW classified as unexplained [17]. Not knowing why a baby died makes it difficult for health providers to counsel regarding future pregnancy management and recur-rence risk and potentially magnifies the grief and
be-reavement outcomes for the family. Unexplained
stillbirths have been shown in an analysis of stillbirths from Canada to be the only type of stillbirths statisti-cally more common in older women [18] however the
majority of studies assessing maternal age and stillbirth do not include information of cause of death [11].
One study addressing uteroplacental insufficiency and its association with advanced maternal age showed no difference in the stillbirths with fetal growth restriction between older and younger women [19].
The purpose of this study was to determine the most important current risk factors for antepartum stillbirth in NSW Australia and to quantify the risk of advanced maternal age by gestation in order to better inform older mothers and maternity care providers, particularly regarding risks at the end of pregnancy. Additionally we aimed to assess whether the classification of cause of death differed for stillbirths in older women.
Methods
This was a State wide population based cohort study using de-identified linked data from two NSW data sets: the New South Wales Midwives Data Collection and the Perinatal Death Data from the NSW Maternal and Perinatal Committee. Ethical approval was obtained from the NSW Department of Health Ethics Committee Ref No DoHEC 2005-06-11.
Data sources
The New South Wales Midwives Data Collection is a mandated population-based surveillance system cover-ing all births in NSW public and private hospitals, as well as home births [6]. It encompasses all livebirths and stillbirths of at least 20 weeks gestation or at least 400 grams birth weight. The Midwives Data Collection requires the attending midwife or doctor to complete a notification form when a birth occurs, and collects demographic, maternal health, pregnancy, labour, de-livery, and perinatal outcomes data (Additional file 1: Appendix S1). The NSW Maternal and Perinatal Com-mittee is a quality assurance comCom-mittee established under the NSW Health Administration Act 1982, and is privileged under this Act to carry out confidential reviews of both maternal and perinatal deaths [6]. Members are appointed by the Minister for Health. A subgroup called the Perinatal Outcomes Working Party reviews and classifies perinatal deaths using the
Peri-natal Society of Australia and New Zealand (PSANZ)–
Perinatal Mortality Classification System which has been documented to have a high interobserver
reliabil-ity with a kappa value of 0.83– 0.95 [20,21].
Definitions
Gestational age was determined by certain dates con-firmed by ultrasound before 20 weeks gestation or if dates uncertain by ultrasound alone prior to 20 weeks or if unavailable by examination of the newborn infant. Stillbirth was defined as a baby born of at least 20 weeks gestation or 400 g birthweight who did not, at any time after delivery, breathe, or show any evidence of life such as a heartbeat. Antepartum stillbirth was defined as death before the onset of labour from the Perinatal Death Database or induction of labour for known fetal death from the Midwives Data Collection. Unexplained antepartum death was defined as the death of a normally formed fetus prior to the onset of labour where no pre-disposing factors are considered likely to have caused the death. (PSANZ PDC classification of 10 or 11).
Explained antepartum death was defined as a PSANZ –
PDC classification of 2 – 9. Area Health Services and
Country of birth grouping into English speaking and other regional groups are defined as per NSW Mothers and Babies Report [6].
Study population
Records for babies born between 2002–2006 from the Midwives Data Collection and Perinatal Deaths data compiled by the NSW Maternal and Perinatal Commit-tee subgroup were linked using probabilistic record link-age methods in the NSW Centre for Health Record Linkage. Babies were included if they were at least 22 weeks and less than 43 weeks gestation. Cause of Death classification was extracted from the Perinatal Death Database on all stillborn infants that had been reviewed by the Perinatal Outcomes Working Party. Perinatal Deaths classified as being due to congenital abnormality by the PSANZ Perinatal Death Classification system were excluded. This category includes deaths where a congeni-tal abnormality (structural, functional or chromosomal) is considered to have made a major contribution to the death and includes terminations of pregnancy for con-genital abnormality. Demographic data were collected from both datasets.
Statistical analysis
Rates of antepartum stillbirth were computed by divid-ing the number of stillbirths by the sum of live births and stillbirths and multiplying by 1000. The risk of still-birth was compared between groups by time to event analyses using gestation as the time scale and antepartum stillbirth as the event. All other births were censored. Crude and adjusted hazard ratios were estimated using a Cox proportional hazards model. We used Wald tests to test the effect of each covariate and those with P-values less than 0.05 were considered significant. Only first birth within the time period was included to avoid intraperson
correlation. The proportional hazards assumption was tested using Schoenfeld residuals which were plotted against each covariate and the graphs inspected for any trend in the residuals [22,23]. Interactions between the log of gestational age and each covariate were created and added to the model individually to test for any de-parture from the proportional hazards assumption [24]. Records with missing data for the variables analysed were excluded. We calculated the risk of still birth at each week of gestation by dividing the number of still births that occurred during that week by the total number of ongoing pregnancies at the beginning of the week minus half of the number of live births in that week. All births were included in the calculation of these risks. Statistical analysis was performed using SAS version 9.2.
Results
There were a total of 426086 singleton births of at least 22 weeks gestation in NSW over the five year study period excluding deaths due to fetal anomaly. Using only first birth within the time period there were 333099 births and 1161 antepartum stillbirths. 5409 records (1.6%) with missing data for the variables were excluded and final analysis was performed on 327690 births and 1127 antepartum stillbirths. Overall stillbirth rates are presented in Table 1.
Risk factors for antepartum stillbirth
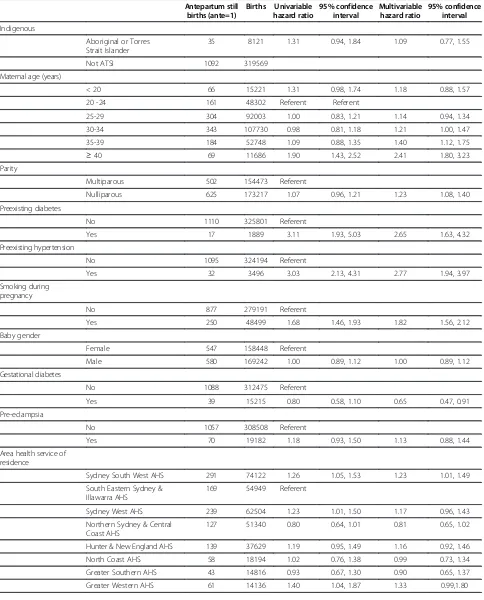
Crude and adjusted hazard ratios (HR) for antepartum stillbirth are presented in Table 2.
Risk factors significantly associated with antepartum stillbirth on adjusted analyses were: maternal age, smok-ing, nulliparity, pre-existing hypertension, pre-existing diabetes, area health service of residence and country of birth. Maternal age showed a dose–response relationship with a HR 1.4 (95% confidence interval (CI) 1.12, 1.75)
for women aged 35–39 and HR 2.41 (95% CI 1.8, 3.23)
for women aged 40 and above. Smoking conferred an increased risk of 1.82 (95% CI 1.56, 2.12), nulliparity 1.23 (95% CI 1.08, 1.40), preexisting diabetes 2.65 (95%
Table 1 Antepartum stillbirth rate in New South Wales Australia 2002-2006
Births Stillbirths Rate per 1,000 births
All births 2002-2006 426086 1438 3.4
- Only first birth for each woman in 2002-2006
Table 2 Crude and adjusted risk factors for antepartum stillbirth in New South Wales Australia 2002–2006
Antepartum still births (ante=1)
Births Univariable hazard ratio
95% confidence interval
Multivariable hazard ratio
95% confidence interval
Indigenous
Aboriginal or Torres Strait Islander
35 8121 1.31 0.94, 1.84 1.09 0.77, 1.55
Not ATSI 1092 319569
Maternal age (years)
< 20 66 15221 1.31 0.98, 1.74 1.18 0.88, 1.57
20 -24 161 48302 Referent Referent
25-29 304 92003 1.00 0.83, 1.21 1.14 0.94, 1.34
30-34 343 107730 0.98 0.81, 1.18 1.21 1.00, 1.47
35-39 184 52748 1.09 0.88, 1.35 1.40 1.12, 1.75
≥40 69 11686 1.90 1.43, 2.52 2.41 1.80, 3.23
Parity
Multiparous 502 154473 Referent
Nulliparous 625 173217 1.07 0.96, 1.21 1.23 1.08, 1.40
Preexisting diabetes
No 1110 325801 Referent
Yes 17 1889 3.11 1.93, 5.03 2.65 1.63, 4.32
Preexisting hypertension
No 1095 324194 Referent
Yes 32 3496 3.03 2.13, 4.31 2.77 1.94, 3.97
Smoking during pregnancy
No 877 279191 Referent
Yes 250 48499 1.68 1.46, 1.93 1.82 1.56, 2.12
Baby gender
Female 547 158448 Referent
Male 580 169242 1.00 0.89, 1.12 1.00 0.89, 1.12
Gestational diabetes
No 1088 312475 Referent
Yes 39 15215 0.80 0.58, 1.10 0.65 0.47, 0.91
Pre-eclampsia
No 1057 308508 Referent
Yes 70 19182 1.18 0.93, 1.50 1.13 0.88, 1.44
Area health service of residence
Sydney South West AHS 291 74122 1.26 1.05, 1.53 1.23 1.01, 1.49
South Eastern Sydney & Illawarra AHS
169 54949 Referent
Sydney West AHS 239 62504 1.23 1.01, 1.50 1.17 0.96, 1.43
Northern Sydney & Central Coast AHS
127 51340 0.80 0.64, 1.01 0.81 0.65, 1.02
Hunter & New England AHS 139 37629 1.19 0.95, 1.49 1.16 0.92, 1.46
North Coast AHS 58 18194 1.02 0.76, 1.38 0.99 0.73, 1.34
Greater Southern AHS 43 14816 0.93 0.67, 1.30 0.90 0.65, 1.37
CI 1.63, 4.32) and pre existing hypertension 2.77 (95% CI 1.94, 3.97). Area health service of residence and country of birth were used as available surrogate markers of socioeconomic status. There was an increased risk of antepartum stillbirth for women residing in Sydney South West Area Health Service (HR 1.23 95% CI 1.01,1.49) This represents an area with both a large multicultural population and the largest number of births in NSW. There were also increased risks of antepartum stillbirth for women born in Eastern Europe, Russia and the Baltic States (HR 1.84 95% CI 1.04, 3.25) Melanesia, Micronesia and Polynesia (HR1.7 95% CI 1.19, 2.44) Middle East and Africa (HR1.74 95% CI 1.38, 2.21) and Southern Asia (HR1.75 95% CI 1.28, 2.39). Importantly, after adjusting for the other variables indigenous status was not a significant risk factor for antepartum stillbirth (HR 1.09 95% CI 0.77, 1.55). Gestational diabetes on adjusted analysis appeared to reduce the risk of antepar-tum stillbirth (HR 0.65 95% CI 0.47, 0.91).
Risk factors stratified by parity
Adjusted risk factors stratified by parity are shown in Table 3. Multiparous women whose previous birth was by caesarean section had an increased risk of antepartum stillbirth that was close to but did not reach statistical significance (HR 1.24 95% CI 0.99,1.55). The dose re-sponse relationship with maternal age for increased antepartum stillbirth risk was seen for both nulliparous and multiparous women but with slightly larger effect sizes in the nulliparous women. The increased risk seen overall for women residing in Sydney South Western Area Health Service is only significant for multiparous women which may reflect referral patterns into tertiary centres for known higher risk pregnancies. For women from Middle East and Africa there remains increased risk despite parity. The increased risk for women from
Melanesia, Polynesia and Micronesia and Russia and the Baltic states was only seen for multiparous women and conversely only in nulliparous women from Southern Asia, and may be a reflection of the small numbers.
Risk of antepartum stillbirth with advanced maternal age
Gestational age specific risk of antepartum stillbirth is shown in Figure 1. The risk of antepartum stillbirth per undelivered pregnancy rises from around 40 weeks for all women. Importantly this increased risk is apparent at
earlier gestation by 1–2 weeks for women aged 40 and
above. Absolute risks per 1000 undelivered pregnancies by parity for all age groups beyond 40 weeks of preg-nancy are presented in Table 4. The overall absolute risk of stillbirth beyond 40 weeks gestation for women aged 40 and above was 2.2 per 1000 or 1 in 455 on-going pregnancies compared with 0.85 per 1000 or 1 in 1177 ongoing pregnancies for women under 40. The risk is highest for nulliparous women aged 40 and above with 1 in 247 ongoing pregnancies resulting in an antepartum stillbirth.
Unexplained versus explained deaths
PSANZ Classification of Cause of Death stratified by both parity and maternal age of 40 or above is shown in Table 5. Standardised Classifications from the Perinatal Outcomes Working Party were available for 1016 of the 1127 antepartum stillbirths (90%). The most common classification of death was unexplained (549/1016). Adjusted analyses for risk factors were performed for the unexplained group and showed similar hazard ratios for all variables to the total antepartum group so are not presented here. Adjusted analyses were not performed for the explained causes of death as the numbers in each group became too small. Multiparous women were more likely to have a classification of death of antepartum
Table 2 Crude and adjusted risk factors for antepartum stillbirth in New South Wales Australia 2002–2006(Continued)
Mother’s Country of birth
English speaking 847 255602 Referent
Central and South America 8 2862 0.85 0.42, 1.71 0.90 0.45, 1.81
Eastern Europe, Russia, Central Asian and Baltic States
12 2136 1.68 0.95, 2.97 1.84 1.04, 3.25
Melanesia, Micronesia and Polynesia
32 5801 1.67 1.17, 2.38 1.70 1.19, 2.44
Middle East and Africa 82 14768 1.64 1.31, 2.06 1.74 1.38, 2.21
North East Asia 27 12637 0.65 1.44, 0.96 0.72 0.49, 1.06
South East Asia 58 18592 0.98 0.75, 1.28 1.05 0.80, 1.38
Southern Asia 44 8802 1.53 1.13, 2.07 1.75 1.28, 2.39
Southern Europe 14 3836 1.10 0.65, 1.87 1.10 0.65, 1.87
Western and Northern Europe
Table 3 Adjusted risk factors for antepartum stillbirth by parity in New South Wales Australia 2002–2006
Nulliparous women Ante SB Births
AHR 95% confidence interval
Multiparous women Ante SB Births
Adj HR 95% confidence interval
Indigenous
Aboriginal or Torres Strait Islander 15 3586 0.97 0.57, 1.67 20 4535 1.19 0.74, 1.90
Not ATSI 610 169631 Ref 482 149938 Ref
Maternal age (years)
< 20 63 14002 1.23 0.90, 1.68 3 1219 0.77 0.24, 2.47
20 -24 117 33401 Ref 44 14901 Ref
25-29 178 53542 1.07 0.84, 1.35 126 38461 1.22 0.86, 1.72
30-34 167 50180 1.16 0.90, 1.48 176 57550 1.26 0.90, 1.76
35-39 75 18510 1.45 1.08, 1.96 109 34238 1.36 0.95, 1.94
≥40 25 3582 2.58 1.67, 4.01 44 8104 2.32 1.52, 3.56
Preexisting diabetes
No 616 172342 Ref 494 153459 Ref
Yes 9 875 3.06 1.57, 5.97 8 1014 2.20 1.08, 4.50
Preexisting hypertension
No 611 171422 Ref 484 152772 Ref
Yes 14 1795 2.25 1.31, 3.85 18 1701 3.38 2.09, 5.49
Smoking during pregnancy
No 511 152057 Ref 366 127134 Ref
Yes 114 21160 1.71 1.37, 2.13 136 27339 1.93 1.56, 2.38
Baby gender
Female 287 83575 Ref 260 74873 Ref
Male 338 89642 1.11 0.95, 1.30 242 79600 0.88 0.74, 1.05
Gestational diabetes
No 607 166321 Ref 481 146154 Ref
Yes 18 6896 0.66 0.41, 1.06 21 8319 0.65 0.42, 1.02
Pre-eclampsia
No 578 160272 Ref 479 148236 Ref
Yes 47 12945 1.10 0.82, 1.49 23 6237 1.15 0.76, 1.76
Area health service of residence
Sydney South West AHS 151 39377 1.13 0.88, 1.45 140 34745 1.39 1.02, 1.88
South Eastern Sydney & Illawarra AHS 106 31893 Ref 63 23056 Ref
Sydney West AHS 135 32100 1.19 0.92, 1.54 104 30404 1.16 0.84, 1.59
Northern Sydney & Central Coast AHS 78 28913 0.80 0.60, 1.07 49 22427 0.83 0.57, 1.20
Hunter & New England AHS 77 18615 1.19 0.88, 1.61 62 19014 1.14 0.80, 1.63
North Coast AHS 30 8621 0.98 0.65, 1.48 28 9573 1.00 0.64, 1.57
Greater Southern AHS 21 7024 0.85 0.53, 1.37 22 7792 0.97 0.60, 1.59
Greater Western AHS 27 6674 1.14 0.74, 1.75 34 7462 1.56 1.02, 2.39
Mother’s Country of birth
English speaking 483 136476 Ref 364 119126 Ref
Central and South America 4 1556 0.77 0.29, 2.07 4 1306 1.07 0.40, 2.89
Eastern Europe, Russia, Central Asian and Baltic States
5 1343 1.15 0.48, 2.78 7 793 3.27 1.54, 6.94
Melanesia, Micronesia and Polynesia 11 2320 1.42 0.78, 2.59 21 3481 1.92 1.22, 3.01
Middle East and Africa 33 6049 1.60 1.11, 2.29 49 8719 1.86 1.35, 2.55
North East Asia 19 7338 0.81 0.51, 1.29 8 5299 0.57 0.28, 1.15
haemorrhage, maternal or perinatal conditions and nul-liparous women more likely to have their baby’s death classified as due to growth restriction. The proportions of unexplained deaths were high in both groups. There was no difference in the proportion of deaths classified as fetal growth restriction between women aged 40 or above compared with the younger women.Women aged 40 or above were more likely to have their baby’s death classified as due to perinatal infection or spontaneous preterm, although the numbers within these groups are small.
Discussion
This represents a large cohort of antepartum stillbirths using record linked data and is the first study to spe-cifically examine risk factors for antepartum stillbirth by undelivered pregnancy in an Australian population. We have confirmed that increasing maternal age and nulliparity are important demographic risk factors for antepartum stillbirth in New South Wales. We have also been able to document the risk per undelivered pregnancy by gestational age week for maternal age strata and present absolute risks at term and beyond for older women. These findings will be important to both pregnant women and
their clinicians in the provision of accurate information regarding stillbirth risk and timing.
In this setting smoking, existing diabetes and pre-existing hypertension also remain important independ-ent (and potindepend-entially modifiable) risk factors for antepar-tum stillbirth. Smoking rates are extremely high in the Indigenous population in Australia [6] and represent a particular opportunity for stillbirth prevention where evidence of benefit for cessation strategies exists [25]. The increased risk often attributed solely to Indigenous status is not significant after adjusting for the other vari-ables collected and is evidence that health care provision and access as well as health promotion strategies in pregnancy could be better targeted to these women. Fur-ther evidence of disparity appears to exist with our find-ing that women from non-English speakfind-ing backgrounds particularly the Middle East and Africa have higher inde-pendent risks of stillbirth in the Australian setting. Whilst we are unable to examine the underlying reasons for this further with this data this is an issue that is widely generalisable to similar high income countries with immigrant minority communities. In such settings it will remain important to ensure equal access and op-portunities for the provision of maternity care to all women regardless of background.
Table 3 Adjusted risk factors for antepartum stillbirth by parity in New South Wales Australia 2002–2006(Continued)
Southern Asia 30 4843 2.00 1.37, 2.93 14 3959 1.36 0.79, 2.35
Southern, Western and Northern Europe 8 3394 0.68 0.34, 1.37 9 3096 0.96 0.49, 1.87
Previous birth by CS
No 402 125257 Ref
Yes 100 29216 1.24 0.99, 1.55
Median gestational age at delivery
The finding that gestational diabetes was apparently protective for antepartum stillbirth on adjusted analyses may relate to a number of factors. It is possible that identi-fied women with this risk factor are receiving more regular antenatal care and monitoring and have therefore a reduced risk. They are also more likely to be induced and less likely to go post term. In this cohort 9.8 % of women with gesta-tional diabetes delivered at 41 weeks gestation or beyond compared with 20.3% of the total sample. It may also be possible that we have been unable to adjust for other con-founders not collected in population data. Recent popula-tion based studies have actually shown no increased risk for stillbirth for women with gestational diabetes [26,27] with further evidence of low fetal death rates seen in the pro-spective Hyperglycaemia and Adverse Pregnancy Outcome (HAPO) cohort [28] (stillbirth rate of 3.8 per 1000) and no
stillbirths in the intervention arm in the Australian Carbo-hydrate Intolerance Study in Pregnant Women (ACHOIS) study compared with standard care arm (stillbirth rate of 5.7 per 1000) [29].
Strengths of our data include the large population base, the very small proportion of missing data (1.6%) and the standardised classification of cause of death. The Midwives Data Collection has previously performed very well in validation studies [30]. We have ascertained tim-ing of death from two independent data sources and are confident of the accuracy of the antepartum coding. This meant we did not have to rely on reporting of Apgar scores which are subjective, have high interobserver variability and are often subject to miscoding [31,32]. It is possible however that our focus on accuracy of timing may have reduced the overall antepartum stillbirth num-bers assessed as our rates of 3.4 per 1000 are slightly lower than other reported rates from similar populations of approximately 4.0 per 1000 [5].
The quantification of gestational-specific risk of ante-partum stillbirth by maternal age has not previously been documented in an Australian setting and repre-sents significant new information for maternity health care providers. Although absolute risks for older women are small, they are consistent with risks of chromosomal
abnormalities in the magnitude of 1/192 – 1/378 [33]
within the same group of women for which they cur-rently receive considerable counselling and potentially subsequent investigations. Women aged 35 and above and particularly those aged 40 or more should receive some information regarding stillbirth risk and be able to discuss potential options with their health care provider to assist with informed decision making. Ideally the question of balancing benefits and harms of induction of labour at term versus post term needs to be answered in a large ran-domised controlled trial. This may not be feasible as num-bers needed would exceed 46,000 women in order to show a 1 per 1000 difference in late pregnancy stillbirth.
Table 4 Absolute risks of stillbirth≥40 weeks gestation per 1000 undelivered pregnancies by maternal age and parity, New South Wales Australia 2002 - 2006
Age group Antepartum stillbirths
Undelivered pregnancies
Risk per 1000 undelivered pregnancies
Nulliparous women
< 20 6 7624 0.79
20–24 7 9174 0.76
25–29 32 28685 1.11
30–34 23 26366 0.87
35–39 13 9144 1.42
≥40 6 1481 4.05
Multiparous women
< 20 1 1207 0.83
20–24 13 12204 1.07
25–29 27 27397 0.99
30–34 34 35603 0.95
35–39 7 18480 0.38
≥40 5 3513 1.42
Table 5 Classification of cause of death by parity and maternal age in New South Wales Australia 2002–2006
PSANZ Classification No. (%) Parity Nulliparous Multiparous Maternal age 40 and above < 40 years
Unexplained Antepartum Death 546 (54) 304 (53.6) 242 (53.9) 516 (54) 30 (49)
Spontaneous Preterm 84 (8.3) 48 (8.5) 36 (8.0) 74 (7.8) 10 (16.4)
Antepartum Haemorrhage 76 (7.5) 30 (5.3) 46 (10.2) 76 (7.9) 0
Maternal Conditions 66 (6.5) 31 (5.4) 35 (7.8) 63 (6.6) 3 (4.9)
Hypertension 65 (6.4) 49 (8.6) 16 (3.6) 59 (6.2) 6 (9.8)
Fetal Growth Restriction 62 (6.1) 43 (7.6) 19 (4.2) 58 (6.1) 4 (6.6)
Specific Perinatal Conditions 58 (5.7) 26 (4.6) 32 (7.1) 55 (5.8) 3 (4.9)
Perinatal Infection 38 (3.7) 22 (3.9) 16 (3.6) 34 (3.6) 4 (6.5)
Hypoxic Peripartum Death 18 (1.8) 12 (2.1) 6 (1.3) 17 (1.8) 1 (1.6)
No Obstetric Antecedent 3 ( 0.3) 2 (0.3) 1 (0.2) 3 (0.3) 0
Further, the balance of harms in the intervention group is complicated as the comparison of a short nursery admis-sion with respiratory problems compared with a baby dying in utero are neither going to be comparable, nor ac-ceptable to women. One randomised study has used stat-istical modelling of individual risk factors in women aged 35 or greater to estimate an optimal timing of delivery at term and induce women in the intervention group who had not entered spontaneous labour by this time [34]. Al-though it was not powered to assess mortality there were reduced adverse outcomes including nursery admission and caesarean section in the intervention arm.
Having access to standardised classification of cause of death for 90% of the stillborn babies analysed is rare for large population based studies and this linkage has allowed us to both exclude deaths due to congenital anomalies and examine cause of death relative to the maternal perinatal risk factors of parity and maternal age. The classification of cause of death uses the PSANZ Perinatal Death Classification system which has been endorsed nationally and has now also been shown to perform well against other classification systems used internationally [35]. Although small numbers did not permit adjusted analyses for the explained causes of death for women aged 40 and above it is interesting to note that deaths due to perinatal infection were more common in these women. This is consistent with recent literature documenting increased incidence of placental histological evidence of infection in term stillbirths [36,37] and suggests a potential area for future research into underlying mechanisms.
There are however inherent shortcomings in using routinely collected population based datasets. The detail that can be obtained is limited to what information is collected and ascertainment of stillbirth is less accurate for extremely premature gestations [38]. Importantly, maternal height and weight, or BMI are not collected in the perinatal population health databases in New South Wales so we are unable to assess the importance of this risk factor on antepartum stillbirth. As a significant in-creasing public health problem and independent con-tributor to poor pregnancy outcomes there is an argument to be made to add this information to popula-tion perinatal data collecpopula-tion throughout Australia. We also do not have information on the timing of death just the timing of delivery which may affect the proportion of deaths classified as due to fetal growth restriction.
Conclusion
In summary we have confirmed the most important risk factors on a population basis for antepartum stillbirth in NSW and have quantified the risk of advanced maternal
age by gestation. Women aged≥ 35 in a first pregnancy
should receive information regarding stillbirth risk. For
those women at highest risk, that is age > 40 and in their first pregnancy it would be reasonable to offer induction of labour if undelivered by 40 weeks rather than waiting until 41 weeks or beyond. Large international rando-mised controlled trials are required to answer this ques-tion however these may be neither feasible or timely. Future studies therefore need to focus on the benefits and harms of any practice change in this area.
Additional files
Additional file 1:Appendix S1.Midwives Data Collection.
Additional file 2:Appendix S2.Confidential Report on Perinatal Death.
Abbreviations
NSW: New South Wales; PSANZ: Perinatal Society of Australia and New Zealand. A multidisciplinary society that includes: scientists, obstetricians, midwives, neonatologists, neonatal nurses, epidemiologists, surgeons, therapists and other professionals focussed on perinatal medicine. The Society covers basic science through to clinical practice and offers professional, political, administrative and educational advice in the area of perinatal medicine; AHS: area health service; AHR: adjusted hazard ratio.
Competing interests
The authors have no conflict of interest to declare.
Authors' contributions
AG designed the study, linked the datasets, extracted data and drafted the final paper. CRG contributed to data linkage, data analysis and interpretation and drafting the paper. KMG performed statistical analysis and commented on the paper. HJ provided overall supervision and advice. JM provided general advice and comments on the paper. All authors reviewed the study findings and read and approved the final manuscript.
Acknowledgements
The authors are grateful to Lee Taylor and the Centre for Epidemiology and Research at the NSW Department of Health for record linkage and providing the Midwives Data Collection and perinatal death data.
Author details
1
Department of Neonatal Medicine, Royal Prince Alfred Hospital, Sydney, NSW 2050, Australia.2Sydney School of Public Health, University of Sydney, Sydney, NSW 2006, Australia.3Sydney Medical School, University of Sydney, Sydney, NSW 2006, Australia.4Perinatal Research, Kolling Institute of Medical Research, Sydney University, Royal North Shore Hospital, St. Leonards, Sydney, NSW, Australia.
Received: 28 January 2012 Accepted: 18 December 2012 Published: 16 January 2013
References
1. Cousens S, Blencowe H, Stanton C, Chou D, Ahmed S, Steinhardt L, Creanga AA, Tuncalp O, Balsara ZP, Gupta S,et al:National, regional, and worldwide estimates of stillbirth rates in 2009 with trends since 1995: a systematic analysis.Lancet2011,377(9774):1319–1330.
2. Lawn JE, Blencowe H, Pattinson R, Cousens S, Kumar R, Ibiebele I, Gardosi J, Day LT, Stanton C, Lancet’s Stillbirths Series steering c:Stillbirths: Where? When? Why? How to make the data count?Lancet2011,
377(9775):1448–1463.
3. Laws PJ, Sullivan EA:Australia’s mothers and babies 2007,AIHW Cat No PER 48. Sydney: AIHW National Perinatal Statistics Unit (Perinatal Statistics Series no. 23); 2009.
4. Flenady V, Koopmans L, Middleton P, Froen JF, Smith GC, Gibbons K, Coory M, Gordon A, Ellwood D, McIntyre HD,et al:Major risk factors for stillbirth in high-income countries: a systematic review and meta-analysis.Lancet
5. Reddy UM, Laughon SK, Sun L, Troendle J, Willinger M, Zhang J:
Prepregnancy risk factors for antepartum stillbirth in the United States. Obstet Gynecol2010,116(5):1119–1126.
6. Laws PJ, Li Z, Sullivan EA:Australia’s mothers and babies 2008. Perinatal statistics series no. 24. Cat. no. PER 50. Canberra: AIHW; 2010. 7. Smith GC, Fretts RC:Stillbirth.Lancet2008,370:1715–1725.
8. Coletta J, Simpson LL:Maternal medical disease and stillbirth.Clin Obstet Gynecol2010,53(3):607–616.
9. Australian Bureau of Statistics,Australian Social Trends.vol. In Cat. No. 4102.0. Canberra: ABS; 2010.
10. Dodd JM, Grivell RM, Nguyen A-M, Chan A, Robinson JS:Maternal and perinatal health outcomes by body mass index category.Aust N Z J Obstet Gynaecol2011,51(2):136–140.
11. Smith GC:Estimating risks of perinatal death.Am J Obstet Gynecol2005,
192(1):17–22.
12. Ling Huang RS, Nicholas B, Dean F, van Walraven C:Maternal age and risk of stillbirth: a systematic review.CMAJ2008,178(2):165–172.
13. Getahun D, Ananth CV, Kinzler WL:Risk factors for antepartum and intrapartum stillbirth: a population-based study.Am J Obstet Gynecol
2007,196(6):499–507.
14. Gordon C. S. Smith:Estimating risks of perinatal death.Am J Obstet Gynecol2005,192:17–22.
15. Reddy UM, Ko CW, Willinger M:Maternal age and the risk of stillbirth throughout pregnancy in the United States.Am J Obstet Gynecol2006,
195:764–770.
16. Haavaldsen C, Sarfraz AA, Samuelsen SO,et al:The impact of maternal age on fetal death: does length of gestation matter?Am J Obstet Gynecol
2010,203:554. e 551–558.
17. Gordon A, Jeffery HE:Classification and description of stillbirths in New South Wales, 2002–2004.Med J Aust2008,188(11):645–648.
18. Fretts RC and Usher RH:Fetal death in women in the older reproductive age group.Contemporary Reviews in Obstetrics and Gynecology1997,
9:173–179.
19. Miller DA:Is advanced maternal age an independent risk factor for uteroplacental insufficiency?Am J Obstet Gynecol2005,192:1974–1980. 20. Chan A, King JF, Flenady V, Haslam RH, Tudehope DI:Classification of
perinatal deaths: Development of the Australian and New Zealand Classifications.J Paediatr Child Health2004,40:340–347.
21. Flenady V, King J, Charles A, Gardener G, Ellwood D, Day K, McCowan L, Kent A, Tudehope D, Richardson R,et al:PSANZ Clinical Practice Guideline for Perinatal Mortality; 2009. www.psanzpnmsig.org.
22. Lawn JE, Cousens S, Zupan J, Lancet Neonatal Survival Steering T:4 million neonatal deaths: when? Where? Why?Lancet2005,365(9462):891–900. 23. Horon IL:Underreporting of maternal deaths on death certificates and
the magnitude of the problem of maternal mortality.Am J Public Health
2005,95(3):478–482.
24. Picone O, Costa JM, Chaix ML, Ville Y, Rouzioux C, Leruez-Ville M:Human cytomegalovirus UL144 gene polymorphisms in congenital infections.J Clin Microbiol2005,43(1):25–29.
25. Lumley J, Chamberlain C, Dowswell T, Oliver S, Oakley L, Watson L:
Interventions for promoting smoking cessation during pregnancy. Cochrane Database of Systematic Reviews2009. doi:10.1002/14651858. CD001055.pub3. Issue 3. Art. No.: CD001055.
26. Xiong XSL, Wang FL, Demianczuk NN:Gestational diabetes mellitus: prevalence, risk factors, maternal and infant outcomes.Int J Gynaecol Obstet2001,75:221–228.
27. Peticca PKE, Walker MC, Yang Q, Bottomley J:Pregnancy outcomes in diabetes subtypes: how do they compare?A province-based study of Ontario, 2005–2006.J Obstet Gynaecol Can2009,31:487–496. 28. The HAPO Study Collaborative Research Group:Hyperglycemia and
Adverse Pregnancy Outcomes.N Engl J Med2008,358:1991–2002. 29. Caroline A, Crowther JEH, Moss JR, McPhee AJ, Jeffries WS, Robinson JS,
Group for the ACHOIS trial group:Effect of Treatment of Gestational Diabetes Mellitus on Pregnancy Outcomes.N Engl J Med2005,
352:2477–2486.
30. NSW Health Department:Validation Study: NSW Midwives Data Collection 1998.N S W Public Health Bull2000,9(2):97–99. 31. Colm P. F. O’Donnell OFK, Davis PG, Carlin JB, Morley CJ:Interobserver
Variability of the 5 -minute apgar score.J Pediatr2006,149:486–489. 32. Keenan W:The Apgar Challenge.J Pediatr2006,149:440.
33. Fretts RC, Duru UA:New Indications for Antepartum Testing: Making the case for Antepartum Surveillance or Timed Delivery for Women of Advanced Maternal Age.Semin Perinatol2008,32:312–317.
34. Nicholson JM PS, Caughey AB, Rosen S, Keen A, Macones GA:The impact of the active management of risk in pregnancy at term on birth outcomes: a randomized clinical trial.Am J Obstet Gynecol2008,
198:511. e511-511.e515.
35. Flenady V, Froen JF, Pinar H, Torabi R, Saastad E, Guyon G, Russell L, Charles A, Harrison C, Chauke L,et al:An evaluation of classification systems for stillbirth.BMC Pregnancy Childbirth2009,9:24.
36. Lahra MM, Gordon A, Jeffery HE, Lahra MM, Gordon A, Jeffery HE:
Chorioamnionitis and fetal response in stillbirth.Am J Obstet Gynecol
2007,196(3):229. e221-224.
37. Griffiths PD, Paley MN, Whitby EH:Post-mortem MRI as an adjunct to fetal or neonatal autopsy.Lancet2005,365(9466):1271–1273.
38. Raynes-Greenow CH, Hadfield R, Gordon A, Morris JM, Roberts CL:
Identifying stillbirths from three New South Wales record-linked population health data sets, 2001-2005.InISA and ISPID Joint Conference: 2010. Sydney, Australia: Journal of Paediatrics and Child Health; 2010:13.
doi:10.1186/1471-2393-13-12
Cite this article as:Gordonet al.:Risk factors for antepartum stillbirth
and the influence of maternal age in New South Wales Australia: A population based study.BMC Pregnancy and Childbirth201313:12.
Submit your next manuscript to BioMed Central and take full advantage of:
• Convenient online submission • Thorough peer review
• No space constraints or color figure charges • Immediate publication on acceptance
• Inclusion in PubMed, CAS, Scopus and Google Scholar
• Research which is freely available for redistribution