Proceedings
Look who is calling: a comparison of genotype calling algorithms
Maren Vens, Arne Schillert, Inke R König and Andreas Ziegler*
Address: Institut für Medizinische Biometrie und Statistik, Universität zu Lübeck, 23538 Lübeck, Germany E-mail: Maren Vens - [email protected]; Arne Schillert - [email protected]; Inke R König - [email protected]; Andreas Ziegler* - [email protected]
*Corresponding author
fromGenetic Analysis Workshop 16 St Louis, MO, USA 17-20 September 2009
Published: 15 December 2009
BMC Proceedings2009,3(Suppl 7):S59 doi: 10.1186/1753-6561-3-S7-S59
This article is available from: http://www.biomedcentral.com/1753-6561/3/S7/S59
©2009 Vens et al; licensee BioMed Central Ltd.
This is an open access article distributed under the terms of the Creative Commons Attribution License (http://creativecommons.org/licenses/by/2.0), which permits unrestricted use, distribution, and reproduction in any medium, provided the original work is properly cited.
Abstract
In genome-wide association studies, high-level statistical analyses rely on the validity of the called genotypes, and different genotype calling algorithms (GCAs) have been proposed. We compared the GCAs Bayesian robust linear modeling using Mahalanobis distance (BRLMM), Chiamo++, and JAPL using the autosomal single-nucleotide polymorphisms (SNPs) from the 500 k Affymetrix Array Set data of the Framingham Heart Study as provided for the Genetic Analysis Workshop 16, Problem 2, and prepared standard quality control (sQC) for each algorithm. Using JAPL, most individuals were retained for the analysis. The lowest number of SNPs that successfully passed sQC was observed for BRLMM and the highest for Chiamo++. All three GCAs fulfilled all sQC criteria for 79% of the SNPs but at least one GCA failed for 18% of the SNPs. Previously undetected errors in strand coding were identified by comparing genotype concordances between GCAs. Concordance dropped with the number of GCAs failing sQC. We conclude that JAPL and Chiamo++ are the GCAs of choice if the aim is to keep as many subjects and SNPs as possible, respectively.
Background
A crucial step in the data generation process of genome-wide association studies is genotype calling. Here, qualitative genotypes are derived from measured signal intensities of the two alleles of a single-nucleotide polymorphism (SNP). Because missing or erroneous genotypes can flaw the high-level statistical association analysis, a series of different genotype-calling algorithms (GCAs) have been proposed [1].
The outcome of these GCAs can differ substantially [2]. We therefore compared different GCAs using the
genotype data from participants of the Framingham Heart Study SNP Health Association Resource project. We investigated the influence of GCAs on autosomal SNPs that passed the filtering by errors in strand coding and standard quality control (sQC).
Methods
Hybridization probe intensity CEL data of 6,848 partici-pants in the Framingham Heart Study was provided as Problem 2 for the Genetic Analysis Workshop 16 (GAW16) [3]. Genotyping was performed using the Affymetrix GeneChip® Human Mapping 500 k Array Set.
We limited our analyses to the 2,466 participants of the 332 families with complete genotypes in the nuclear families.
Three different GCAs were considered for comparison. Bayesian robust linear modeling using Mahalanobis distance (BRLMM) has been recommended by the manufacturer for the 500 k Array Set [4]. Chiamo++ (Italian for“I call”) uses a Bayesian hierarchical four-class mixture model [5]. JAPL (French for“I call”) is based on an expectation-maximization (EM) clustering algorithm that was improved by Plagnol et al. [6]. Where probe intensities had to be normalized beforehand, CelQuantileNorm was used [7]. Normalization had to be split in two parts because of memory access errors when more than approximately 2,000 samples were used in one run. The data were split randomly in two batches of similar size. Chiamo++ and JAPL were run using default settings, BRLMM calls were used as provided for GAW16.
Only those SNPs provided in the GAW16 BRLMM data set were used for further analysis. Furthermore, X-chromosomal SNPs and SNPs with different strand codings in the GCAs were excluded.
For the remaining SNPs, deFinetti triangles presenting allele and genotype distributions were generated for all three GCAs (an example for a deFinetti triangle is given in Figure 1). In these, the two homozygote genotype frequencies for each SNP are read as length of the projections along the sides of the triangle, and the allele frequencies and the proportion of heterozygotes are given on the horizontal and vertical axes [8].
Samples with a call fraction <97% were excluded, and sQC was performed separately for all three GCAs. Specifically, SNPs were excluded if the exact lack-of-fit test for Hardy-Weinberg equilibrium (HWE) revealed p< 10-4, if the minor allele frequency (MAF) was <1%, or if the missing frequency (MiF) was <2%.
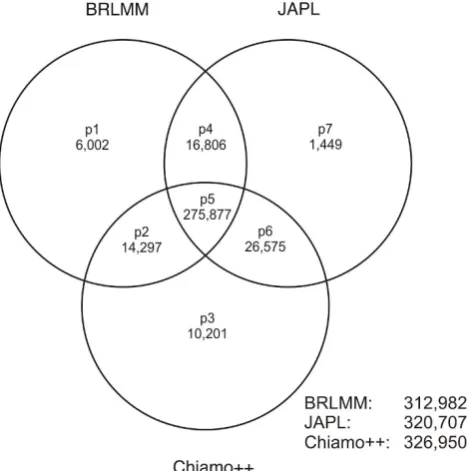
We defined seven different groups of SNPs after sQC according to Figure 2 and investigated the characteristics of SNPs in each group. A detailed analysis of all SNPs was computationally impossible because this would have required a comparison of >3 billion genotypes. We therefore drew a random sample of 10,000 SNPs from group p5 and a random sample of 1,000 SNPs for every other group.
We termed an individual to be concordant for the considered GCAs if the GCAs yielded the same result (genotype or missing) for the specific SNP. We then derived concordance fractions on the SNP level. Con-fidence intervals were estimated as 95% exact Blyth-Still-Casella confidence intervals (95% CI).
Analyses were performed in the statistical package R, version 2.7.1, with the GenABEL, version 1.4-1 library [9]. The analyses were carried out on an Intel Quad-Core Dual Xeon E5345 computer with a 2.33 GHz processor, 32 GB RAM, and a 64-bit SUSE Enterprise Linux operating system.
Results and discussion
A total of 486,605 SNPs were provided for GAW16. We excluded 63,950 SNPs because of different strand coding or allele flips, leaving 422,655 SNPs for further analysis. The deFinetti triangles (Figure 3) give an overview of the genotype distribution of these SNPs. BRLMM and JAPL showed excess heterozygosity, i.e., more heterozygous subjects than expected under HWE, for a larger number of SNPs than Chiamo++ (BRLMM, 56.04%; Chiamo++, 53.66%; JAPL, 56.74%). Both algorithms revealed many SNPs with a high number of heterozygous subjects but low frequency for one of the homozygous genotypes.
In contrast, Chiamo++ more often led to genotype distributions at the boundary of the deFinetti triangle
Figure 1
than BRLMM and JAPL (BRLMM, 19.77%; Chiamo++, 23.83%; JAPL, 20.06%), where the boundary was defined by a frequency of <2 × 10⁻³ for one genotype group per SNP without counting monomorphic SNPs. Interestingly, Chiamo++ yielded SNPs with an extremely low heterozygosity (<2 × 10⁻³) more often than BRLMM and JAPL (BRLMM, 1.84%; Chiamo++, 5.39%; JAPL, 1.95%). These SNPs fell in one of two groups: The first had a MAF lower than 20% but only 2.5% heterozygous subjects. For the second, one could imagine that they form the rudiment of a second curve with maximum at the point (0.5; 0.25). As in the first group of SNPs, this curve was only observed for SNPs with MAF<20%. Because this curve is usually seen for X-linked SNPs if males and females are pooled, we investigated the genotype frequencies for a series of these SNPs by sex but we detected no differences.
The call fraction was >0.97 for all individuals in JAPL. Five subjects were excluded using Chiamo++. BRLMM called these five participants and an additional four with a fraction of <0.97. This finding is in line with the conclusions drawn by the developers of JAPL, who state that their algorithm was specifically designed to deal with uncertain genotypes which are said to be missing by other GCAs [6].
Based on the subset of individuals who passed sQC for all three GCAs, the observations from the deFinetti triangles are confirmed by results of sQC (Table 1): for Chiamo++, twice as many SNPs failed the HWE criterion. Most SNPs failed due to MAF criterion in Chiamo++, but rates are comparable among all three algorithms. For
Figure 2
Venn diagram of the SNPs passing sQC after different calling algorithms. SNPs in different groups p1 to p7 passed sQC for different combinations of calling algorithms, e.g., SNPs from group p1 only passed sQC for BRLMM, whereas in group p5 SNPs passed sQC for all three algorithms. In addition, the Venn diagram gives the number of SNPs passing sQC in each calling algorithm. A total of 351,207 SNPs out of 422,655 SNPs passed the sQC for at least one calling algorithm.
Figure 3
BRLMM and JAPL, most SNPs failed the MiF criterion. Interestingly, BRLMM removed almost twice as many SNPs as Chiamo++ through this criterion.
In total, the highest number of SNPs fulfilling all sQC criteria was obtained using Chiamo++ (77.36%) and the smallest number was obtained using BRLMM (74.05%). 351,207 SNPs (83.10%) passed the sQC in at least one algorithm. Of these SNPs, 78.55% fulfilled all sQC criteria for all three GCAs jointly (Figure 2).
In summary, if the aim is to keep as many subjects as possible for analysis, which is of interest in genome-wide association studies with a small sample size or in family-based genome-wide association studies, JAPL would be the GCA of choice. Chiamo++ would be preferred if one aims at keeping a high number of SNPs for further analysis.
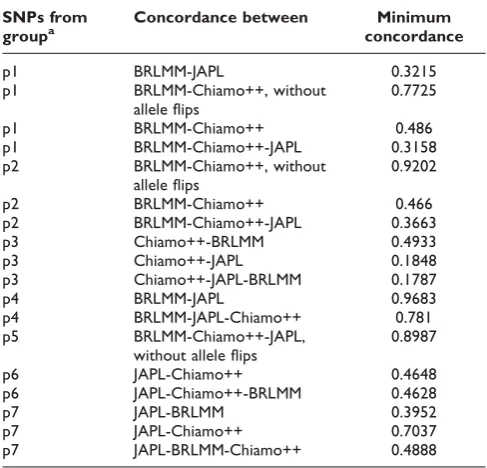
Results of the concordance estimation are summarized in Table 2. In group p5, six SNPs showed a concordance <0.52. All other SNPs had a concordance >0.89. The six
SNPs with low concordance had a MAF~50%, and all were either GC or AT SNPs, so these represented errors in strand codings that were not detected in the filtering step. Because these SNPs were identified in a random sample of 10,000 SNPs, the total number of SNPs that fulfilled all sQC criteria but had undetected errors in strand coding is expected to be 165.53 (95% CI: 82.76-358.64).
There were two SNPs in group p2 that had a concordance <0.48. Both SNPs had a MAF~50% and were GC SNPs. All other SNPs in this group had a concordance >0.92. In p4, all SNPs had a concordance >0.96. In p6, the concordance was only >0.46, but we were not able to detect the cause.
In general, estimating concordance with one or more GCAs failing sQC led to considerably lower values. Specifically, we found dramatically low concordance fractions (mini-mum concordance fractions between 18% and 78%) for SNPs that did not pass sQC in all considered GCAs. This might be due to the fact of disagreement in calling genotypes as“missing”.
Conclusion
Among the investigated GCAs, JAPL is recommended if the aim is to keep as many subjects as possible for analysis. Chiamo++ would be preferred if the number of SNPs for further analysis needs to be high. By comparing the concordances between different calling algorithms, otherwise-undetected errors in strand coding were identified. Considering SNPs that did not pass the sQC in at least one of the considered algorithms, the concordance frequency is considerably lower.
List of abbreviations used
BRLMM: Bayesian robust linear modeling using Maha-lanobis distance; EM: Expectation maximization; GAW16: Genetic Analysis Workshop 16; GCA: Geno-type-calling algorithms; HWE: Hardy-Weinberg equili-brium; MAF: Minor allele frequency; MiF: Missing frequency; SNP: Single-nucleotide polymorphism; sQC: Standard quality control.
Competing interests
The authors declare that they have no competing interests.
Table 1: Overview of sQC
No. SNPs removed (%)
QC criteria BRLMM Chiamo++ JAPL
Failed MAF 37,259 (8.85%) 44,181 (10.45%) 39,201 (9.27%)
Failed MiF 76,528 (18.11%) 41,939 (9.92%) 62,969 (14.90%)
Failed HWE 7,519 (1.78%) 16,891 (4.00%) 7,208 (1.71%)
Passed all sQC 312,982 (74.05%) 326,950 (77.36%) 320,707 (75.88%)
Table 2: Concordance of calling algorithms
SNPs from
Authors
’
contributions
MV participated in the design of the study, did the calling, prepared the figures, and drafted the manuscript. AS participated in the design of the study and figures, and did the sQC. IRK participated in the design of the study and its coordination and helped to draft the manuscript. AZ conceived of the study, participated in its design, and helped to draft the manuscript. All authors read and approved the final manuscript.
Acknowledgements
The Genetic Analysis Workshops are supported by NIH grant R01 GM031575 from the National Institute of General Medical Sciences. The authors acknowledge the support by grant 01EZ0874 from the German Ministry of Education and Research.
This article has been published as part of BMC Proceedings Volume 3 Supplement 7, 2009: Genetic Analysis Workshop 16. The full contents of the supplement are available online at http://www.biomedcentral.com/ 1753-6561/3?issue=S7.
References
1. Teo YY:Common statistical issues in genome-wide associa-tion studies: a review on power, data quality control, genotype calling and population structure. Curr Opin Lipidol 2008,19:133–143.
2. Samani NJ, Erdmann J, Hall AS, Hengstenberg C, Mangino M, Mayer B, Dixon RJ, Meitinger T, Braund P, Wichmann HE, Barrett JH, König IR, Stevens SE, Szymczak S, Tregouet DA, Iles MM, Pahlke F, Pollard H, Lieb W, Cambien F, Fischer M, Ouwehand W, Blankenberg S, Balmforth AJ, Baessler A, Ball SG, Strom TM, Braenne I, Gieger C, Deloukas P, Tobin MD, Ziegler A, Thompson JR, Schunkert H and for the WTCCC and the Cardiogenics Consortium: Genome-wide association analysis of coronary artery disease.N Engl J Med2007,357:443–453. 3. Cupples LA, Heard-Costa N, Lee M and Atwood LD: Genetic
Analysis Workshop 16 Problem 2: The Framingham Heart Study Data.BMC Proc2009,3(suppl 7):S3.
4. Affymetrix:BRLMM: An improved genotype calling method for the GeneChip® Mapping 500K Array Set.http://affymetrix. com/support/technical/whitepapers/brlmm_whitepaper.pdf. 5. Wellcome Trust Case Control Consortium: Genome-wide
association study of 14,000 cases of seven common diseases and 3,000 shared controls.Nature2007,447:661–678. 6. Plagnol V, Cooper JD, Todd JA and Clayton DG: A method to
address differential bias in genotyping in large-scale associa-tion studies.PLoS Genet2007,3:e74.
7. CelQuantileNorm.http://www.wtccc.org.uk/info/software.shtml. 8. Ziegler A and König IR: A Statistical Approach to Genetic
Epidemiology: Concepts and Applications.Weinheim, Wiley-VCH; 2006.
9. Aulchenko YS, Ripke S, Isaacs A and van Duijn CM:GenABEL: an R library for genome-wide association analysis. Bioinformatics 2007,23:1294–1296.
Publish with BioMed Central and every scientist can read your work free of charge
"BioMed Central will be the most significant development for disseminating the results of biomedical researc h in our lifetime."
Sir Paul Nurse, Cancer Research UK
Your research papers will be:
available free of charge to the entire biomedical community
peer reviewed and published immediately upon acceptance
cited in PubMed and archived on PubMed Central
yours — you keep the copyright