Open Access
Research
Using microarrays to identify positional candidate genes for QTL:
the case study of ACTH response in pigs
Vincent Jouffe
†1, Suzanne Rowe
†2, Laurence Liaubet
†3, Bart Buitenhuis
4,
Henrik Hornshøj
4, Magali SanCristobal
3, Pierre Mormède
1and DJ de
Koning*
2Address: 1Laboratoire PsyNuGen, INRA UMR1286, CNRS UMR5226, Université de Bordeaux 2, 146 rue Léo-Saignat, F-33076 Bordeaux, France, 2The Roslin Institute and R(D)SVS, University of Edinburgh, Roslin EH25 9PS, UK, 3Laboratoire de Génétique Cellulaire, INRA UMR444, F-31326
Castanet-Tolosan, France and 4Department of Genetics and Biotechnology, Faculty of Agricultural Sciences, Aarhus University, DK-8830 Tjele,
Denmark
Email: Vincent Jouffe - [email protected]; Suzanne Rowe - [email protected]; Laurence Liaubet - [email protected]; Bart Buitenhuis - [email protected]; Henrik Hornshøj - [email protected]; Magali SanCristobal - [email protected]; Pierre Mormède - [email protected]; DJ de Koning* - [email protected] * Corresponding author †Equal contributors
Abstract
Background: Microarray studies can supplement QTL studies by suggesting potential candidate
genes in the QTL regions, which by themselves are too large to provide a limited selection of candidate genes. Here we provide a case study where we explore ways to integrate QTL data and microarray data for the pig, which has only a partial genome sequence. We outline various procedures to localize differentially expressed genes on the pig genome and link this with information on published QTL. The starting point is a set of 237 differentially expressed cDNA clones in adrenal tissue from two pig breeds, before and after treatment with adrenocorticotropic hormone (ACTH).
Results: Different approaches to localize the differentially expressed (DE) genes to the pig genome
showed different levels of success and a clear lack of concordance for some genes between the various approaches. For a focused analysis on 12 genes, overlapping QTL from the public domain were presented. Also, differentially expressed genes underlying QTL for ACTH response were described. Using the latest version of the draft sequence, the differentially expressed genes were mapped to the pig genome. This enabled co-location of DE genes and previously studied QTL regions, but the draft genome sequence is still incomplete and will contain many errors. A further step to explore links between DE genes and QTL at the pathway level was largely unsuccessful due to the lack of annotation of the pig genome. This could be improved by further comparative mapping analyses but this would be time consuming.
from EADGENE and SABRE Post-analyses Workshop Lelystad, The Netherlands. 12–14 November 2008
Published: 16 July 2009
BMC Proceedings 2009, 3(Suppl 4):S14 doi:10.1186/1753-6561-3-S4-S14
<supplement> <title> <p>EADGENE and SABRE Post-analyses Workshop</p> </title> <editor>Dirk-Jan de Koning</editor> <sponsor> <note>The publication of these proceedings was supported by the EC-funded Network of Excellence EADGENE (EC contract number FOOD-CT-2004-506416).</note> </sponsor> <note>Proceedings</note> <url>http://www.biomedcentral.com/content/pdf/1753-6561-3-S4-info.pdf</url> </supplement>
This article is available from: http://www.biomedcentral.com/1753-6561/3/S4/S14
© 2009 Jouffe et al; licensee BioMed Central Ltd.
Conclusion: This paper provides a case study for the integration of QTL data and microarray data for a species with limited genome sequence information and annotation. The results illustrate the challenges that must be addressed but also provide a roadmap for future work that is applicable to other non-model species.
Background
There is a wealth of information that has been collated from many QTL studies over the last decade, summarised in resources such as animalQTLdb [1]. With the advent of 'omics technologies such as gene expression microarrays, new ways of studying genetic variation through so called 'endo-phenotypes' are becoming increasingly popular. As the volume of data from these new technologies increases, the current challenge is to combine existing knowledge gained from linkage studies with new information to pro-pose candidate genes in QTL regions. Such an integration has previously been proposed by Fisher et al (2007) deal-ing with mouse models for trypanotolerance [2].
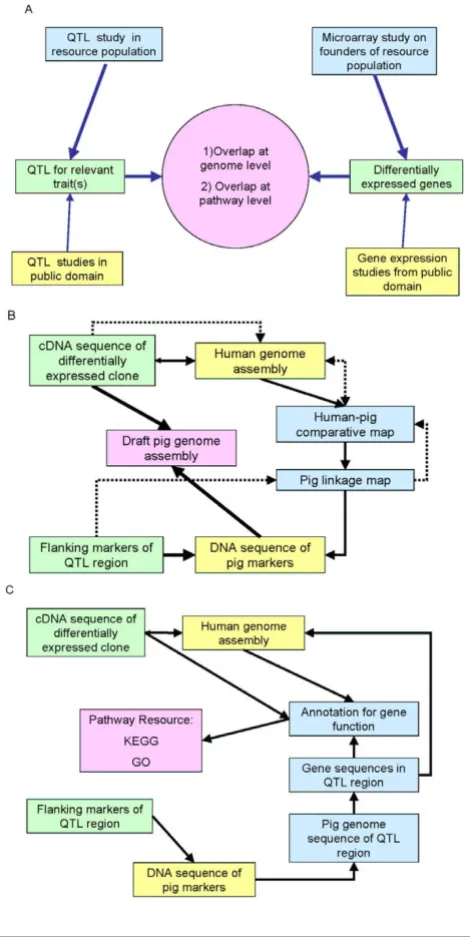
The general principle of complementing QTL studies with gene expression data is illustrated in Figure 1A. The goal is to identify overlap between differentially expressed genes and QTL regions at either the genome or the pathway level. Differentially expressed genes in the QTL region are obvious positional candidate genes for the QTL. Differen-tially expressed genes elsewhere in the genome might share pathways with genes in the QTL region and reflect downstream effects of the QTL. The study of genes at the pathway level is also important to identify positional can-didate genes in the QTL region that are not represented on the microarray.
Linking gene expression results with QTL data has mainly been applied to studies where gene expression was meas-ured on individuals that have a direct link to the QTL study (e.g. the founders of an F2 QTL experiment [2,3]). The principle can be extended to include QTL and gene expression results from the public domain but requires careful consideration of the biological relevance between different studies.
The goal of this paper is to present a case study to integrate QTL data and microarray data for an experiment in pig, which has only a partial genome sequence. We outline various procedures to localize differentially expressed genes on the pig genome and link this with information on published QTL.
Linking QTL and microarray results becomes quite chal-lenging when the genome of the target species has not been fully sequenced as annotation becomes extremely dependent on identification of homologues. Figure 1B illustrates the different routes that can, or must, be taken
to test for co-location at the genome level for the present study. In order to place genes on the pig genome, one might have to go via the human genome using compara-tive mapping approaches.
The challenges increase for comparisons at the pathway level because in order to map differentially expressed clones to pathways they need to have functional annota-tion (Figure 1C). Furthermore, the pathway databases are almost exclusively populated with data derived from other species than the pig.
For this part of the EADGENE/SABRE workshop, the microarray results by Hazard et al (2008) [4] were distrib-uted among participants. The starting point for each group was a list of 237 differentially expressed transcripts. This article summarises the analyses of three different groups that analysed the data independently: the analyses performed by VJ, LL, MSC and PM will be indicated by INRA; the analyses by BB and HH are indicated by AARHUS while those from SR and DJK are denoted ROS-LIN. Where appropriate, we have integrated results into single tables and figures while some of the original results from the separate groups are provided as supplementary files (Additional file 1 and 2). In line with the other work-shop papers, this manuscript will focus on the results of the various analyses and, in doing so illustrate the oppor-tunities and challenges of combining microarrays and QTL. This paper provides several strategies as well as actual scripts (Additional file 3) for integration of QTL and gene expression results that are portable to other spe-cies.
Methods
Désautés et al. (2002) [5] looked at QTL regions associ-ated with basal levels and stress responses by studying behaviour, ACTH and cortisol levels after exposure to a stressful environment. Furthermore, cortisol has potent metabolic effects and influences numerous traits related to production, such as growth rate and carcass composi-tion. Therefore, it is of interest to examine whether genes differentially expressed in the adrenal gland could be mapped to published QTL related to production traits. Finally, we used this mapping information to explore the underlying functional pathways and mechanisms involved in the differences between the two breeds.
Analyses by the INRA group
Two types of analyses were performed: 1) a focussed ana-lysed of 12 genes, 2) a global analyses for co-location between all differentially expressed genes and QTL from the public domain.
Focussed analyses of 12 genes
Among the differentially expressed genes from Hazard et al. (2008) [4], the nine most differentially expressed genes (FDR<10-6) that have been functionally annotated have
been studied in more detail: the ring finger protein 2 (Rnf2, BX673517), the Cbp/p300-interacting transactiva-tor, with Glu/Asp-rich carboxy-terminal domain, 1 (Cited1, BX918031), the cAMP responsible element mod-ulator (Crem, BX670994), the CD83 molecule (Cd83, AW42951), the eukaryotic translation initiation factor 1B (Eif11b, BX926052), the alanyl aminopeptidase (Anpep, BX665286), the acyl-Coenzyme A oxidase 1, palmitoyl (Acox1, BX673098), the alpha-2-macroglobulin (A2m, BX674240), the growth arrest and DNA-damage-induci-ble beta (Gadd45b, BX671980) genes. The steroidogenic acute regulator (Star, BX669487), the low density lipopro-tein receptor (Ldlr, BX673438) and the creatine kinase, brain (Ckb, BX920566) have been added because their role into the adrenal sensitivity to adrenocorticotropic hormone is known.
The sequences have been downloaded from the SIGENAE website http://www.sigenae.org. These twelve genes were first aligned to the human genome on ENSEMBL release 49 and 50 (for the Cd83 and Rnf2 genes) on ENSEMBL website http://www.ensembl.org/Homo_sapiens/blast view using BLAT program [6] with default parameters.
Subsequently, these genes have been mapped on pig chro-mosomes by synteny using the comparative map [7]. Finally, these genes were also localised on the draft pig genome sequence (release 6) that was downloaded from the ftp Sanger website: ftp://ftp.sanger.ac.uk/pub/ S_scrofa/assemblies/PreEnsembl_Sscrofa6/. This release of the draft genome sequence was incomplete and no sequence data for chromosomes 3, 9, 16 and 18 was
The process of combining QTL and gene expression results
Figure 1
The process of combining QTL and gene expression
results. Panel A shows the two areas of comparing gene
present. The sequences have been formatted for alignment using formatdb software[8]. The twelve most differen-tially expressed genes have been aligned to the pig chro-mosomes using BLASTn program [8] from the blastall tool [9] with default parameters.
In the next step, the locations of these 12 genes were com-pared with published QTL results. QTL data were down-loaded from the Pig Quantitative Trait Locus database (PigQTLdb) http://www.animalgenome.org/QTLdb/ pig.html[10,11]. PigQTLdb release 6 contains 1,831 QTL from 113 publications. Those QTL describe mainly meat quality traits but also health, production and reproduc-tion traits. Genes were considered to be co-localized with QTL when they were positioned within the confidence interval of the QTL as indicated at PigQTLdb.
Analysis of all the differentially expressed genes and QTL for stress responses
The second part of the work illustrates another approach to study differentially expressed gene in the context of rel-evant QTL. This approach was presented previously [12] in order to emphasize a subset of genes among a larger list of differentially expressed genes.
First, all the differentially expressed genes [4] have been systematically localized on the human genome. This was done with the BioMart software available on the Public Sigenae Contig Browser:
http://public-contigbrowser.sigenae.org:9090/ Sus_scrofa/index.html.
Secondly, we recovered the QTL published for analysis of behavioural and neuroendocrine responses to stress con-ducted in a three-generation experimental cross between Meishan and Large White pig breeds [13] from pigQTLdb [10,11]. Using the position of the QTL on the genetic map, a putative orthogonal genomic position could be obtained with a human chromosome. The comparative mapping strategy between human and pig and the several pig maps (genetic and RH) aims to identify syntenic regions.
The results from the focussed and the global analyses have been compared in order to corroborate the localization of regulated genes in QTL regions. To obtain more precise information, the candidate genes should also be mapped on the pig RH map using the INRA-Minnesota 7000 rads radiation hybrid panel (IMpRH) as was done in a previ-ous work [12].
Analyses by the AARHUS group
The aim was to map the differentially expressed genes to the porcine genome in order to test for overlap between
differentially expressed genes and QTL. The accession numbers of the 237 differentially expressed genes were used to extract the gene sequences from the nucleotide database from NCBI. The sequences were mapped on the pre-ensemble (release 6) porcine genome using the BLASTN program. The pig genome sequence database did not contain information on SSC3, SSC9, SSC16 and SSC18.
Analyses by the Roslin group
There were three main routes of interest: 1) accurately position differentially expressed genes in the genome to see whether they co-locate with regions of suggestive or confirmed linkage; 2) look at the genes under a QTL peak and see if they match the differentially expressed genes; 3) perhaps of greatest interest is to examine whether the genes under a QTL peak belong to the same pathway or regulatory network as differentially expressed genes and whether these pathways link QTL peaks on different chro-mosomes together i.e. are enriched in identified QTL regions compared to the rest of the genome.
Positioning of differentially expressed genes
Version 7 of the porcine genome was downloaded from the Sanger website. ftp://ftp.sanger.ac.uk/pub/S_scrofa/ assemblies/PreEnsembl_Sscrofa7/ and was formatted into a searchable database using the software formatdb [8]. Using the GenBank accession numbers from the list of 211 differentially expressed genes, fasta files were extracted containing the sequence for each gene. Each gene sequence was blasted against pig genome using blastall [9]. A word length of 20 (-W 20) was used to reduce the number of spurious hits. We used the blast results to ascertain the most likely position of each differ-entially expressed gene.
Identifying genes under the QTL peak
To identify which of the differentially expressed genes were under the QTL regions for stress responses described by Désautés et al. (2002) [14], the flanking markers of the QTL needed to be accurately placed on the pig genome. Analogous to the genes, the sequence of the flanking markers was blasted against the draft porcine genome. The QTL on chromosome 1 was flanked by S0155 and S0374, corresponding to 144–160 Mb on the draft genome sequence. The QTL on chromosome 7 was flanked by S0101 and SW2446, corresponding to 112–125 Mb on the draft genome sequence. Using Entrez gene http:// www.ncbi.nlm.nih.gov/sites/entrez we obtained a list of genes that are located between these markers.
Annotation and pathway analysis
databases. The first step is to confirm the KEGG identifi-ers, and from these link to the KEGG pathway identifiidentifi-ers, and subsequently map to pathways and get the relevant GO terms. The following FTP sites were queried to obtain the relevant pathways and GO terms: ftp://ftp.genome.jp/ pub/kegg/genes/organisms/ssc/ssc_ncbi-geneid.list, ftp:// ftp.genome.jp/pub/kegg/genes/organisms/ssc/
ssc_pathway.list/, ftp://ftp.genome.jp/pub/kegg/path way/map_title.tab, and ftp://ftp.ncbi.nlm.nih.gov/gene/ DATA/gene2go.gz
All scripts for these procedures are available in Additional file 3.
Results and discussion
Focussed analysis of 12 genes (INRA)
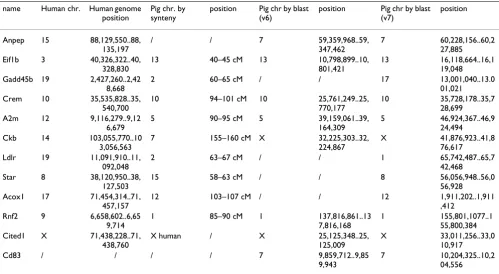
The localization of the twelve differentially expressed genes on the pig genome has been realised by two differ-ent methods. First, the genes have been aligned to the human genome then mapped on the pig chromosomes by synteny using the comparative map [7]. Second, the genes have been directly aligned to the draft pig genome sequence. The different results are compared in Table 1. The Eif1b, Crem, A2m and Rnf2 genes have been mapped on chromosomes 13, 10, 5 and 1, respectively by both methods. Cited1 has been localized on the pig chromo-some X and the human chromochromo-some X. The Pig RH map – human comparative map is not available for X/Y
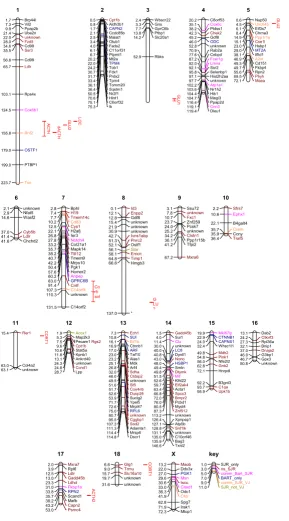
chro-mosomes [7]. Nevertheless, the comparative tool from the Rat Genome Database [15]http://rgd.mcw.edu/VCMAP/ mapview.shtml showed similarities between the X chro-mosomes from human, rat and mouse genomes, thus it can be hypothesized that the X chromosomes from the human and the pig genomes are conserved. The Ckb gene has been mapped on chromosome X by alignment against the pig genome and on chromosome 7 by alignment on a human genome region that in syntenic with porcine chro-mosome 7. Anpep and Cd83 have only been mapped on chromosome 7 by alignment against pig genome. The Gadd45b, Ldlr, Star and Acox1 genes have only been mapped on chromosomes 2, 2, 15 and 12, respectively by synteny after alignment against human genome. The com-parative map [7] showed syntenic blocks. According to the "synteny blocks" definition from Pevzner and Tesler [16], the Anpep, Gadd45b, Ckb, Ldlr, Star, Acox1 and Cd83 genes should be mapped on dissimilar regions. The con-sensus location of all 12 genes is highlighted in Figure 2, including the 4 genes that could not initially be mapped to the porcine sequence but were successfully mapped to version 7 of the draft genome (Roslin).
Each of the genes that were mapped on the pig genome has been co-localized with published QTL from pigQTLdb. Eif1b gene has been co-localized with 15 QTL, Ldlr gene with 29 QTL, Crem gene with 10 QTL, Gadd45b gene with 29 QTL, A2m gene with 13 QTL, Ckb gene with
Table 1: Location of 12 most significant genes using human genome sequence, porcine syntenic regions, and draft porcine genome assembly (version 6 and 7, respectively)
name Human chr. Human genome
position
Pig chr. by synteny
position Pig chr by blast (v6)
position Pig chr by blast
(v7)
position
Anpep 15 88,129,550..88,
135,197
/ / 7 59,359,968..59,
347,462
7 60,228,156..60,2
27,885
Eif1b 3 40,326,322..40,
328,830
13 40–45 cM 13 10,798,899..10,
801,421
13 16,118,664..16,1
19,048
Gadd45b 19 2,427,260..2,42
8,668
2 60–65 cM / / 17 13,001,040..13.0
01,021
Crem 10 35,535,828..35,
540,700
10 94–101 cM 10 25,761,249..25,
770,177
10 35,728,178..35,7
28,699
A2m 12 9,116,279..9,12
6,679
5 90–95 cM 5 39,159,061..39,
164,309
5 46,924,367..46,9
24,494
Ckb 14 103,055,770..10
3,056,563
7 155–160 cM X 32,225,303..32,
224,867
X 41,876,923..41,8
76,617
Ldlr 19 11,091,910..11,
092,048
2 63–67 cM / / 1 65,742,487..65,7
42,468
Star 8 38,120,950..38,
127,503
15 58–63 cM / / 8 56,056,948..56,0
56,928
Acox1 17 71,454,314..71,
457,157
12 103–107 cM / / 12 1,911,202..1,911
,412
Rnf2 9 6,658,602..6,65
9,714
1 85–90 cM 1 137,816,861..13
7,816,168
1 155,801,1077..1
55,800,384
Cited1 X 71,438,228..71,
438,760
X human / X 25,125,348..25,
125,009
X 33,011,256..33,0
10,917
Cd83 / / / / 7 9,859,712..9,85
9,943
7 10,204,325..10,2
Inferred locations of differentially expressed genes and ACTH response related QTL on the porcine genome
Figure 2
Inferred locations of differentially expressed genes and ACTH response related QTL on the porcine genome.
Positions are given in Mb derived from the draft assembly of the pig genome (version 7). Black gene symbol denotes genes positioned by SJR using blast against pig genome sequence build 7, brown gene symbol denotes best position for a gene although not significant in the blast output (e-value < 0.0001). Pink are genes positioned in common by both build 6 and build 7 of the pig genome sequence, dark blue are genes positioned differently by build 6, orange are genes positioned by version 6 and human orthologues, green are genes that could not be positioned by human orthologues or build 6. Red bars denote confi-dence intervals for QTL associated with glucose, cortisol and ACTH from analyses by Desautes et al., 2002.
7 QTL, Star gene with 19 QTL, Acox1 gene with 5 QTL and Rnf2 gene with 22 QTL. Only the results for the Ldlr gene are detailed here (Table 2). The results for the other genes are in the Additional file 2. The Ldlr gene has been located on chromosome 2 from 63 to 67 cM. 29 QTL from 14 publications for 28 different traits have been co-localised with Ldlr gene. The "pH for Longissmus dorsi" trait has been associated to two loci (QTL_id 791 and 2976). Each locus corresponded to one publication. The QTL 781 has been reported by Su et al. [17] from an F2 cross between Large White and Meishan pigs. This QTL was located from 59.5 to 72.4 cM on SSC2. The QTL 2976 has been studied by Rohrer et al. [18] in a Duroc × Landrace F2 population. It has been mapped to an interval from 63.2 to 74.8 cM.
Analysis of all the differentially expressed genes and QTL for stress responses (INRA)
From the 237 sequences in BIOMART, 214 were systemat-ically localized on the human genome and 23 sequences could not be mapped. The differentially expressed genes identified as being co-localized with a QTL for the cortico-trope axis are presented in supplementary Table S1 of Additional file 1.
One question is to know whether co-localization between regulated genes and a QTL is significant. The probability of finding the observed genes and a QTL in the same genomic region by random chance could be estimated. The complete pig genome is about 2255 cM for the 18 autosomes. Using R software http://www.cran.r-project.org, the exact binomial test is about 4–35% for the co-localization by chance of a subset of regulated genes among the 211 regulated genes. The probability is high (35%) for the co-localization of three regulated genes with a QTL region of 30 cM (SSC1) by chance. However, in another example the QTL at 17 cM on SSC5 shows an interval of only 2 cM in which we find 7 differentially expressed genes. The probability should be very low to find seven differentially expressed genes by chance in this region. But the comparative mapping is imprecise for this region and a region of 50 cM should be taken into account. Nevertheless, the probability to find by chance seven regulated genes and a QTL in the same region of 50 cM is less than 4%.
Table 2: QTL in the Ldlr gene region of pig chromosome 2.
QTL_ID QTL_symbol Trait_name Position_cM range_cM Publication
307 BFT Average backfat 44,8 42–64,3 Rattink et al. [22]
3107 FP fat ratio (percentage) 49,8 42,3–64,8 Stratil et al. [23]
275 vnum Vertebra number 53 42–59,5 Wada et al. [24]
669 Lmdepth Loin depth at the last ribs 54 45–81 Varona et al. [25]
3116 MP Melting Point 54 53,5–59,5 Nii et al. [26]
809 LEANWT Lean mass (weight) 56 42–70 Geldermann et al. [27]
907 ABF abdominal fat 59,3 57,4–66,1 Lee et al. [28]
3224 JUICES subjective juiciness score 59,5 60,6–59,5 Edwards et al. [29]
748 LUMBF backfat between the last 3th and 4th lumbar 60 Qu et al. [30]
749 LEANP Lean meat percentage 60 Qu et al. [30]
2973 shefor shear force 61 60,6–63,2 Rohrer et al. [18]
2974 SJCS subjective chew score 62 60,6–63,2 Rohrer et al. [18]
911 liverwt Liver weight 62,4 57,4–66,1 Lee et al. [28]
2796 DiaMF Diameter of Muscle Fiber 63 62,9–85,9 Wimmers et al. [31]
2797 DiaMF Diameter of Muscle Fiber 63 62,9–85,9 Wimmers et al. [31]
906 pH pH 24 hours post mortem (loin) 63,6 57,4–66,1 Lee et al. [28]
912 efatsho External fat on shoulder 64,2 57,4–66,1 Lee et al. [28]
3039 ihern Inguinal Hernia 64,3 Grindflek et al. [32]
908 BFW backfat weight 64,9 57,4–66,1 Lee et al. [28]
747 34ribBF backfat between the last 3th and 4th rib 65 Qu et al. [30]
3225 off-flavor subjective off-flavor score 65,1 85,1–60,6 Edwards et al. [29]
913 LEA loin eye area 65,5 57,4–66,1 Lee et al. [28]
2798 DiaMF Diameter of Muscle Fiber 66 62,9–85,9 Wimmers et al. [31]
781 pH pH for Longissmus Dorsi 67 59,5–72,4 Su et al. [17]
2975 MMP muscle moisture percentage 67 63,2–74,8 Rohrer et al. [18]
2976 pH pH for Longissmus Dorsi 67 63,2–74,8 Rohrer et al. [18]
670 loineyea Loin muscle area 68 61–80 Varona et al. [25]
82 mcolorl Hormel loin Minolta 72,4 55–77,9 Malek et al. [33]
88 whcap water holding capacity 74,8 55–74,8 Malek et al. [33]
Mapping all differentially expressed genes to the draft genome sequence (AARHUS, ROSLIN)
Using version 6 of the draft genome (AARHUS), 33 genes (13.8%) could be mapped to the porcine genome. Those genes which were mapped were spread over the different chromosomes and did not cluster on a specific chromo-some or on a specific chromosomal region. Using version 7 of the draft sequence, the blast search yielded 8000 hits and many genes mapped to multiple chromosomes. The top hit for each gene was used as the most likely position using the bit score and e-values. The Blast output is avail-able from SR on request. Figure 2 shows the distribution of the genes across the chromosomes. Figure 2 also indi-cates the gene locations identified by INRA and AARHUS as well as any discrepancies between the different map-pings. The QTL from Désautés et al. (2002) [19] are also represented in Figure 2.
Differentially expressed genes in the QTL regions (ROSLIN)
Visual inspection of Figure 2 illustrates that there is no obvious enrichment of differentially expressed genes in the QTL regions. In supplementary Tables S2 and S3 of Additional file 1 the differentially expressed genes map-ping to the QTL regions for chromosomes 1 and 7, respec-tively, are listed. The analyses of genes in QTL regions show many discrepancies. For example, some genes have a blast hit within the QTL region but the blast score is highest either elsewhere in the genome or on the chromo-some: STAR has a blast hit within the QTL region on chro-mosome 1 but the best hit from the blast search is on SSC8. There is a STAR-like gene found under the QTL peak for chromosome 1. Similarly Notch 4 maps to the QTL region on SSC7 but the best hit again is outside the QTL region.
Differentially expressed genes close to the QTL region on chromosome 1 include Thioredoxin (Txn) associated with a glucocorticoid receptor and insulin, and fast growth in pigs [20]. The 95 genes identified under the QTL peak included TXN, transforming growth factor beta receptor (TGFBR), 15 genes annotated as 'similar to olfactory receptors', and a steroidogenic regulator or STAR-like domain.
Differentially expressed genes on chromosome 7 map-ping to the QTL region include Anpep associated with glu-tathione metabolism and psychological disorders in humans, and Cntf associated with body mass, obesity and psychiatric disorders in humans. Anpep is upregulated in the Meishan, Anpep and Cntf are down regulated by ACTH.
For the 130 genes mapping under the QTL peak on chro-mosome 7, most were not annotated. However, 20 loci
were similar to olfactory receptors, 1 to thyroid hormone receptor, 5 to glutathione S-transferase including metabo-lism of xenobiotics and drugs by cytochrome P450, 2 to goosecoid receptors and 1 to cytochrome P450. The Ephx gene on chromosome 10 is also associated with cyto-chrome P450. The steroid metabolism pathway contains many of the cytochrome P450 substrates.
Using all of the genes under the QTL peaks, we looked for pathways they might be involved in. For chromosome 1 we found 95 genes in the QTL region with KEGG identifi-ers of which 2 mapped to 13 different pathways. For chro-mosome 7 we identified 130 genes in the QTL region of which only 2 mapped to 4 pathways. It is likely that these results are heavily biased by annotation and therefore of limited use. The next step would be to use homologues to examine the putative pathways. Definition of a gene uni-verse would also be required in order to test sets of genes for enrichment (see companion paper from pathway anal-yses group [21]). This illustrates that one of the main objectives, comparison of differentially expressed genes and QTL regions at the pathway level, is very challenging for non-model species.
Some observations
In spite of all the reservations, this case study illustrates that different routes can be taken to link gene expression results with QTL results. It was illustrated that the ideas easily extrapolate from in-house experiments to public domain data. In theory, one could do discovery science based on public domain gene expression results and QTL databases. These would be expected to generate novel hypotheses about candidate genes under the QTL that could be tested further. In the current example the level of genome information is still too sketchy to identify clear positional candidate genes for the QTL. However, it is expected that the same data could be revisited in some years time and yield more fruitful results. Because in EAD-GENE and SABRE we are working with outbred livestock species, it was decided to use the type of data that is repre-sentative of our work. The analyses presented here provide a starting point for integration of microarray and QTL studies that is portable to other non-model species.
Conclusion
The study lays out a protocol for the examination of QTL and microarray data and suggests ways in which the data can be combined to provide more information.
The different approaches illustrated both the potential and limitation of these approaches. The lack of a reliable genome sequence and poor annotation of the draft assem-bly were the main challenges that hampered integration of results. Nonetheless the results demonstrated that much of the integration can be achieved using basic bio-informatics tools like PERL scripts and public databases.
Competing interests
The authors declare that they have no competing interests.
Authors' contributions
SR, VJ, LL, BB and HH analysed the data. MSC, PM and DJK coordinated the analyses. All authors contributed to the manuscript. PM coordinated the experiments that pro-vided the QTL and microarray data for the analyses pre-sented in this manuscript.
Additional material
Acknowledgements
VJ, LL, MSC and PM thank Zhiliang Hu from PigQTLdb for the raw data. SR and DJK would like to thank Andy Law and Michael Watson for providing bioinformatics support. SR and DJK acknowledge the EC-funded Integrated Project SABRE (EC contract number FOOD-CT-2006-01625) and the BBSRC through an ISPG grant to the Roslin Institute. We acknowledge sup-port from the EC-funded Network of Excellence EADGENE (EC contract number FOOD-CT-2004-506416) for supporting the workshop and publi-cation of this manuscript.
This article has been published as part of BMC Proceedings Volume 3 Sup-plement 4, 2009: EADGENE and SABRE Post-analyses Workshop. The full contents of the supplement are available online at http://www.biomedcen tral.com/1753-6561/3?issue=S4.
References
1. Hu ZL, Fritz ER, Reecy JM: AnimalQTLdb: a livestock QTL
data-base tool set for positional QTL information mining and beyond. Nucleic Acids Res 2007, 35:D604-D609.
2. Fisher P, Hedeler C, Wolstencroft K, Hulme H, Noyes H, Kemp S,
Stevens R, Brass A: A systematic strategy for large-scale analy-sis of genotype phenotype correlations: identification of can-didate genes involved in African trypanosomiasis. Nucleic Acids Res 2007, 35:5625-5633.
3. Liu HC, Cheng HH, Tirunagaru V, Sofer L, Burnside J: A strategy to identify positional candidate genes conferring Marek's dis-ease resistance by integrating DNA microarrays and genetic mapping. Anim Genet 2001, 32:351-359.
4. Hazard D, Liaubet L, Sancristobal M, Mormède P: Gene array and
real time PCR analysis of the adrenal sensitivity to adreno-corticotropic hormone in pig. BMC Genomics 2008, 9:101. 5. Desautes C, Bidanelt JP, Milant D, Iannuccelli N, Amigues Y,
Bour-geois F, Caritez JC, Renard C, Chevalet C, Mormede P: Genetic
linkage mapping of quantitative trait loci for behavioral and neuroendocrine stress response traits in pigs. J Anim Sci 2002,
80:2276-2285.
6. Kent WJ: BLAT – the BLAST-like alignment tool. Genome Res
2002, 12:656-664.
7. Meyers SN, Rogatcheva MB, Larkin DM, Yerle M, Milan D, Hawken
RJ, Schook LB, Beever JE: Piggy-BACing the human genome II.
A high-resolution, physically anchored, comparative map of the porcine autosomes. Genomics 2005, 86:739-752.
8. Altschul SF, Gish W, Miller W, Myers EW, Lipman DJ: Basic local
alignment search tool. J Mol Biol 1990, 215:403-410.
9. Altschul SF, Madden TL, Schaffer AA, Zhang J, Zhang Z, Miller W,
Lip-man DJ: Gapped BLAST and PSI-BLAST: a new generation of
protein database search programs. Nucleic Acids Res 1997,
25:3389-3402.
10. Hu ZL, Dracheva S, Jang W, Maglott D, Bastiaansen J, Rothschild MF,
Reecy JM: A QTL resource and comparison tool for
pigs:PigQTLDB. Mamm Genome 2005, 16:792-800.
11. Hu ZL, Fritz ER, Reecy JM: AnimalQTLdb: a livestock QTL
data-base tool set for positional QTL information mining and beyond. Nucleic Acids Res 2007, 35:D604-D609.
12. Lobjois V, Liaubet L, Sancristobal M, Glenisson J, Feve K, Rallieres J, Le RP, Milan D, Cherel P, Hatey F: A muscle transcriptome anal-ysis identifies positional candidate genes for a complex trait in pig. Anim Genet 2008, 39:147-162.
13. Desautes C, Bidanelt JP, Milant D, Iannuccelli N, Amigues Y,
Bour-geois F, Caritez JC, Renard C, Chevalet C, Mormede P: Genetic
linkage mapping of quantitative trait loci for behavioral and
Additional file 1
Supplementary Tables S1, S2 and S3
Click here for file
[http://www.biomedcentral.com/content/supplementary/1753-6561-3-S4-S14-S1.doc]
Additional file 2
Public domain QTL that co-locate with the top 12 differentially expressed genes.
Click here for file
[http://www.biomedcentral.com/content/supplementary/1753-6561-3-S4-S14-S2.doc]
Additional file 3
A copy of the bash scripts used by ROSLIN
Click here for file
Publish with BioMed Central and every scientist can read your work free of charge "BioMed Central will be the most significant development for disseminating the results of biomedical researc h in our lifetime."
Sir Paul Nurse, Cancer Research UK
Your research papers will be:
available free of charge to the entire biomedical community
peer reviewed and published immediately upon acceptance
cited in PubMed and archived on PubMed Central
yours — you keep the copyright
Submit your manuscript here:
http://www.biomedcentral.com/info/publishing_adv.asp
BioMedcentral
neuroendocrine stress response traits in pigs. J Anim Sci 2002,
80:2276-2285.
14. Desautes C, Bidanelt JP, Milant D, Iannuccelli N, Amigues Y,
Bour-geois F, Caritez JC, Renard C, Chevalet C, Mormede P: Genetic
linkage mapping of quantitative trait loci for behavioral and neuroendocrine stress response traits in pigs. J Anim Sci 2002,
80:2276-2285.
15. Twigger S, Lu J, Shimoyama M, Chen D, Pasko D, Long H, Ginster J,
Chen CF, Nigam R, Kwitek A, et al.: Rat Genome Database
(RGD): mapping disease onto the genome. Nucleic Acids Res
2002, 30:125-128.
16. Pevzner P, Tesler G: Genome rearrangements in mammalian
evolution: lessons from human and mouse genomes. Genome Res 2003, 13:37-45.
17. Su Y, Xiong Y, Jiang S, Zhang Q, Lei M, Zheng R, Deng C: Mapping quantitative trait loci for meat quality trait in a Large White × Meishan cross. Acta Genetica Sinica 2004, 31:132-136.
18. Rohrer GA, Thallman RM, Shackelford S, Wheeler T, Koohmaraie M:
A genome scan for loci affecting pork quality in a Duroc-Lan-drace Fpopulation. Anim Genet 2006, 37:17-27.
19. Desautes C, Bidanelt JP, Milant D, Iannuccelli N, Amigues Y,
Bour-geois F, Caritez JC, Renard C, Chevalet C, Mormede P: Genetic
linkage mapping of quantitative trait loci for behavioral and neuroendocrine stress response traits in pigs. J Anim Sci 2002,
80:2276-2285.
20. Yu M, Geiger B, Deeb N, Rothschild MF: Investigation of TXNIP
(thioredoxin-interacting protein) and TRX (thioredoxin) genes for growth-related traits in pigs. Mamm Genome 2007,
18:197-209.
21. Hedegaard J, Arce C, Bicciato S, Bonnet A, Ramerez-Boo M, Buiten-huis AJ, Collado-Romero M, Conley LN, SanCristobal M, Ferrari F, et al.: Methods for interpreting lists of affected genes obtained in a DNA microarray experiment. BMC Proceedings 2009,
3(Suppl 4):S5.
22. Rattink AP, de Koning DJ, Faivre M, Harlizius B, van Arendonk JA,
Groenen MA: Fine mapping and imprinting analysis for fatness
trait QTLs in pigs. Mamm Genome 2000, 11:656-661.
23. Stratil A, Van PM, Bartenschlager H, Knoll A, Yerle M, Peelman LJ,
Kopecny M, Geldermann H: Porcine OGN and ASPN: mapping,
polymorphisms and use for quantitative trait loci identifica-tion for growth and carcass traits in a Meishan × Pietrain intercross. Anim Genet 2006, 37:415-418.
24. Wada Y, Akita T, Awata T, Furukawa T, Sugai N, Inage Y, Ishii K, Ito Y, Kobayashi E, Kusumoto H, et al.: Quantitative trait loci (QTL) analysis in a Meishan × Gottingen cross population. Anim Genet 2000, 31:376-384.
25. Varona L, Ovilo C, Clop A, Noguera JL, Perez-Enciso M, Coll A, Folch
JM, Barragan C, Toro MA, Babot D, et al.: QTL mapping for
growth and carcass traits in an Iberian by Landrace pig inter-cross: additive, dominant and epistatic effects. Genet Res 2002,
80:145-154.
26. Nii M, Hayashi T, Tani F, Niki A, Mori N, Fujishima-Kanaya N,
Komatsu M, Aikawa K, Awata T, Mikawa S: Quantitative trait loci mapping for fatty acid composition traits in perirenal and back fat using a Japanese wild boar × Large White intercross.
Anim Genet 2006, 37:342-347.
27. Geldermann H, Muller E, Moser G, Reiner G, Bartenschlager H,
Cepica S, Stratil A, Kuryl J, Moran C, Davoli R, et al.: Genome-wide linkage and QTL mapping in porcine F-2 families generated from Pietrain, Meishan and Wild Boar crosses. Journal of Ani-mal Breeding and Genetics 2003, 120:363-393.
28. Lee SS, Chen Y, Moran C, Cepica S, Reiner G, Bartenschlager H,
Moser G, Geldermann H: Linkage and QTL mapping for Sus
scrofachromosome 2. Journal of Animal Breeding and Genetics 2003,
120:11-19.
29. Edwards DB, Ernst CW, Raney NE, Doumit ME, Hoge MD, Bates RO:
Quantitative trait locus mapping in an F2 Duroc × Pietrain resource population: II. Carcass and meat quality traits. J Anim Sci 2008, 86:254-266.
30. Qu Y, Deng C, Xiong Y, Zheng R, Yu L, Su Y, Liu G: The construc-tion of the genetic map and QTL locating analysis on chro-mosome 2 in swine. Acta Genetica Sinica 2002, 29:972-976. 31. Wimmers K, Fiedler I, Hardge T, Murani E, Schellander K, Ponsuksili
S: QTL for microstructural and biophysical muscle proper-ties and body composition in pigs. BMC Genet 2006, 7:15.
32. Grindflek E, Moe M, Taubert H, Simianer H, Lien S, Moen T:
Genome-wide linkage analysis of inguinal hernia in pigs using affected sib pairs. BMC Genet 2006, 7:25.
33. Malek M, Dekkers JC, Lee HK, Baas TJ, Prusa K, Huff-Lonergan E,
Rothschild MF: A molecular genome scan analysis to identify
chromosomal regions influencing economic traits in the pig. II. Meat and muscle composition. Mamm Genome 2001,