R E S E A R C H A R T I C L E
Open Access
Sexual violence and pregnancy-related physical
symptoms
Mirjam Lukasse
1,2*, Lena Henriksen
3, Siri Vangen
4and Berit Schei
1,5Abstract
Background:Few studies have investigated the impact of sexual violence on health during pregnancy. We examined the association between sexual violence and the reporting of physical symptoms during pregnancy. Methods:A population-based national cohort study conducted by The Norwegian Mother and Child Cohort study (MoBa) collected data from pregnant women through postal questionnaires at 17 and 32 weeks gestation. Three levels of sexual violence were measured: 1) mild (pressured into sexual relations), 2) moderate (forced with violence into sexual relation) and 3) severe (rape). Differences between women reporting and not reporting sexual violence were assessed using Pearson’sX2test and multiple logistic regression analyses.
Results:Of 78 660 women, 12.0% (9 444) reported mild, 2.8% (2 219) moderate and 3.6% (2 805) severe sexual violence. Sexual violence was significantly associated with increased reporting of pregnancy-related physical symptoms, both measured in number of symptoms and duration/degree of suffering. Compared to women not reporting sexual violence, the probability of suffering from≥8 pregnancy-related symptoms estimated by Adjusted Odds Ratio (AOR) was 1.49 (1.41–1.58) for mild sexual violence, 1.66(1.50–1.84) for moderate and 1.78 (1.62–1.95) for severe. Severe sexual violence both previously and recently had the strongest association with suffering from≥8 pregnancy-related symptoms, AOR 6.70 (2.34–19.14).
Conclusion:A history of sexual violence is associated with increased reporting of pregnancy-related physical symptoms. Clinicians should consider the possible role of a history of sexual violence when treating women who suffer extensively from pregnancy-related symptoms.
Keywords:Sexual violence, Rape, Pregnancy, Physical complaints
Background
Sexual violence comprises a wide range of sexual violent acts. According to the World Health Organization (WHO) sexual violence includes any sexual act or at-tempt to obtain a sexual act using coercion [1]. Coercion may involve physical force, psychological intimidation and threats [1]. Sexual violence includes rape, tradition-ally defined as vaginal, anal or oral sexual intercourse obtained through force or threat of force [1,2]. However, more recently the recognition has developed that
coercion may not always be present or essential for se-xual violence to occur. Therefore newer definitions of rape and sexual violence have replaced the term coer-cion by lack of consent, thus including sexual violence that occurs through the inability to give consent, for ex-ample due to intoxication [3,4].
The lifetime prevalence of sexual violence among na-tionally representative samples of women in the USA ranges from 18.0% for rape [5,6] to 27.2% for unwanted sexual contact [6]. Population-based studies from Australia, Sweden and Norway report a prevalence ranging from 8.1 to 13.3% [7-10], while WHO in their multi-country study reported a lifetime prevalence ranging from 6.2% in Japan to 58.6% in Ethiopia [11]. Prevalence estimates vary, depending on the population studied, investigation methods used, response rate achieved and how rape was defined [12].
* Correspondence:Mirjam.Lukasse@gmail.com 1
Department of Public Health and General Practice at the Faculty of Medicine, The Norwegian University of Science and Technology (NTNU), Håkon Jarls gate 11, N-7489, Trondheim, Norway
2Department of Health, Nutrition and Management, Faculty of Health Sciences, Oslo and Akershus University College of Applied Sciences, Postboks 364 Alnabru, N-0614, Oslo, Norway
Full list of author information is available at the end of the article
Risk factors for experiencing sexual violence are young age, high-risk behavior including alcohol/substance mis-use, and other violence such as intimate partner or do-mestic violence [5,13,14]. A history of sexual violence has been associated with a wide range of psychological and physical complaints as well as medical diagnoses in-cluding post-traumatic stress disorder, depression, an-xiety disorders, eating disorders, somatization disorders, chronic pain such as headaches, abdominal pain, fibro-myalgia and pelvic pain, gastro-intestinal symptoms and sexually transmitted diseases [8,15-18]. Women who have experienced sexual violence are more likely to re-port poor quality of health compared to women without
a history of abuse [15-18]. Women’s pre-pregnancy
health, health perception and negative health behaviors are likely to continue during pregnancy thus affecting pregnancy and pregnancy outcome [9].
Even though an uncomplicated pregnancy is generally considered to be a state of health rather than disease,
it is frequently accompanied by so called “minor
symptoms” of pregnancy, such as nausea and vomiting,
tiredness, backache, heartburn, constipation, vaginal dis-charge, leg cramps, edema, headache, Braxton Hicks contractions, urinary incontinence, pelvic girdle rela-xation, and urinary tract infections [19-21]. These symp-toms are primarily the result of physiological changes caused by pregnancy and usually have no bearing on the outcome of pregnancy [19,21]. They are subjective and may be difficult to substantiate objectively.
As far as we know only two previous studies have investigated the association between sexual abuse and pregnancy-related physical symptoms [22,23]. In both studies the sexual abuse was limited to abuse during childhood. The aim of our study was to investigate if a history of sexual violence is associated with the number of pregnancy-related symptoms women report. In addition we wanted to explore whether women with a history of sexual violence suffered to a greater extent from the reported symptoms, compared to women with-out such a history.
Material and methods Design and population
The Norwegian Mother and Child Cohort Study (MoBa study) conducted by the Norwegian Institute of Public Health is a nationwide cohort study [24]. This large-scale study was not based on any single or even set of hypotheses, but aimed to estimate the association be-tween a large number of exposures and outcomes [24]. A large group of researchers was involved in the plan-ning of the study and developing the questionnaires. In order to include many possible relevant exposures some validated instruments were included in a shortened and modified version while other questions were specifically
developed for this study. The study collected data from pregnant women using three extensive questionnaires.
From 1999 to 2009 the majority of all pregnant women were invited to participate through a postal invi-tation. Of all the women giving birth in Norway during the inclusion period, approximately 40% participated in the MoBa study, of which 92% completed both question-naires used in our data analysis. This present study is a cross-sectional study using data from the cohort study and included 92 838 pregnancies, comprising women who returned both the first and the third questionnaire
(Q1 at 16–20 and Q3 at 30–34 weeks gestation). We
subsequently excluded 13 475 pregnancies of women who had participated twice or more (i.e. only a woman’s first pregnancy was included) and 703 women who had not responded to any of the questions on sexual abuse in Q1, leaving a total of 78 600 women for analyses. Informed consent was obtained from each participant. The Regional Committee for Medical Research Ethics (Regional Komité for Forskningsetikk Helseregion II, Ref.SAFH95/313RTL) and the Norwegian Data Inspect-orate approved the study. The safety of participants po-tentially involved in ongoing abuse was ensured by the following measures. Recruiting hospitals were able to care for participants and if necessary refer them to other institutions thereby ensuring the safety of participants potentially involved in ongoing abuse. The aim of the MoBa study is, as the invitation to participate explained, to study factors influencing general and obstetric health. The questions on violence and abuse were therefore not expected, either by the participants or their partners. In addition, these questions were not immediately apparent as they were placed at the end of a long questionnaire.
Variables
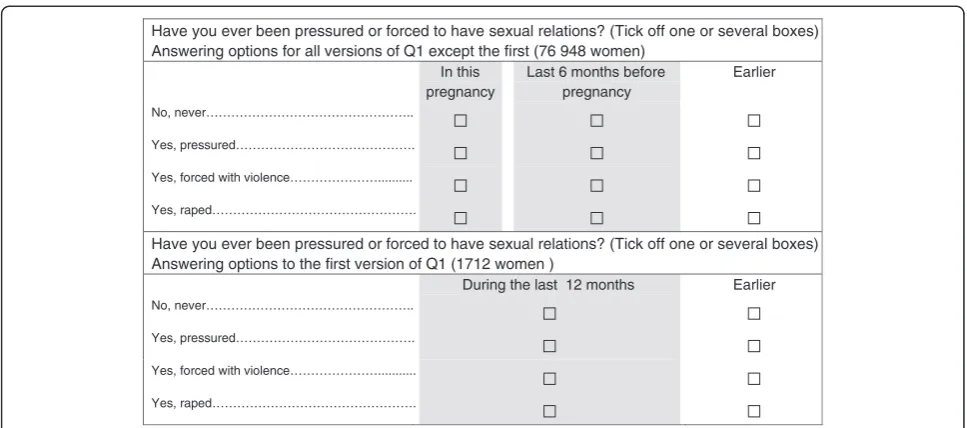
The exposure variable came from Q1, measuring sexual violence at 3 levels of severity. Women were asked if they ever had been pressured or forced into sexual rela-tions. Answering options were: 1) No, never; 2) Yes, pressured (mild); 3) Yes, forced with violence (mode-rate); 4) Yes, raped (severe). A positive answer was defined as having experienced sexual violence. Women with more than one positive answer were classified according to the most severe level reported. For each of the 4 answering options women could indicate when the sexual violence had occurred (Figure 1). The format of this question was changed slightly after version 1 of Q1 (Figure 1). All versions of Q1 had the answering option
“earlier”, which we coded as previously. The answering option “during the last 12 months”, from version 1 of Q1, was coded as recent sexual violence, as were the
options “during this pregnancy” and “during the last
6 months before pregnancy” from all subsequent
The physical complaints were derived from both Q1 and Q3, except for Braxton Hicks contractions and leg cramps, which were only reported in Q3. Women indi-cated if they were “not at all”, “a little bothered” or
“bothered a lot” by Braxton Hicks contractions. For the remaining physical symptoms, women reported how many 4-week periods they were bothered by each symp-tom. The number of 4-week periods women could tick off, varied from 8 for most symptoms (total of 32 weeks
starting from 0–4 weeks of pregnancy) to 5 for leg
cramps (only Q3, started from 13–16 weeks of
pregnancy).
Information on adult physical violence was taken from Q1 and consisted of a positive answer as to whether women as adults had experienced being slapped, hit, kicked or otherwise physically assaulted. This question and the ones on physical violence and emotional abuse from Q3 are modified questions derived from the Norvold Abuse Questionnaire (NorAq) [25].
Child physical violence from Q3 consisted of a positive
answer to the question “Have you experienced physical
violence before the age of 18?”. Emotional abuse either as a child (<18 years) or as an adult (≥18 years), also from Q3, was a positive answer to one or both of two descriptive questions: 1) Have you experienced anybody, systematically and over a long period of time, trying to repress, degrade or humiliate you? 2) Have you expe-rienced anybody threatening to hurt you or someone close to you? In Q3 women were asked if they had been pressured into sexual acts/activities either as a child (<18 years) or as an adult (≥18 years). The sexual vio-lence reported in Q1 could very well, but not necessarily, be that reported in Q3. As the question on sexual vio-lence is more detailed in Q1 and as its wording is less
likely to include non-contact sexual abuse we selected our exposure variable from Q1. To differentiate between these similar variables from Q1 and Q3, the term sexual abuse is used for Q3 and sexual violence for Q1.
The Hopkins Symptom Checklist using 5 items (SCL-5), from Q3, was used to measure mental distress, using a 2.0 cut-off point as suggested by Strand et al. [26]. The SCL-5 had been translated into Norwegian and vali-dated in Norway [27]. Socio-demographic and other characteristics such as age, education, parity, civil sta-tus, occupation, consumption of alcohol or smoking during pregnancy, height and pre-pregnancy weight were derived from Q1. Any report of smoking or alco-hol use during pregnancy was coded as positive for these variables.
Statistical analyses
Frequency analyses were used to quantify the prevalence of the different levels of sexual violence at different time periods. Cross-tabulation and Pearson’s chi-square test were used to study percentages and assess differences in the prevalence of demographic and other characteristics for women reporting sexual violence compared to women not reporting sexual violence.
There were no significant differences for missing data by level of severity of sexual violence. The prevalence of missing data was 2.1% for BMI, 3.7% for education, 0.5% for civil status, and 0.7% for smoking during pregnancy. Missing data for the SCL-5 (3.2%) was replaced by the series mean. Sensitivity analyses comparing the total score of SCL-5 before and after imputation showed no significant differences. The results of the logistic regres-sion analyses remained qualitatively the same when
Have you ever been pressured or forced to have sexual relations? (Tick off one or several boxes) Answering options for all versions of Q1 except the first (76 948 women)
In this pregnancy
Last 6 months before pregnancy
Earlier
No, never………..
Yes, pressured……….
Yes, forced with violence………...
Yes, raped……….
Have you ever been pressured or forced to have sexual relations? (Tick off one or several boxes) Answering options to the first version of Q1 (1712 women )
During the last 12 months Earlier
No, never………..
Yes, pressured……….
Yes, forced with violence………...
Yes, raped……….
performed with complete exclusion of missing data com-pared to using imputed missing data for SCL-5.
In a clinical setting without routine enquiry about a history of violence, women rarely inform their doctor or midwife about such a history [10,28]. However, women
who complain “excessively” of pregnancy-related
phy-sical symptoms may be noticed. We therefore aimed at analyses which would identify those women from the total sample. We did this by defining a cut-off for the number of 4-week periods women were suffering from the different symptoms using the 90th percentile of the distribution for the whole sample. The same procedure was used to define the cut-off for the number of pregnancy-related physical symptoms. This identified women who reported 8 or more symptoms.
The questions enquiring about sexual violence in Q1 and sexual abuse in Q3 are not the same, yet very simi-lar. This explains why among the 9 114 women report-ing childhood and/or adult sexual abuse in Q3, 7 577 (83.1%) also reported any sexual violence in Q1. Testing for collinearity between sexual violence reported in Q1 and sexual abuse reported in Q3 resulted in a Pearson’s correlation coefficient of 0.605, well above the generally accepted cut-off of <0.4 for entering as a covariate in the regression analyses. Due to the overlap and collinearity shown, sexual abuse from Q3 was not entered in the re-gression analyses models.
Binary logistic regression analyses were performed to estimate the crude and adjusted OR and 95% CI for the association between the different levels of severity of sexual violence and the 90thpercentile of the number of 4-week periods of suffering for each pregnancy-related physical symptom. Age was considered the only true confounding factor and controlled for in all the models [29]. The literature shows that co-occurrence of violence is common [17]. In order to estimate the independent association between the sexual violence and the report-ing of pregnancy-related physical symptoms, we adjusted for the other types of violence and abuse reported, as well as age in all adjusted models, provided there were enough cases. Mental distress has been associated with sexual violence and we considered it to be a mediating
factor [17]. In Model 1 we adjusted for age and other
types of violence and abuse. InModel 2 we additionally
adjusted for mental distress to estimate the importance
of this mediating factor. Finally, in Model 3, we added the a priori selected covariates: pre-pregnancy BMI, pa-rity, smoking and alcohol consumption in early
preg-nancy to those included in Model 2. The covariates
added to Model 3 are all well-known factors associated
with a history of abuse and violence [30-34]. They are also known risk factors for several of the
pregnancy-related physical symptoms [35-38].Model 3 investigates
the importance of these factors. The comparison group for all analyses was women not reporting sexual
vio-lence. All analyses were two-sided at α 0.05 and
con-ducted with the statistical program SPSS version 19.0.
Results
Twelve percent (9 444) of the women reported mild sex-ual violence, 2.8% (2 219) moderate and 3.6% (2 805) se-vere (Table 1). Of the 14 468 women who reported sexual violence ever, 94.4 % reported having experienced this only previously, 1.6% only recently and 4% both re-cently and previously.
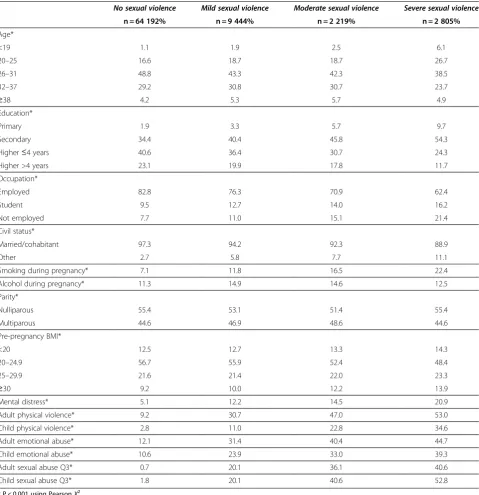
Women reporting a history of sexual violence were significantly younger, more often unemployed and less frequently living with a partner (Table 2). In addition they more frequently reported smoking and alcohol
con-sumption during early pregnancy, a BMI≥30 and mental
distress (Table 2). Women reporting sexual violence were significantly more likely to report other types of violence and abuse, both as a child and as an adult (Table 2). One thousand five hundred and thirty seven (1 537) women reported sexual abuse in Q3 without reporting sexual violence in Q1, of these, 1 134 reported childhood sexual abuse and 429 adult sexual abuse.
All through pregnancy the proportion of women suf-fering from pregnancy-related physical symptoms was significantly higher among women with a history of se-xual violence compared to women without such a
his-tory. Already at 0–4 weeks, 45% of the women with a
history of severe sexual violence reported suffering one or more pregnancy-related physical symptoms, com-pared to 33.3% for women not reporting sexual violence (P > 0.001). At 21–24 weeks and 29–32 weeks, the pro-portion of women reporting suffering one or more symptoms had risen to 80.5% and 79.2% respectively for women reporting a history of sexual violence compared to 71.7% and 72.5% for those without a history of sexual
Table 1 Prevalence of sexual violence in the Norwegian mother and child cohort study, N = 78 660
Level of severity of sexual violence Only recently Only previously Both previously and recent Ever
n (%) n (%) n (%) n (%)
Mild 195 (0.2) 8 837 (11.2) 412 (0.5) 9444 (12.0)
Moderate 15 (0.0) 2200 (2.8) 4 (0.0) 2219 (2.8)
Severe 54 (0.1) 2737 (3.5) 14 (0.0) 2805 (3.6)
violence (P > 0.001). Severe sexual violence was signi-ficantly associated with an increased duration of pregnancy-related symptoms (Table 3). An increasing level of severity of sexual violence was associated with an in-creasing probability of suffering for a longer period of time for the majority of the physical symptoms (Table 3). An increasing level of severity of sexual violence was also associated with an increasing probability of reporting≥8 symptoms (Table 4). Compared to women not reporting
sexual violence, those reporting mild sexual violence were
nearly twice as likely to report ≥8 symptoms, crude OR
1.95 (1.85–2.06), while women reporting severe sexual
violence were three times as likely to report≥8 symptoms, crude OR 3.09 (2.84–3.36) (Table 4). These associations were attenuated, but still significant, when controlling for factors such as age and other types of violence and abuse (Table 4). In a dose–response fashion, the more types of violence and abuse to which women were exposed, the
Table 2 Characteristics of women without and with a mild, moderate or severe history of sexual violence in the mother and child cohort study, N = 78 660 (column %)
No sexual violence Mild sexual violence Moderate sexual violence Severe sexual violence
n = 64 192% n = 9 444% n = 2 219% n = 2 805%
Age*
<19 1.1 1.9 2.5 6.1
20–25 16.6 18.7 18.7 26.7
26–31 48.8 43.3 42.3 38.5
32–37 29.2 30.8 30.7 23.7
≥38 4.2 5.3 5.7 4.9
Education*
Primary 1.9 3.3 5.7 9.7
Secondary 34.4 40.4 45.8 54.3
Higher≤4 years 40.6 36.4 30.7 24.3
Higher >4 years 23.1 19.9 17.8 11.7
Occupation*
Employed 82.8 76.3 70.9 62.4
Student 9.5 12.7 14.0 16.2
Not employed 7.7 11.0 15.1 21.4
Civil status*
Married/cohabitant 97.3 94.2 92.3 88.9
Other 2.7 5.8 7.7 11.1
Smoking during pregnancy* 7.1 11.8 16.5 22.4
Alcohol during pregnancy* 11.3 14.9 14.6 12.5
Parity*
Nulliparous 55.4 53.1 51.4 55.4
Multiparous 44.6 46.9 48.6 44.6
Pre-pregnancy BMI*
<20 12.5 12.7 13.3 14.3
20–24.9 56.7 55.9 52.4 48.4
25–29.9 21.6 21.4 22.0 23.3
≥30 9.2 10.0 12.2 13.9
Mental distress* 5.1 12.2 14.5 20.9
Adult physical violence* 9.2 30.7 47.0 53.0
Child physical violence* 2.8 11.0 22.8 34.6
Adult emotional abuse* 12.1 31.4 40.4 44.7
Child emotional abuse* 10.6 23.9 33.0 39.3
Adult sexual abuse Q3* 0.7 20.1 36.1 40.6
Child sexual abuse Q3* 1.8 20.1 40.6 52.8
* P < 0.001 using PearsonX2
more likely they were to report ≥8 physical symptoms (not in the tables). The unadjusted OR for women with a history of any sexual violence (including all levels of
seve-rity) reporting ≥8 pregnancy-related physical symptoms
was 2.24 (2.15–2.35). For women reporting two types,
such as both any sexual violence and adult physical vio-lence, the crude OR was 2.70 (2.54–2.87), and for any se-xual violence and adult emotional abuse the crude OR was 2.86 (2.68–3.04). For women reporting three types: any sexual violence as well as adult physical violence and adult emotional abuse, the crude OR was 3.18 (2.93–3.44). Having experienced any sexual violence both recently and
previously resulted in a stronger association with≥8
symptoms, crude OR 3.07 (2.57–3.66), than only
pre-viously, crude OR 2.22 (2.12–2.34), and only recently, crude OR 1.73 (1.25–2.40) (not in the tables). A similar pattern was evident for each of the different levels of sever-ity of sexual violence when analyzed separately (Table 5).
Discussion
Eighteen percent of the women in our study reported having experienced any sexual violence. Women with a history of sexual violence suffered from more pregnancy-related physical symptoms, to a greater extent
Table 3 The duration/degree of pregnancy-related symptoms by level of sexual violence, percentages and adjusted† OR, N = 78 660
No. of 4-week period(s) *
No sexual violence n = 64 192
Mild sexual violence n = 9 444
Moderate sexual violence n = 2 219
Severe sexual violence n = 2 805
% % AOR (95% CI) % AOR (95% CI) % AOR (95% CI)
1. Backache ≥5 9.2 13.6 1.29 (1.21–1.38) 15.4 1.32 (1.17–1.49) 18.9 1.48 (1.33–1.65) 2. Tiredness ≥5 13.2 18.1 1.27 (1.20–1.35) 18.8 1.23 (1.10–1.38) 21.8 1.45 (1.31–1.61) 3. Constipation ≥5 9.8 13.5 1.31 (1.22–1.40) 14.7 1.36 (1.20–1.54) 13.0 1.20 (1.06–1.36) 4. Pelvic girdle relaxation ≥4 12.3 16.6 1.23 (1.16–1.31) 18.3 1.25 (1.11–1.40) 21.2 1.40 (1.26–1.55) 5. Heartburn ≥4 11.7 15.2 1.21 (1.14–1.29) 18.1 1.39 (1.24–1.56) 20.1 1.54 (1.39–1.71) 6. Nausea and vomiting ≥3 10.8 12.3 1.26 (1.19–1.34) 14.6 1.27 (1.14–1.43) 17.7 1.66 (1.50–1.83) 7. Edema ≥2 11.6 15.8 1.21 (1.14–1.29) 18.6 1.33 (1.18–1.49) 20.9 1.47 (1.32–1.62) 8. Candidiasis ≥2 12.1 15.1 1.22 (1.14–1.30) 14.9 1.15 (1.02–1.30) 14.1 1.07 (0.95–1.20) 9. Pruritus gravidarum ≥1 13.6 19.0 1.30 (1.23–1.38) 21.1 1.34 (1.20–1.49) 24.1 1.50 (1.36–1.66) 10. Leukorrhea ≥1 7.2 10.7 1.37 (1.27–1.48) 11.6 1.39 (1.21–1.60) 11.1 1.26 (1.11–1.44) 11. Headache ≥2 15.0 20.9 1.27 (1.20–1.34) 23.4 1.33 (1.20–1.48) 26.7 1.48 (1.35–1.62) 12. Urinary Tract Infection ≥1 9.3 11.2 1.09 (1.01–1.17) 13.0 1.18 (1.03–1.35) 13.2 1.11 (0.98–1.25) 13. Urine incontinence ≥1 11.7 17.1 1.33 (1.25–1.41) 17.4 1.22 (1.09–1.37) 19.1 1.35 (1.21–1.50) 14. Leg cramps ≥3 11.1 13.0 1.14 (1.05–1.20) 13.7 1.14 (1.00–1.29) 13.1 1.05 (0.93–1.06) 15. Braxton Hicks contractions bothered a lot ** 12.5 17.0 1.26 (1.19–1.34) 18.3 1.27 (1.14–1.43) 23.0 1.66 (1.50–1.83)
†Adjusted for age, child physical violence, adult physical violence, child emotional abuse and adult emotional abuse. Comparison group is the group of women not reporting sexual violence.* Number of 4-week periods women indicated having suffered from this symptom, maximum possible number of 4-week periods for symptom 1–10 was 8, for symptom 11–3 it was 6 and for symptom14 it was 5. ** Question without 4-week periods option.
Table 4 The Odds Ratios (crude and adjusted) for having≥8 pregnancy-related symptoms, n = 11 532
Type of violence and abuse ≥8 symptoms Crude OR Adjusted OR Model 1 Adjusted OR Model 2 Adjusted OR Model 3 n Crude OR (95% CI) AOR (95% CI) AOR (95% CI) AOR (95% CI)
Sexual violence
Mild 2 057 1.95 (1.85–2.06) 1.49 (1.41–1.58) 1.44 (1.37–1.53) 1.44 (1.36–1.53) Moderate 595 2.57 (2.33–2.83) 1.66 (1.50–1.84) 1.61 (1.46–1.79) 1.60 (1.44–1.78) Severe 859 3.09 (2.84–3.36) 1.78 (1.62–1.95) 1.68 (1.53–1.84) 1.64(1.49–1.81) Adult physical violence 2 806 2.20 (2.10–2.31) 1.35 (1.28–1.43) 1.31 (1.24–1.38) 1.30 (1.22–1.37) Child physical violence 1 255 2.57 (2-39–2.75) 1.31 (1.21–1.42) 1.27 (1.17–1.38) 1.22 (1.13–1.33) Adult emotional abuse 3 200 2.28 (2.17–2.38) 1.74 (1.65–1.83) 1.68 (1.60–1.77) 1.48 (1.40–1.56) Child emotional abuse 2 641 2.12 (2.02–2.23) 1.53 (1.45–1.62) 1.48 (1.40–1.57) 1.70 (1.62–1.80) Comparison group is the group of women not reporting sexual violence.
Model 1: adjusted for age and other types of abuse.
Model 2: adjusted for age, other types of violence and abuse and mental distress.
and for a longer time, compared to women who did not report such a history. Having experienced sexual vio-lence both recently and previously resulted in a stronger association with suffering from≥8 symptoms than sexual violence experienced only previously or only recently.
Our study has several strengths. Firstly, the large sam-ple size gives robust results and allowed considerable ad-justment for confounding and mediating factors. In particular, we were able to assess the independent asso-ciation for sexual violence by controlling for other types of abuse and violence. Secondly, selection bias in rela-tion to the exposure is unlikely as women consenting to participate were not expecting questions on sexual vio-lence. Thirdly, the sample being population-based sug-gests that our results are generalizable for the Norwegian setting and very likely beyond. However, the low response rate causes concern. We lack information on why women did not participate. Participation involved considerable ef-fort and had no immediate benefits for the women taking part. Nilsen et al. [39] compared participants in the MoBa study to all women giving birth in Norway. They found a strong under-representation of the youngest women (<25 years), those living alone, mothers with more than two previous births and smokers [39]. Despite this, no sta-tistically relative differences in association measure were found between participants and the total population regarding the eight association measures they tested [39]. They therefore concluded that even though the preva-lence of both exposure and outcome may be different in the MoBa study compared to the entire pregnant popu-lation in Norway, the estimates of association can still be valid [39].
A major limitation of our study is the lack of use of a validated instrument for measuring sexual violence.
The Norwegian questionnaire uses the term “seksuell
omgang”. The most correct translation for this term in English is “sexual relations”, not“intercourse”as written in the English version of the questionnaire translated for the benefit of researchers (not used by participants). The term “sexual relations” is not precise and can include other acts besides intercourse. However, the term points towards physical contact as opposed to non-contact se-xual abuse. All three answering options suggest that the sexual relations were unwanted. Our results show an in-crease in strength of associations from mild to severe sexual violence, which suggests that the study partici-pants also have interpreted these different levels as in-creasing levels of severity. Our study does not include questions about the timing, frequency or perpetrator of the sexual violence. Information about such factors could shed important light on our findings. For example, we do not know if the prevalence of sexual violence and associations investigated differ significantly for a known compared to unknown perpetrator.
Seventeen percent of the women reporting sexual abuse in Q3 did not report sexual violence in Q1. The majority of these women reported abuse before the age of 18 in Q3. A reasonable explanation for this lack of overlap is that the questions, although similar, are not exactly the same. The questions in Q1 point towards physical-contact sexual violence. The question in Q3 could more easily be interpreted as also including non-contact se-xual abuse. For some of those reporting sese-xual abuse as an adult in Q3 but not in Q1, a possible but unlikely ex-planation could be that the abuse happened after answering Q1.
Another limitation of our study is the lack of know-ledge of the severity of the pregnancy-related physical symptoms, except for the Braxton Hicks contractions.
Table 5 The crude and adjusted OR for having≥8 pregnancy-related symptoms by timing and level of severity of sexual violence
≥8 symptomsn = 11 532 CrudeOR (95% CI) AdjustedOR (95% CI)
Mild sexual violence
Only previously 1902 1.92 (1.82–2.03) 1.45 (1.37–1.54)*
Only recently 39 1.75 (1.23–2.49) 1.71 (1.20–2.43)**
Both previously and recently 116 2.74 (2.21–3.41) 2.04 (1.63–2.55)*
Moderate sexual violence
Only previously 591 2.57 (2.33–2.83) 1.58 (1.42–1.76)*
Only recently 2 1.08 (0.24–4.77) Too few to adjust
Both previously and recently 2 7.00 (0.99–49.72) Too few to adjust
Severe sexual violence
Only previously 844 3.12 (2.87–3.40) 1.68 (1.53–1.86)*
Only recently 8 1.22 (0.57–2.58) 1. 18 (0.56–2.50)**
Both previously and recently 7 7.00 (2.46–19.97) 6.70 (2.34–19.14)**
Women were asked if and when they suffered from the pregnancy-related physical symptoms, but not how much. However, even if the women had been asked how badly they suffered from these physical symptoms, the measurement would have remained subjective. Most of the pregnancy-related symptoms are rarely substantiated objectively, as they generally cause no concern regarding the outcome of the pregnancy (e.g. heartburn, constipa-tion, leg cramps, backache), while some symptoms may lead to further investigation to rule out pathology (e.g. edema, pruritis gravidarum, headache, leukorrhea).
Our study, like most others investigating the impact of sexual violence, relies on retrospective self-reporting with the risk of recall bias [40]. Self-reporting begins with the individual perceiving and storing the experience as a memory of sexual violence. Next the study ques-tions have to trigger the participant recall of the event. Studies have shown that the methodology used, i.e. the number of questions asked, the phrasing and the context in which the questions appear, influence the rates of self-reported sexual violence [41,42]. Lastly women have to be willing to disclose their experience [40,41]. Women in our study were sent the questionnaires by post, and if the perpetrator of the unwanted sexual rela-tions was their present partner, fear of retribution result-ing from the partner readresult-ing their responses may well have stopped disclosure. This could also be one of the reasons why the prevalence of recent sexual violence was so low compared to previously experienced sexual violence. However, our prevalence of recent sexual vio-lence of 0.8% (0.3% only recent and 0.5% both previously and recent) is very similar to that of 1% reported in the first national population based study of violence among Norwegian women [7].
Our lifetime prevalence of ever having experienced sexual violence (18%) is exactly the same as the preva-lence reported in the general population (not college students) from a nationwide study in the USA by Kilpa-trick et al. [5]. It is difficult to compare our estimates of prevalence of sexual violence with other Norwegian studies due to methodological differences [7,43,44]. A Nordic study on the prevalence of different types of
abuse among patients visiting gynecology clinics
reported 6.4% prevalence for women ≥18 for severe
se-xual abuse which compares well to our study when we combine the prevalence for moderate and severe sexual violence [10].
A history of sexual violence was associated with the reporting of other types of violence and abuse, particu-larly during adulthood. The co-occurrence increased with the increasing level of severity of sexual violence (Table 2). This pattern suggests that sexual violence in our study was part of intimate partner violence or do-mestic violence. This finding agrees with other research
reporting that in the majority of sexual violence cases, the perpetrator is known to the victim. The most com-mon perpetrator of sexual violence occurring in child-hood is the father, stepfather or another relative. For adult sexual violence, it is a partner or former partner [5,9]. Co-occurrence of multiple forms of violence and adult re-victimization as suggested in this study are well documented findings [7,16,45,46].
No other studies have investigated the association be-tween a history of any lifetime sexual violence and pregnancy-related physical symptoms. However, other studies have noted the association between sexual vio-lence and a range of somatic health problems in pre-dominantly non-pregnant women [7,15-18,44,45]. Two studies among pregnant women showed a significant as-sociation between childhood sexual abuse and physical symptoms and complaints [22,23]. A Swedish study of a general population of pregnant women with the primary purpose to determine the prevalence of lifetime sexual abuse, reported that such a history was associated with increased reporting of general health problems [9]. They focused on diagnoses and diseases with little attention to symptoms reported by women.
childbirth has been associated with a history of sexual abuse [55-57]. In our study we noticed that the associa-tions changed noticeably when mental distress was entered in the model. Our study, which is based on data from a cohort study, has a cross-sectional design and can therefore not show a causal link between the expe-rience of sexual violence and pregnancy-related physical symptoms. However, in most cases the sexual violence occurred before the pregnancy. This fact and the increased strength of the association with increased se-verity offer support to a causal association [29].
Conclusions
We found that women who reported sexual violence suf-fered longer and from more pregnancy-related physical symptoms compared to women not reporting sexual vio-lence. The symptoms may seem like minor complaints to those who provide health care during pregnancy. However, they may cause women major discomfort and severely affect their well-being during pregnancy. Few women spontaneously disclose their history of violence to health professionals [10,28]. Clinicians should con-sider the possible role of a history of sexual violence or other abuse when treating women who suffer to a great extent from pregnancy-related physical symptoms.
Abbreviations
Q1, Questionnaire 1; Q3, Questionnaire 3; AOR, Adjusted Odds Ratio; OR, Odds Ratio; CI, Confidence Interval; NorAq, Norvold Abuse questionnaire; BMI, Body Mass Index; SCL-5, Symptom Check List with 5 items;
MoBa, Norwegian Mother and Child Cohort Study; MBRN, Medical Birth Registry of Norway.
Competing interests
There are no competing interests.
Authors’contributions
ML conceived the study, performed the analyses, drafted and corrected the manuscript. LH participated in the statistical analyses and drafting of the manuscript. SV participated in the conception of the study, advised on the statistical analyses and participated in the drafting of the manuscript. BS participated in the conception and design of the study, advised on the statistical analyses and drafted the manuscript. All authors read and approved the final manuscript.
Acknowledgements
The Norwegian Mother and Child Cohort Study was supported by the Norwegian Ministry of Health, Oslo, NIH/NIEHS (grant no N01-ES-75558), NIH/ NINDS (grant no.1 UO1 NS 047537–01), and the Norwegian Research Council/FUGE, Oslo (grant no. 151918/S10). The first author is supported by The Research Council of Norway (grant no. 204292/H10). The second author is supported by the South-Eastern Norway Regional Health Authority (grant no.2012010).
Author details 1
Department of Public Health and General Practice at the Faculty of Medicine, The Norwegian University of Science and Technology (NTNU), Håkon Jarls gate 11, N-7489, Trondheim, Norway.2Department of Health, Nutrition and Management, Faculty of Health Sciences, Oslo and Akershus University College of Applied Sciences, Postboks 364 Alnabru, N-0614, Oslo, Norway.3Section of Obstetrics at the Division of Obstetrics and Gynecology, Oslo University Hospital, Postboks 4950 Nydalen, N-0424, Oslo, Norway. 4National Resource Centre for Women’s Health at the Division of Obstetrics
and Gynecology, Oslo University Hospital, Postboks 4950 Nydalen, N-0424, Oslo, Norway.5Department of Gynecology at the Women’s Clinic, St. Olavs Hospital,Trondheim University Hospital, Postbox 3250 Sluppen, N-7006, Trondheim, Norway.
Received: 15 February 2012 Accepted: 6 August 2012 Published: 11 August 2012
References
1. Krug EG, Dahlberg LL, Mercy JA, Zwi AB, Lozano R:World Report on Violence and Health. Geneva: World Health Organization; 2002.
2. Koss MP, Gidycz CA, Wisniewski N:The scope of rape: incidence and prevalence of sexual aggression and victimization in a national sample of higher education students.J Consult Clin Psychol1987,55:162–170. 3. Zinzow HM, Resnick HS, Amstadter AB, McCauley JL, Ruggiero KJ,
Kilpatrick DG:Drug- or alcohol-facilitated, incapacitated, and forcible rape in relationship to mental health among a national sample of women.J Interpers Violence2010,25:2217–2236.
4. U.S.Department of Justice:Attorny General Eric Holder Announces Revisions to the Uniform Crime Report's Definition of Rape; http://www.fbi.gov/news/ pressrel/press-releases/attorney-general-eric-holder-announces-revisions-to-the-uniform-crime-reports-definition-of-rape
5. Kilpatrick DG, Resnick HS, Ruggiero KJ, Conoscenti LM, McCauley J: Drug-facilitated, incapacitated, and forcible rape: a national study. Charleston, USA: National Crime Victims Research Center; 2007.
6. Black MC, Basile KC, Breiding MJ, Smith SG, Walters ML, Merrick MT,et al:
The National Intimate Partner and Sexual Violence Survey: 2010 Summary Report. Prevention and Control: National Center for Injury; 2011. 7. Neroien AI, Schei B:Partner violence and health: results from the first
national study on violence against women in Norway.Scand J Public Health2008,36:161–168.
8. Rees S, Silove D, Chey T, Ivancic L, Steel Z, Creamer M,et al:Lifetime prevalence of gender-based violence in women and the relationship with mental disorders and psychosocial function.JAMA2011, 306:513–521.
9. Stenson K, Heimer G, Lundh C, Nordstrom ML, Saarinen H, Wenker A: Lifetime prevalence of sexual abuse in a Swedish pregnant population.
Acta Obstet Gynecol Scand2003,82:529–536.
10. Wijma B, Schei B, Swahnberg K, Hilden M, Offerdal K, Pikarinen U,et al: Emotional, physical, and sexual abuse in patients visiting gynaecology clinics: a Nordic cross-sectional study.Lancet2003, 361:2107–2113.
11. Garcia-Moreno C, Jansen HA, Ellsberg M, Heise L, Watts CH:WHO Multi-country Study on Women's Health and Domestic Violence against Women Study Team: Prevalence of intimate partner violence: findings from the WHO multi-country study on women's health and domestic violence.Lancet2006,368:1260–1269.
12. Krebs CP, Lindquist CH, Warner TD, Fisher BS, Martin SL, Childers JM: Comparing sexual assault prevalence estimates obtained with direct and indirect questioning techniques.Violence Against Women2011, 17:219–235.
13. Avegno J, Mills TJ, Mills LD:Sexual assault victims in the emergency department: analysis by demographic and event characteristics.J Emerg Med2009,37:328–334.
14. Tjaden P, Thoennes N:Extent, Nature, and Consequences of Rape Victimization: Findings From the National Violence Against Women Survey: National Institute of Justice and the Centres for Disease Control and Prevention; 2000.
15. Zinzow HM, Amstadter AB, McCauley JL, Ruggiero KJ, Resnick HS, Kilpatrick DG: Self-rated health in relation to rape and mental health disorders in a national sample of college women.J Am Coll Health2011,59:588–594. 16. Bonomi AE, Anderson ML, Rivara FP, Thompson RS:Health outcomes in
women with physical and sexual intimate partner violence exposure.
J Womens Health2007,16:987–997.
18. Pikarinen U, Saisto T, Schei B, Swahnberg K, Halmesmaki E:Experiences of physical and sexual abuse and their implications for current health.
Obstet Gynecol2007,109:1116–1122.
19. Enkin M, Keirse MJNC, Neilson J, Crowther C, Duley L, Hodnett E,et al: Unpleasant symptoms in pregnancy. InA Guide to effective care in pregnancy and childbirth. 3rd edition. Edited by Enkin M, Keirse MJNC, Neilson J, Crowther C, Duley L, Hodnett E,et al. Oxford: Oxford University Press; 2000:95–107.
20. Draper L:Pregnant women in the workplace: distinguishing between normal and abnormal physiologic changes.AAOHN J 6 A.D2006, 54:217–223.
21. Freeman WS:Common complaints in pregnancy.Med Times1980, 108:7–13.
22. Grimstad H, Schei B:Pregnancy and delivery for women with a history of child sexual abuse.Child Abuse Negl1999,23:81–90.
23. Lukasse M, Schei B, Vangen S,ian P:Childhood Abuse and Common Complaints in Pregnancy.Birth2009,36:190–199.
24. Magnus P, Irgens LM, Haug K, Nystad W, Skjaerven R, Stoltenberg C,et al: Cohort profile: the Norwegian Mother and Child Cohort Study (MoBa).
Int J Epidemiol2006,35:1146–1150.
25. Swahnberg IMK, Wijma B:The NorVold Abuse Questionnaire (NorAQ): validation of new measures of emotional, physical, and sexual abuse, and abuse in the health care system among women.Eur J Public Health
2003,13:361–366.
26. Strand BH, Dalgard OS, Tambs K, Rognerud M:Measuring the mental health status of the Norwegian population: a comparison of the instruments SCL-25, SCL-10, SCL-5 and MHI-5 (SF-36).Nord J Psychiatry
2003,57:113–118.
27. Tambs K, Moum T:How well can a few questionnaire items indicate anxiety and depression?Acta Psychiatr Scand1993,87:364–367. 28. Trautman DE, McCarthy ML, Miller N, Campbell JC, Kelen GD:Intimate
partner violence and emergency department screening: computerized screening versus usual care.Ann Emerg Med2007,49:526–534. 29. Rothman KJ:Epidemiology: an introduction. Oxford: Oxford University Press;
2002.
30. Hillis SD, Anda RF, Dube SR, Felitti VJ, Marchbanks PA, Marks JS:The association between adverse childhood experiences and adolescent pregnancy, long-term psychosocial consequences, and fetal death.
Pediatrics2004,113:320–327.
31. Roche M, Moracco KE, Dixon KS, Stern EA, Bowling JM:Correlates of intimate partner violence among female patients at a North Carolina emergency department.N C Med J2007,68:89–94.
32. Flynn HA, Walton MA, Chermack ST, Cunningham RM, Marcus SM:Brief detection and co-occurrence of violence, depression and alcohol risk in prenatal care settings.Arch Womens Ment Health2007,10:155–161. 33. Noll JG, Zeller MH, Trickett PK, Putnam FW:Obesity risk for female
victims of childhood sexual abuse: a prospective study.Pediatrics2007, 120:e61–e67.
34. Nayak MB, Lown EA, Bond JC, Greenfield TK:Lifetime victimization and past year alcohol use in a U.S. population sample of men and women drinkers.Drug Alcohol Depend2012,123:213–219.
35. Liang CC, Chang SD, Lin SJ, Lin YJ:Lower urinary tract symptoms in primiparous women before and during pregnancy.Arch Gynecol Obstet
2012,285:1205–1210.
36. Foxcroft KF, Rowlands IJ, Byrne NM, McIntyre HD, Callaway LK:Exercise in obese pregnant women: the role of social factors, lifestyle and pregnancy symptoms.BMC Pregnancy Childbirth2011,11:4. 37. Habr F, Raker C, Lin CL, Zouein E, Bourjeily G:Predictors of
gastroesophageal reflux symptoms in pregnant women screened for sleep disordered breathing: A secondary analysis.Clin Res Hepatol Gastroenterol2012, 7 May, Epub ahead of publication.
38. Meyer LC, Peacock JL, Bland JM, Anderson HR:Symptoms and health problems in pregnancy: their association with social factors, smoking, alcohol, caffeine and attitude to pregnancy.Paediatr Perinat Epidemiol
1994,8:145–155.
39. Nilsen RM, Vollset SE, Gjessing HK, Skjaerven R, Melve KK, Schreuder P,et al: Self-selection and bias in a large prospective pregnancy cohort in Norway.Paediatr Perinat Epidemiol2009,23:597–608.
40. Cook SL, Gidycz CA, Koss MP, Murphy M:Emerging issues in the measurement of rape victimization.Violence Against Women2011, 17:201–218.
41. Testa M, Livingston JA, VanZile-Tamsen C:The impact of questionnaire administration mode on response rate and reporting of consensual and nonconsensual sexual behavior.Psychol Women Q2005,29:345–352. 42. Abbey A, Parkhill MR, Koss MP:The effect of frame of reference on
responses to questions about sexual assault victimization and perpetration.Psychol Women Q2005,29:364–373.
43. Mossige S, Stefansen K (Eds):Vold og overgrep mot barn og unge. velferd og aldring: Norsk institutt for forskning om oppvekst; 2007:20.
44. Dahle T, Aalvik Dalen H, Meland E, Breidablik HJ:Uønskede seksuell erfaringer og helseplager blant ungdom.Tidsskrift for Den norske legeforening2010,130:1912–1916.
45. Campbell J, Jones AS, Dienemann J, Kub J, Schollenberger J, O'Campo P,
et al:Intimate partner violence and physical health consequences.Arch Intern Med2002,162:1157–1163.
46. Classen CC, Palesh OG, Aggarwal R:Sexual revictimization: a review of the empirical literature.Trauma Violence Abuse2005,6:103–129.
47. Kendall-Tackett KA:Inflammation, cardiovascular disease, and metabolic syndrome as sequelae of violence against women: the role of depression, hostility, and sleep disturbance.Trauma Violence Abuse2007, 8:117–126.
48. Rodgers CS, Lang AJ, Twamley EW, Stein MB:Sexual trauma and pregnancy: a conceptual framework.J Womens Health (Larchmt)2003, 12:961–970.
49. Seng JS:A conceptual framework for research on lifetime violence, posttraumatic stress, and childbearing.J Midwifery Womens Health2002, 7:337–346.
50. Ursin H, Eriksen H:Cognitive activation theory of stress, sensitization, and common health complaints.Ann N Y Acad Sci2007,1113:304–310. 51. Kendall-Tackett K, Klest B:Causal mechanisms and multidirectional
pathways between trauma, dissociation, and health.J Trauma Dissociation2009,10:129–134.
52. Samelius L, Wijma B, Wingren G, Wijma K:Somatization in abused women.
J Womens Health2007,16:909–918.
53. Cromer KR, Sachs-Ericsson N:The association between childhood abuse, PTSD, and the occurrence of adult health problems: Moderation via current life stress.J Trauma Stress2006,19:967–971.
54. Thakkar RR, McCanne TR:The effects of daily stressors on physical health in women with and without a childhood history of sexual abuse.
Child Abuse Negl2000,24:209–221.
55. Lukasse M, Vangen S,ian P, Schei B:Fear of childbirth, women's preference for cesarean section and childhood abuse - a longitudenal study.Acta Obstet Gynecol Scand2010,90:33–40.
56. Lukasse M, Vangen S, Qian P, Kumle M, Ryding EL, Schei B:Childhood Abuse and Fear of Childbirth - A Population-Based Study.Birth2010, 37:267–274.
57. Nerum H, Halvorsen L, Sorlie T, Oian P:Maternal request for cesarean section due to fear of birth: Can it be changed through crisis-oriented counseling?Birth2006,33:221–228.
doi:10.1186/1471-2393-12-83
Cite this article as:Lukasseet al.:Sexual violence and pregnancy-related physical symptoms.BMC Pregnancy and Childbirth201212:83.
Submit your next manuscript to BioMed Central and take full advantage of:
• Convenient online submission
• Thorough peer review
• No space constraints or color figure charges
• Immediate publication on acceptance
• Inclusion in PubMed, CAS, Scopus and Google Scholar
• Research which is freely available for redistribution