Open Access
Proceedings
Association mapping via a class of haplotype-sharing statistics
Andrew S Allen*
1,2and Glen A Satten
3Address: 1Department of Biostatistics and Bioinformatics, Duke University, Hock Plaza, Suite 1102, 2424 Erwin Road, Durham, North Carolina
27705, USA, 2Duke Clinical Research Institute, Duke University, North Pavilion, 2400 Pratt Street, Durham, North Carolina 27705, USA and 3Centers for Disease Control and Prevention, Mailstop K-23, 4770 Buford Highway, Atlanta, Georgia 30345, USA
Email: Andrew S Allen* - [email protected]; Glen A Satten - [email protected] * Corresponding author
Abstract
We present a class of haplotype-sharing statistics useful for association mapping in case-parent trio data. The framework presented allows derivation of novel tests as well as new simplified variance estimators for previously proposed tests. We give an overview of this framework and apply four such tests to the simulated data of Genetic Analysis Workshop 15. We find that these haplotype-based statistics result in greater power and better risk locus localization than the single locus single-nucleotide polymorphism analysis.
Background
Haplotype-sharing methods attempt to utilize insights from population genetics while maintaining the simpli-fied statistical model used for association studies in genetic epidemiology. Coalescent models suggest that for some diseases, chromosomes of affected persons share a more recent common ancestor than a randomly selected pair of chromosomes. If a disease-causing mutation is rel-atively recent, haplotypes of affected persons may be iden-tical by state (IBS) over a longer region near a risk locus than would be found among randomly selected haplo-types. Thus, haplotype sharing attempts association map-ping by looking for regions where the patterns of similarity in IBS among haplotypes of affected persons differs from that found in random haplotypes.
In a recent paper, we derived the distribution of some pre-viously proposed and novel haplotype-sharing tests [1].
Here, we give an overview of these results and apply them to the Genetic Analysis Workshop 15 (GAW15) Problem 3 data.
Methods
For the ith of ncase-parent trios, let H
1i and H2i be the pater-nal transmitted and untransmitted haplotypes, while H3i and H4i denote the maternal transmitted and untransmit-ted haplotypes. Assume haplotypes having L loci, so that there are 2L possible haplotypes. Let S
k(H1, H2) measure the similarity between haplotypes H1 and H2 at a fixed locus k. Many similarity metrics are possible; here we measure similarity by the maximum information length contrast, the number of loci H1 and H2 share IBS looking upstream and downstream from a fixed locus k. Let Sk be
the matrix having (i, j)th element S
k(Hi, Hj). Let , , and from Genetic Analysis Workshop 15
St. Pete Beach, Florida, USA. 11–15 November 2006 Published: 18 December 2007
BMC Proceedings 2007, 1(Suppl 1):S123
<supplement> <title> <p>Genetic Analysis Workshop 15: Gene Expression Analysis and Approaches to Detecting Multiple Functional Loci</p> </title> <editor>Heather J Cordell, Mariza de Andrade, Marie-Claude Babron, Christopher W Bartlett, Joseph Beyene, Heike Bickeböller, Robert Culverhouse, Adrienne Cupples, E Warwick Daw, Josée Dupuis, Catherine T Falk, Saurabh Ghosh, Katrina A Goddard, Ellen L Goode, Elizabeth R Hauser, Lisa J Martin, Maria Martinez, Kari E North, Nancy L Saccone, Silke Schmidt, William Tapper, Duncan Thomas, David Tritchler, Veronica J Vieland, Ellen M Wijsman, Marsha A Wilcox, John S Witte, Qiong Yang, Andreas Ziegler, Laura Almasy and Jean W MacCluer</editor> <note>Proceedings</note> <url>http://www.biomedcentral.com/content/pdf/1753-6561-1-S1-info.pdf</url> </supplement>
This article is available from: http://www.biomedcentral.com/1753-6561/1/S1/S123 © 2007 Allen and Satten; licensee BioMed Central Ltd.
This is an open access article distributed under the terms of the Creative Commons Attribution License (http://creativecommons.org/licenses/by/2.0), which permits unrestricted use, distribution, and reproduction in any medium, provided the original work is properly cited.
ˆ
denote vectors of haplotype frequency estimators for untransmitted, transmitted, and all haplotypes respec-tively, obtained under phase uncertainty.
We consider statistics of the form
It is possible to show that taking γ= yields the
numer-ator of the haplotype-sharing statistics considered by each of van der Meulen and te Meerman [2], Bourgain et al. [3], Tzeng et al. [4], and Zhang et al. [5], though these statistics differ in the computation of their variances. Writing these "standard" haplotype sharing tests in the form Eq. (1) allows us to interpret them as looking for differences between vectors and that are in the direction of
TS
k, i.e., in the direction of sharing with the parental haplotypes. The form of Uk(γ) also allows us to derive a simple formula for its variance. We make explicit the fact that γis often a function of the data by writing . Using
Slutsky's theorem [6, Section 1.5.4], as long as
under the null hypothesis, Var{Uk( )} can be estimated
by , where is the empirical variance
estima-tor of ( - ). This variance estimator is considerably
simpler than those previously proposed, and is valid even with phase uncertainty and for stratified populations [1].
Use of γ = yields the statistic
, which we refer to as the p
test. Another choice, γ= , was used by Levinson et al. [7], who contrasted sharing in transmitted haplotypes,
, with the cross product to give
. We call this the rho
test.
An appealing choice of γ is ( - ), as this direction weights differences in haplotypes by their differences in frequency (Gerard te Meerman, personal communica-tion). However, Slutsky's theorem no longer applies as
under the null hypothesis. Instead, we use
the fact that is a
quad-ratic form whose distribution is a mixture of independent
χ2 variates, with weights given by the eigenvalues of the matrix Sk. Following Imhof [8], we approximate this
weighted χ2 distribution using a three-moment approxi-mation. We refer to the resulting test as the cross test.
Finally, we note that because the p test uses
, while the cross test uses γ= ( - ),
the two tests appear to be looking at sharing in orthogonal directions; hence, a combined test seems desirable. Thus, we seek the distribution of
.
Once again, this is a quadratic form whose distribution is a mixture of independent χ2 variates, with weights given
by the eigenvalues of the matrix , and
we approximate this distribution as in Imhof [8].
Application to GAW15 data
three loci to investigate the effect of increasing distance from the true disease locus on the performance of each test.
Results and discussion
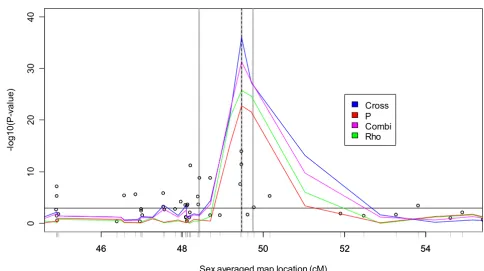
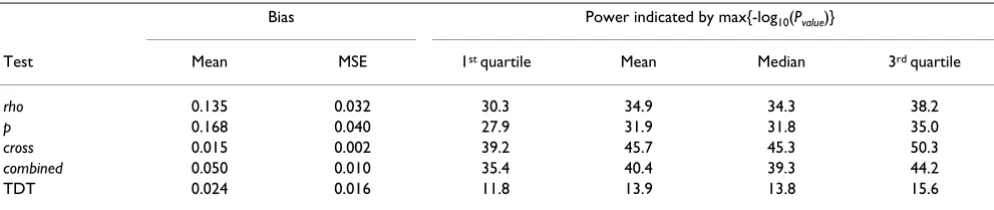
Figure 1 presents the results of the rho, p, cross, combined, and TDT tests in the 10-cM region of the chromosome 6 risk locus for Replicate 1. Three things are apparent from this analysis. First, the haplotype-based methods seem to be more powerful than the TDT, yielding much larger -log10(Pvalue) values. Second, the haplotype-based methods seem to localize the risk locus well. Finally, the haplotype-based methods seem to be more concentrated around the risk locus, being both larger at the locus and dropping more quickly away from the risk locus than the TDT. Vis-ual inspection of other data replicates suggests the same pattern; to confirm, we investigated each of the above points systematically. First, in order to summarize the power of the various tests we report the first quartile, median, mean, and third quartile of the max{-log10(Pvalue)}of each test over the 100 replicates (Table 1). We see that the haplotype-based methods are consistently higher and that the cross test performs best among all tests. Next, we report the localization bias and MSE of the TDT and each of the haplotype sharing tests (Table 1). Here,
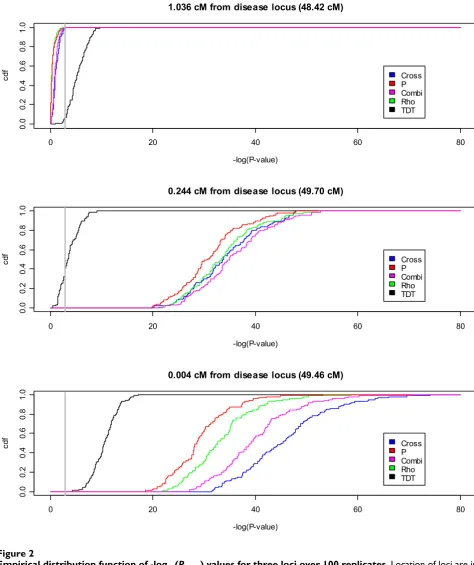
once again, the cross test appears to do better than the oth-ers, though we note that the small biases involved make it difficult to make conclusions. Finally, Figure 2 presents the empirical distribution functions of -log10(Pvalue) values for each test statistic at three different loci. Our findings are consistent with the observations in Replicate 1: the haplotype-based methods have larger -log10(Pvalue) values at the risk locus and drop off more quickly away from the risk locus than the TDT throughout the replications. In particular, at 1.036 cM from the disease locus, essentially all replicates have a non-significant test statistic (i.e., val-ues that fall to the left of the gray vertical line in Figure 2) for all of the haplotype sharing tests while most replicates have a significant TDT. By 0.244 cM the situation has changed, and all replicates have significant haplotype-sharing tests while about 40% of replicates have a non-sig-nificant TDT. At 0.004 cM from the disease locus, all tests are significant, but the superiority of the cross statistic for these data is more readily apparent.
Conclusion
We presented an overview of a new framework for deriv-ing haplotype-sharderiv-ing statistics and applied four such sta-tistics to the GAW15 simulated data. Our findings suggest that these haplotype-based statistics can result in greater
Analysis of Replicate 1 in a 10-cM region containing risk locus
Figure 1
Analysis of Replicate 1 in a 10-cM region containing risk locus. Risk locus indicated by dotted vertical line. TDT results indicated by circles. SNP locations indicated by gray tick marks. Gray vertical lines represent loci further investigated in Figure 2. Horizontal black line indicates Bonferroni-corrected 0.05 significance level.
01
0
2
0
3
0
4
0
46 48 50 52 54
Sex averaged map location (cM)
-l
og1
0(
P
-v
a
lu
e)
Cross P Combi Rho
Empirical distribution function of -log10(Pvalue) values for three loci over 100 replicates
Figure 2
Empirical distribution function of -log10(Pvalue) values for three loci over 100 replicates. Location of loci are indi-cated by gray vertical lines in Figure 1 and are shown in order of decreasing distance from the true disease locus. Gray vertical line indicates Bonferroni-corrected 0.05 significance level.
0 20 40 60 80
0.
0
0
.2
0.
4
0
.6
0
.8
1
.0
1.036 cM from disease locus (48.42 cM)
-log(P-value)
cd
f
Cross P Combi Rho TDT
0 20 40 60 80
0
.0
0
.2
0.
4
0
.6
0.
8
1
.0
0.244 cM from disease locus (49.70 cM)
-log(P-value)
cd
f
Cross P Combi Rho TDT
0 20 40 60 80
0
.00
.20
.40
.6
0
.81
.0
0.004 cM from disease locus (49.46 cM)
-log(P-value)
cd
f
Publish with BioMed Central and every scientist can read your work free of charge
"BioMed Central will be the most significant development for disseminating the results of biomedical researc h in our lifetime."
Sir Paul Nurse, Cancer Research UK
Your research papers will be:
available free of charge to the entire biomedical community
peer reviewed and published immediately upon acceptance
cited in PubMed and archived on PubMed Central
yours — you keep the copyright
Submit your manuscript here:
http://www.biomedcentral.com/info/publishing_adv.asp
BioMedcentral
power and better risk locus localization compared to the single-SNP (TDT) analysis. The framework presented allows visualization of relationships between tests and computation of simplified estimators of the asymptotic distribution of the test statistics. This second feature is quite important because previous estimators have been complex or have depended on permutation procedures, making systematic power studies difficult or impossible.
Competing interests
The author(s) declare that they have no competing inter-ests.
Acknowledgements
ASA acknowledges support from National Heart Lung and Blood Institute, National Institutes of Health grant K25 HL077663.
This article has been published as part of BMC Proceedings Volume 1 Sup-plement 1, 2007: Genetic Analysis Workshop 15: Gene Expression Analysis and Approaches to Detecting Multiple Functional Loci. The full contents of the supplement are available online at http://www.biomedcentral.com/ 1753-6561/1?issue=S1.
References
1. Allen AS, Satten GA: Statistical models for haplotype sharing in
case-parent trio data. Hum Hered 2007, 64:35-44.
2. Van der Meulen M, te Meerman G: Haplotype sharing analysis in affected individuals from nuclear families with at least one
affected offspring. Genet Epidemiol 1997, 14:915-919.
3. Bourgain C, Genin E, Quesneville H, Clerget-Darpoux F: Search for multifactorial disease susceptibility genes in founder
popula-tions. Ann Hum Genet 2000, 64:255-265.
4. Tzeng J, Devlin B, Wasserman L, Roeder K: On the identification of disease mutations by the analysis of haplotype similarity
and goodness of fit. Am J Hum Genet 2003, 72:891-902.
5. Zhang S, Sha Q, Chen H, Dong J, Jiang R: Transmission/disequilib-rium test based on haplotype sharing for tightly linked mark-ers. Am J Hum Genet 2003, 73:566-579.
6. Serfling R: Approximation Theorems of Mathematical StatisticsNew York: John Wiley & Sons; 1980.
7. Levinson D, Kirby A, Slepner S, Nolte I, Spijker G, te Meerman G: Simulation studies of detection of a complex disease in a
par-tially isolated population. Am J Med Genet (Neuropsych Genet)
2001, 105:65-70.
8. Imhof J: Computing the distribution of quadratic forms in
nor-mal variables. Biometrika 1961, 48:419-426.
9. Zhang K, Sun F, Zhao H: HAPLORE: a program for haplotype reconstruction in general pedigrees without recombination.
Bioinformatics 2005, 21:90-103.
Table 1: Bias and power summaries of 100 data replicates
Bias Power indicated by max{-log10(Pvalue)}
Test Mean MSE 1st quartile Mean Median 3rd quartile
rho 0.135 0.032 30.3 34.9 34.3 38.2
p 0.168 0.040 27.9 31.9 31.8 35.0
cross 0.015 0.002 39.2 45.7 45.3 50.3
combined 0.050 0.010 35.4 40.4 39.3 44.2