P R O C E E D I N G S
Open Access
Identifying rare and common variants with
Bayesian variable selection
Cheongeun Oh
FromGenetic Analysis Workshop 19 Vienna, Austria. 24-26 August 2014
Abstract
Background:Recent advances in next-generation sequencing technologies have made it possible to generate large amounts of sequence data with rare variants in a cost-effective way. Yet, the statistical aspect of testing disease association of rare variants is quite challenging as the typical assumptions fail to hold owing to low minor allele frequency (<0.5 or 1 %).
Methods:I present a Bayesian variable selection approach to detect associations with both rare and common genetic variants for quantitative traits simultaneously. In my model, I frame the problem of identifying disease-associated variants as a problem of variable selection in a sparse space, that is, how best to model the relationship between phenotypes and a set of genetic variants. By constructing a risk index score for a group of rare variants, my method can effectively consider all variants in a multivariate model. I also use a within-chain permutation to generate the empirical thresholds to detect true-positive variants.
Results:I apply our method to study the association between increases in baseline systolic and diastolic blood pressure (SBP and DBP, respectively) and genetic variants in the data from Genetic Analysis Workshop 19 unrelated samples. I identify several rare and common variants in the geneMAP4that are potentially associated with SBP and DBP.
Conclusions:The application shows that my method is powerful in identifying disease-associated variants even with the extreme rarity.
Background
With the advent of next-generation sequencing, rare var-iants with a minor allele frequency (MAF) of less than 1 to approximately 5 % are getting more attention in genome-wide association studies (GWAS) to account for the “missing” heritability phenomenon [1]. Despite the importance, testing for associations between rare vari-ants and disease traits has proven challenging because evaluating the potential impact of rare variants on dis-ease is complicated by their uncommon nature of the extreme rarity. Over the last few years, numerous methods have been developed to address methodological challenges in rare-variant association analysis. Notice-ably, multimarker approaches have drawn much atten-tion. Commonly used methods include the collapsing,
simple-sum, and weighted-sum methods [2–5]. They first collapse rare variants and then implement a LASSO (least absolute shrinkage and selection operator) [6–8], partial least squares regression (PLS) model [9], or other supporting statistical methods using the common vari-ants and the collapsed rare varivari-ants [10].
Although they offer a new way of looking at rare vari-ants, simply pooling these variants may cancel the true signal and, consequently, discard the possibility that multiple rare variants affect phenotype in a different dir-ection of being disease-promoter or disease-protective. Because there is no clear cutoff distinguishing rare vari-ants from common varivari-ants, statistical methods that can analyze both rare and common variants simultaneously are often preferable [5, 11, 12]. In this sense, variant as-sociation tests can be best approached as a variable selection problem when the main goal is to identify causal variants [12–14]. There has been a parallel Correspondence:[email protected]
Biostatistics, Department of Population Health, New York University, New York, NY 10016, USA
development of new statistical methods for detecting rare variants in the Bayesian variable selection frame-work [12, 15–18].
In the present study, I extend my previous study [19] to the realm of rare variants in a Bayesian variable selec-tion by incorporating a Bayesian risk index approach [16, 17]. By using a risk index score on a group of rare variants over the genomic region, I evaluate both rare and common variants simultaneously. Inference of iden-tifying disease-associated variants is done by estimating marginal posterior probabilities of latent variables. I fur-ther perform the within-chain permutation [18] by adopting the idea of permuting the phenotype data in determining the empirical thresholds with regard to true and false signals.
Methods Data
I apply my method to Genetics Analysis Workshop (GAW) 19 unrelated data (n= 1934) that were carried out as part of the T2days-GENES (Type 2 Diabetes Gen-etic Exploration by Next-generation sequencing in multi-Ethnic Samples) consortium to study the associ-ation between blood pressure phenotypes and the single-nucleotide polymorphisms. The phenotypes of interest are real baseline diastolic blood pressure (DBP) and sys-tolic blood pressure (SBP), which I consider as continu-ous traits.
Model formulation
Suppose that a population-based association study con-sists ofnunrelated individuals. LetY =(Y1,…, Yn)
T denote the clinical quantitative outcome or response of interest fromnsamples andXdenote then × p-dimensional geno-type matrix of p variants in functional genomic regions. Throughout this article, I assume that genetic variants are independent and present no interaction effect. The model I posit on the clinical outcome is
Y¼ α0þ Xβþ ε ð1Þ
where X is associated with the coefficientsβ. The error terms ε= (ε1,…, εn) are assumed to be independent and identically distributed N(0, σ2In) for the gaussian re-sponses. I assume an additive genetic model; thusXij= 0, 1, or 2, representing the number of minor alleles present at variant jof individuali. Note that additive model and dominant model are almost equivalent in rare variant analysis.
Given this information, I use Bayesian model uncer-tainty techniques in which an individual model is speci-fied by the p-dimensional vector of binary indicators γ = (γ1,…, γp). Each component γj= 1(0) indicates the in-clusion (exin-clusion) of variant j. With a prespecified
MAF threshold of defining rare variants, I further as-sume that the genotype matrix X is known to be parti-tioned intoG groups such asX= (X1,…, XG), where the gth group, Xg contains kg rare variants (or 1 common variant) forg = 1,…, G. Then I define the risk index score as a linear function within the group as Gg= Xg*γg, whereGgis a vector of lengthnthat gives the risk index for each individual andγgcontains a vector of binary in-dicators for a group of kgrare variants. Then X= (X1,…, XG) becomes n × G-dimensional risk index matrix (G< p). Equation (1) is rewritten in relating the quantitative outcome variable to the risk index matrix by fitting the modelY =β0+ Gβ+ε, whereβ= (β1,…,βG) is a vector of group-specific coefficients.
Model likelihood and priors
Under the Bayesian method of estimation, computing the degree to which any model represented by γ in the model space M is supported by the data is calculated via posterior model probabilities of the form p Yð jγÞ ¼X pð Þγp Yð jγÞ
γ∈Mpð Þγ p Yð jγÞ
where the nominator
entails the multiplication of prior and likelihood function by Bayes’ rule. To calculate the marginal likelihood, I integrate out any dependency on the pa-rameters β and σ, and use the following approxima-tion in the likelihood funcapproxima-tion:
p Yð jγÞ ¼∬f Y β;σ2;γfβ;σ2⋅dβ⋅dσ2≈p Y γ;βb;bσ2
This approximation corresponds to assuming that all of the prior mass of the model-specific parameters,θ -γ = (β0, β, σ), is placed on the maximum likelihood esti-mate (MLE). Given the approximation to the marginal likelihood, I am left to define the prior distribution p(γ) on the model space M. To do so, I assume that the number of variants included (nonzero components) in a chosen model γ is distributed as a binomial with π the prior inclusion probability of each variant, whereπ con-trols the average number of variants included in the model. Hereafter π is referred to as a prior inclusion probability (PIP). Then
pð Þ ¼γ
Π
p
i¼1πγið1−πÞ 1−γi
Model search using Markov chain Monte Carlo
Once the priors have been chosen, my key construct of interest is the posterior of the p-dimensional vector of binary indicatorsγ,which capture the association between variants and the outcome. Markov chain Monte Carlo (MCMC) can often be used to extract such information by simulating an approximate sample from the posterior distribution. Most popular are the Gibbs sampler (GS) [20, 21] and the Metropolis-Hastings (MH) algorithms [22, 23]. In this study, I use the MH algorithm to draw samples from the posterior probability distribution from the model space similarly as in Quintana et al. [16].
Marginal posterior quantities
I am interested in answering the question of which vari-ant(s) is(are) most likely to derive the association with phenotype. This question can be answered based on marginal posterior probabilities. The marginal posterior probability (MPP) for any γj can be calculated as the sum of the posterior probabilities for every model that includes the variable. This is then used as a measure of the evidence ofjthvariant for association with phenotype and the ranking of their MPPs as a measure of the rela-tive importance. Variants whose MPPs exceed the PIP are selected as being disease-associated, similarly as in my previous study [19].
Decision rule based a permutation within Markov chain Monte Carlo
Determining true- and false-positive signals in general remains an open problem within Bayesian analysis. Often Bayes factor [24] is considered to be a preferred decision-making rule because it is free of the analyst’s subjectivity and allows the strength of evidence provided by the data in favor of a hypothesis to be evaluated on the widely used empirical scale [25]. Although Bayes fac-tor is a practical tool in a Bayesian context, it has been argued to be sensitive to prior distributions and often becomes computationally intensive in high-dimensional data. However, the permutation test does provide a data-driven decision rule and is conceptually easier to imple-ment. It has been a universal tool in evaluating the significance across various statistical methods. In this study, I implement a permutation within MCMC by adopting the idea of permuting the phenotype data, which is used to determine empirical thresholds in iden-tifying true-positive variants.
In detail, let y= {yj} be the vector of the original phenotypes and y* = {yj*} be the randomly rearranged (permuted) vector of phenotypes. For each iteration, 2 MCMC runs are conducted, one on p(γ|Y) and the other on p(γ|Y*), to generate the empirical posterior distributions under the null model. After variants are
screened from the comparison with the PIP, true-positive variants are further identified by gauging their MPPs against ones calculated from the permutation. That is, variants whose MPPs exceed empirical MPPs are declared to be true positives.
Results
I focused on theMAP4gene in chromosome 3 that was previously reported to be highly associated with blood pressure [26]. The sequenced MAP4 gene had 409 vari-ant sites. Of these, 324 varivari-ants were seen at allele fre-quencies with 0 %. After eliminating 92 individuals with missing data and singleton variants, 85 variants on 1851 unrelated individuals remained. Log-transformation of the phenotype was performed to fix the skewing of the phenotype distribution.
Any division of genetic variants into “common” and “rare” is arbitrary. Although most association studies often use a MAF threshold of 1 % for differentiating be-tween a polymorphism and a mutation, this may not be the optimal threshold for rare variant analysis [5]. I ex-amined the sensitivity of my method to the classification of variants by varying MAF thresholds from starting at 5 %. Choosing the PIP is straightforward. Because it con-trols the sparsity of the model, a smaller value provides smaller MPPs. Although estimated MPPs are sensitive to the choice of the PIP, the ranking of MPPs is relatively insensitive (data not shown), which was evaluated in my previous work [19]. I fixed PIP as equaling 0.1, which implies that, in expectation, 1 out of 10 variants are in-cluded in the model.
For each MCMC run, the convergence of the search was monitored. To see how stable the final estimates were, multiple MCMC runs were also conducted with different initial values and starting points. Convergence of the estimates was checked by the test of convergence diagnostics proposed by Geweke [27] and monitored using the R package CODA.
The chains seemed to reach their target distribution after 5000 or fewer iterations overall. I discarded the first 5000 iterations as a burn-in period. The chain was thinned by keeping 1 observation out of 10 iterations to reduce correlation until the posterior sample size reached 5000. The total number of iterations was 5000 + 5000 × 10 = 55,000. The remaining samples were used to perform inference.
0.0 0.2 0.4 0.6
0 20 40 60 80
SNP
Marginal poster
ior probability
MAF
<0.05%
<0.1%
<0.5%
<1%
<5% Phenotype=SBP
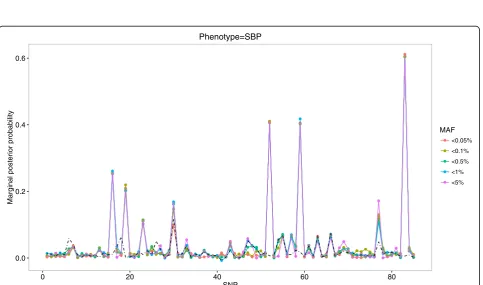
Fig. 2Profiles of MPPs under various MAF thresholds for SBP phenotype in comparison with empirical MPPs (theblack dotted-line)
0.0 0.2 0.4 0.6
0 20 40 60 80
SNP
Marginal poster
ior probability
MAF
<0.05%
<0.1%
<0.5%
<1%
<5% Phenotype=DBP
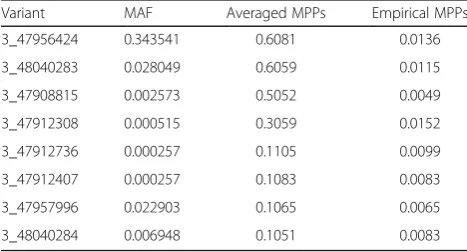
3_48016938), consistently exceeding PIP = 0.1, as well as empirical MPPs (the dotted black line) across various MAF thresholds. These remained as being true positives after their averaged MPPs were evaluated against empirical MPPs. On the other hand, among 6 variants whose MPPs were slightly greater than PIP = 0.1, 4 variants (3_47912736, 3_47912407, 3_47957996, 3_48040284) remained to be true positives for association with DBP, whereas the variant (3_47912736) remained to be true positive for association with SBP. The finally selected variants were ordered by their averaged MPPs in Tables 1 and 2.
Discussion and conclusions
In this paper, I have applied the Bayesian variable selec-tion approach to study the associaselec-tion between increases in baseline SBP and DBP and genetic variants in the data from GAW19. Although most of the statistical methods designed for rare variant association tests can perform global tests for the association between the region and phenotypes as a result of the low frequencies of rare var-iants, my method enables detection of not only rare vari-ants, but also of common variants for their significance. My method is highly flexible and allows for uncertainty in estimating parameters in variant selection using the Bayesian framework. The key to my approach is the use of a risk index score and indicator parameters to detect the variant-specific signals. The posterior distributions of all parameters of interest are estimated via MCMC ef-ficiently. I also implemented computationally advanta-geous permutation within MCMC to calculate empirical thresholds to determine true-positive variants. The de-tection of disease-associated variants was not sensitive to the MAF thresholds defining rare variants. The appli-cation to the GAW19 data reveals that that some com-mon variants and rare variants in the MAP4 gene are associated with DBP and SBP.
In the application, I have focused on a binary case of inclusion/exclusion of variants. However, my method can be extended to investigate mixed effects (the pres-ence of both protective and risk effects) within the
group of rare variants by further assuming γj=−1 if a variant is a risk factor and γj= 1 if a protective factor as in Quintana et al. [16]. This extension may be used to uncover the direction of effects of the variants, but at the cost of substantially increased computation time of the algorithm.
Finally, the current study focused on the specific gene regions. I anticipate that the computational challenges of my method will grow substantially for genome-wide searching of rare genetic variants. However, I believe that the qualitative advantages of my approach make it worth investing effort into designing more efficient MCMC algorithms, so as to be able to better deal with very large-scale applications. I leave this to future work.
Acknowledgements
I would like to thank Ms. Lijin Joo for her efforts with organizing the data for the analyses.
Declarations
This article has been published as part ofBMC ProceedingsVolume 10 Supplement 7, 2016: Genetic Analysis Workshop 19: Sequence, Blood Pressure and Expression Data. Summary articles. The full contents of the supplement are available online at http://bmcproc.biomedcentral.com/ articles/supplements/volume-10-supplement-7. Publication of the proceedings of Genetic Analysis Workshop 19 was supported by National Institutes of Health grant R01 GM031575.
Authors’contributions
CO initiated the design of the study, completed the analysis, and drafted the manuscript.
Competing interests
The author declares they have no competing interests.
Published: 18 October 2016
References
1. Manolio TA, Collins FS, Cox NJ, Goldstein DB, Hindorff LA, Hunter DJ, McCarthy MI, Ramos EM, Cardon LR, Chakravarti A, et al. Finding the missing heritability of complex diseases. Nature. 2009;461(7265):747–53.
2. Li DJ, Leal SM. A novel adaptive method for the analysis of next generation sequencing data to detect complex trait associations with rare variants due to gene main effects and interactions. PLoS Genet. 2008;6(10):e1001156. 3. Madsen BE, Browning SR. A groupwise association test for rare mutations
using a weighted sum statistic. PLoS Genet. 2009;5(2):1–11.
4. Morris AP, Zeggini E. An evaluation of statistical approaches to rare variant analysis in genetic association studies. Genet Epidemiol. 2010;34(2):188–93.
Table 1True-positive variants in geneMAP4ordered by MPPs
for association with DBP
Variant MAF Averaged MPPs Empirical MPPs
3_47956424 0.343541 0.6081 0.0136
Table 2True-positive variants in gene MAP4 ordered by MPPs
for association with SBP
Variant MAF Averaged MPPs Empirical MPPs
5. Price AL, Kryukov GV, de Bakker PI, Purcell SM, Staples J, Wei LJ, Sunyaev SR. Pooled association tests for rare variants in exon-resequencing studies. Am J Hum Genet. 2010;86(6):832–8.
6. Brennan JS, He Y, Calixte R, Nyirabahizi E, Jiang Y, Zhang H. A LASSO-based approach to analyzing rare variants in genetic association studies. BMC Proc. 2011;5(Suppl 9):S100.
7. Turkmen A, Lin S. Gene-based partial least-squares approaches for detecting rare variant associations with complex traits. BMC Proc. 2011;5(Suppl 9):S19. 8. Zhou H, Sehl ME, Sinsheimer JS, Lange K. Association screening of common
and rare genetic variants by penalized regression. Bioinformatics. 2010;26(19):2375–82.
9. De Jong S. SIMPLS: an alternative approach to partial least squares regression. Chemometr Intell Lab Syst. 1993;18:251–63.
10. Xu C, Ladouceur M, Dastani Z, Richards JB, Ciampi A, Greenwood CM. Multiple regression methods show great potential for rare variant association tests. PLoS One. 2012;7(8):e41694.
11. Hoffmann TJ, Marini NJ, Witte JS. Comprehensive approach to analyzing rare genetic variants. PLoS One. 2010;5(11):e13584.
12. Yi N, Liu N, Zhi D, Li J. Hierarchical generalized linear models for multiple groups of rare and common variants: jointly estimating group and individual-variant effects. PLoS Genet. 2011;7(12):e1002382.
13. Frank IE, Friedman JH. A statistical view of some chemometics regression tools. Technometrics. 1993;35:109–35.
14. Tibshirani RJ. Regression shrinkage and selection via the LASSO. J R Stat Soc Series B Stat Methodol. 1996;35:267–88.
15. Tibshirani RJ. The LASSO method for variable selection in the Cox model. Stat Med. 1997;16(4):385–95.
16. Yi N, Zhi D. Bayesian analysis of rare variants in genetic association studies. Genet Epidemiol. 2011;35(1):57–69.
17. Quintana MA, Berstein JL, Thomas DC, Conti DV. Incorporating model uncertainty in detecting rare variants: the bayesian risk index. Genet Epidemiol. 2011;35(7):638–49.
18. Quintana MA, Schumacher FR, Casey G, Bernstein JL, Li L, Conti DV. Incorporating prior biologic information for high-dimensional rare variant association studies. Hum Hered. 2012;74(3–4):184–95.
19. Che X, Xu S. Significance test and genome selection in bayesian shrinkage analysis. Int J Plant Genomics. 2010;2010:893206.
20. Oh C. A bayesian genome-wide linkage analysis of quantitative traits for rheumatoid arthritis via perfect sampling. BMC Proc. 2007;1(Suppl 1):S110. 21. Gelfand AE, Smith A. Sampling-based approaches to calculating marginal
densities. J Am Stat Assoc. 1990;85(410):398–409.
22. Geman S, Geman D. Stochastic relaxation, Gibbs distributions and the bayesian restoration of image. IEEE Trans Pattern Anal Mach Intell. 1984;6(6):721–41.
23. Hastings WK. Monte Carlo sampling methods using Markov chains, and their applications. Biometrika. 1970;57:97–109.
24. Metropolis N, Rosenbluth A, Rosenbluth M, Teller A, Teller E. Equations of state calculations by fast computing machines. J Chem Phys. 1953;21:1087–92. 25. Kass RE, Raftery AE. Bayes factors. J Am Stat Assoc. 1995;90:773–95. 26. Jeffreys H. Theory of Probability. 3rd ed. Oxford: Oxford University Press;
1961.
27. Wain LV, Verwoert GC, O'Reilly PF, Shi G, Johnson T, Johnson AD, Bochud M, Rice KM, Henneman P, Smith AV. Genome-wide association study identifies six new loci influencing pulse pressure and mean arterial pressure. Nat Genet. 2011;43(10):1005–11.
• We accept pre-submission inquiries
• Our selector tool helps you to find the most relevant journal • We provide round the clock customer support
• Convenient online submission • Thorough peer review
• Inclusion in PubMed and all major indexing services • Maximum visibility for your research
Submit your manuscript at www.biomedcentral.com/submit