P R O C E E D I N G S
Open Access
Detection of associations with rare and common
SNPs for quantitative traits: a nonparametric
Bayes-based approach
Lili Ding
1,2*, Tesfaye M Baye
2,3, Hua He
4, Xue Zhang
4, Brad G Kurowski
2,5, Lisa J Martin
1,2,4From
Genetic Analysis Workshop 17
Boston, MA, USA. 13-16 October 2010
Abstract
We propose a nonparametric Bayes-based clustering algorithm to detect associations with rare and common single-nucleotide polymorphisms (SNPs) for quantitative traits. Unlike current methods, our approach identifies associations with rare genetic variants at the variant level, not the gene level. In this method, we use a Dirichlet process prior for the distribution of SNP-specific regression coefficients, conduct hierarchical clustering with a distance measure derived from posterior pairwise probabilities of two SNPs having the same regression coefficient, and explore data-driven approaches to select the number of clusters. SNPs falling inside the largest cluster have relatively low or close to zero estimates of regression coefficients and are considered not associated with the trait. SNPs falling outside the largest cluster have relatively high estimates of regression coefficients and are considered potential risk variants. Using the data from the Genetic Analysis Workshop 17, we successfully detected associations with both rare and common SNPs for a quantitative trait. We conclude that our method provides a novel and broadly applicable strategy for obtaining association results with a reasonably low proportion of false discovery and that it can be routinely used in resequencing studies.
Background
The two highly debated hypotheses on the genetic basis of complex human diseases are the common disease/ common variant (CDCV) hypothesis and the common disease/rare variant (CDRV) hypothesis [1]. The CDCV hypothesis states that common diseases are caused by common variants (minor allele frequencies [MAF] > 5%) with small to modest effects. The CDRV hypothesis, on the other hand, argues that common diseases are caused by multiple rare variants (MAF < 5%), each with moder-ate to high penetrance. Although both common and rare variants likely play a role in complex human diseases, most statistical strategies for association analysis have been developed under the CDCV assumption, except recent work by Li and Leal [2] and Han and Pan [3]. A key strategy for association analysis with rare variants is
to study the cumulative effect of multiple rare variants within the same gene or linkage disequilibrium block [2,4,5]. However, these methods identify genetic risk factors at the gene level, not the variant level. We pro-pose a nonparametric Bayes-based approach to detect associations with both rare and common genetic variants for quantitative traits. This approach clusters single-nucleotide polymorphisms (SNPs) according to the mag-nitude of SNP-specific regression coefficients. SNPs clus-tered together could come from different linkage disequilibrium blocks, genes, or even different chromo-somes and could have quite different MAFs.
Methods
Suppose that for each individual i(i = 1, 2,…, n) we observeyi, a quantitative trait;zi, ap-dimensional vector of individual-specific covariates, such as age and sex; and xi = (xi1, xi2, …, xiJ) , genotypes atJ SNPs. Here, we assume an additive genetic model; thusxij= 0, 1, or 2, representing the number of minor alleles present at SNP
* Correspondence: [email protected]
1
Division of Biostatistics and Epidemiology, Cincinnati Children’s Hospital Medical Center, 3333 Burnet Avenue, Cincinnati, OH 45229, USA Full list of author information is available at the end of the article
jof individuali. A regression model on the quantitative coefficients, including the intercept and slopes for indi-vidual-specific covariates, the bj are the SNP-specific regression coefficients, andεiis the error term. We spe-cify the following prior distributions for the model para-meters: g ~Np+1( , ,0 1 v2),bj ~G,G~ DP(a, G0), and s ~ U(a, b). Here, v2 and b >a ≥ 0 are prespecified hyperparameters, Np+1( , )mm Σ is a (p + 1)-dimensional normal distribution with mean vector μ and variance-covariance matrixΣ,0is a vector of zeros, Iis an iden-tity matrix, Gdenotes a random distribution,U(a, b) denotes a uniform distribution betweenaandb, and DP (a,G0) is the Dirichlet process.
Dirichlet process
The Dirichlet process [6] is a probability model on a space of probability distributions. It has two parameters: the base probability distributionG0 and the precision
parametera(>0). If G~ DP(a,G0), then G0 is the prior
expectation of G and a controls the variance of G. Here, we take G0=N+(m s0, 02), which is a normal density truncated below at 0, and use U(c,d),d >c> 0, as the prior distribution for the precision parametera.
Sethuraman [7] provided a stick-breaking construction of the Dirichlet process, which states that if we have:
p1=V1, (2)
is a random probability distribution generated from DP(a, G0), where δjk denotes a point mass at jk. It is clear that Gis discrete with probability 1. Because of the discreteness, thebjcan take on the same value. That
is why the Dirichlet process can be used for clustering analysis.
Ishwaran and James [8] studied a truncated version of the Dirichlet process by choosing a truncation levelN and setting VN = 1 in the stick-breaking construction. They used the truncated Dirichlet process to approxi-mate Dirichlet process prior distributions and developed a block Gibbs sampling method for Dirichlet process models.
Clustering
Each iteration of the Gibbs sampler gives a clustering structure of SNP-specific regression coefficients such that coefficients taking the same value are clustered together. The number of clusters and the cluster mem-bership of the coefficients vary across iterations, giving a random sample of clustering structures. Pairwise prob-abilities of two coefficients being equal are calculated from the posterior samples [9]. A distance measure is derived as 1 minus these pairwise probabilities and is then used in complete linkage hierarchical clustering to obtain a final clustering structure of the SNPs. We study a range of the number of clusters, from as small as 2–5 clusters to as large as 100 clusters. Optimal cluster num-bers are also obtained by striking a balance between sen-sitivity and specificity. In all cases, SNPs in the largest cluster have relatively low or close to zero estimates of regression coefficients and are considered not associated with the trait. SNPs falling outside the largest cluster have relatively high estimates of regression coefficients and are considered potential risk variants. The propor-tion of false discovery (FDP), defined as the ratio of the number of false discoveries to the total number of discov-eries, is examined.
Application of the method
We illustrate our methods using the data from Genetic Analysis Workshop 17. The analyses were performed with the knowledge of the underlying simulation model [10]. We studied the first 10 replicates of the quantita-tive trait Q1. Each replicate contains 697 unrelated indi-viduals from 7 populations. To control for population stratification, we conducted principal components analy-sis on nonsynonymous common SNPs (n = 1,379) and included the resulting first two components as covari-ates, in addition to Age and Smoke. We built our model with 244 nonsynonymous SNPs selected from the vascu-lar endothelial growth factor (VEGF) pathway [11]. These SNPs include all 39 functional SNPs for Q1, of which 23 are private variants (found in one individual, MAF = 0.000717) and 2 are common SNPs. The model was fitted using WinBUGS [12] withv2 = 1,000,a= 0, b = 100, c = 0.5, d = 20, µ0 = 0.5, and s02=2. The
50. For each replicate, 10,000 Markov chain Monte Carlo posterior samples were generated after a burn-in period of 2,000 iterations.
We evaluated our results using two thresholds. When the number of clusters was small (2–5), we defined true positives as true associations identified in at least 2 of the 10 replicates. This threshold was selected to balance the reduced power resulting from small cluster num-bers. Indeed, requiring at least two replications for each identified association yielded a reasonably low FDP. When we used the optimal cluster numbers, we defined true positives as true associations detected in no less than eight replicates. We carried out sensitivity analyses
on the prior specification for the SNP-specific regression coefficients withµ0ranging from 0.1 to 0.5 and s02
ran-ging from 0.5 to 2. Similar results were obtained.
Results and discussion
Successful identification of associations
Table 1 lists the true discoveries with their MAFs, regression coefficients (b) used in the simulation, and frequency of detection. When we used two clusters, we found eight true positives with no false positives. Com-pared with false negatives, the true positives have either relatively high MAFs or relatively high effect sizes. With 3 clusters, we had 11 true positives and no false positives. With 4 or 5 clusters, we detected 12 and 13 associations, respectively. However, there was one false positive (data not shown) in both cases (FDP
≈ 8%). We also conducted single-SNP-based tests with Bonferroni correction for multiple comparisons. With the criteria that p ≤ 0.05/244 in at least 2 of the 10 replicates, 20 associations were detected and 10 of them were true discoveries, giving an FDP of 50%. Compared with single-SNP tests, our method gave a much lower FDP.
Selection of optimal number of clusters
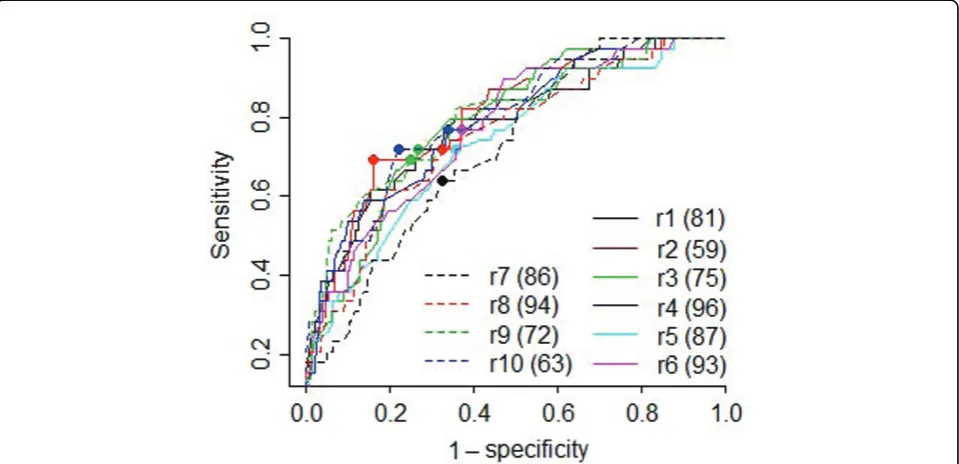
As the number of clusters increases, more associations may be detected; however, the number of false positives may also increase. To strike a balance between sensitivity and specificity, we examined receiver operating charac-teristic (ROC) curves (Figure 1) for each replicate. The optimal cluster numbers ranged from 59 to 96, with an
Table 1 True discoveries in at least two replicates with 2 to 5 clusters
Gene SNP MAF b F2 F3 F4 F5
FLT1 C13S523 0.066714 0.64997 10 10 10 10
FLT1 C13S431 0.017217 0.74136 9 9 9 9
FLT1 C13S522 0.027977 0.61830 8 8 8 8
VEGFA C6S2981 0.002152 1.20645 6 6 6 7
ARNT C1S6533 0.011478 0.5619 5 6 7 7
FLT1 C13S524 0.004304 0.62223 4 4 5 5
KDR C4S1884 0.020803 0.29558 4 4 4 5
KDR C4S1878 0.164993 0.13573 2 4 4 4
KDR C4S1877 0.000717 1.07706 1 4 5 6
KDR C4S1889 0.000717 0.94133 1 2 3 5
ARNT C1S6542 0.002152 0.46026 1 2 2 2
KDR C4S1861 0.002152 0.56311 1 1 1 2 F2, F3, F4, F5: frequency of detection (in bold when≥2) over the 10 replicates with 2 to 5 clusters.
Figure 1ROC curves and optimal cluster numbers.r1–r10represent the first 10 replicates of the quantitative trait Q1. Numbers in parentheses
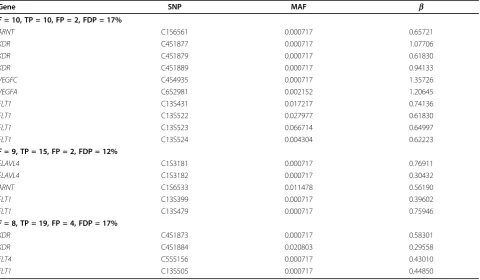
average of 81. At the optimal cluster number for each replicate, the average sensitivity and specificity were 0.71 and 0.72, respectively. We then examined the associa-tions detected in these rounds. We had 100% power (detected in all 10 replicates) to detect 10 true associa-tions (Table 2) with 2 false positives (FDP = 17%). Using a threshold of 90% power, five additional true associa-tions were detected and are in theF= 9 rows in Table 2, with no additional false positives (FDP = 12%). Using a threshold of 80% power, we detected another four true associations (19 total); however, the number of false posi-tives went up to four (FDP = 17%).
We then evaluated the performance of this method using a specified number of clusters, ranging from 50 to 100. Using only associations identified with 100% power, we had 8 to 10 true positives and at most 2 false nega-tives (FDP ranging from 10% to 18%). For 90% power, we had 8 to 16 true positives and at most 4 false negatives (FDP ranging from 8% to 20%). Thus cluster numbers of 50 to 100 seem reasonable.
Characteristics of the true positives and false negatives Using optimal cluster numbers and the threshold of true positives, we identified 12 of the 23 true associations with
Table 2 True discoveries in at least eight replicates with optimal cluster numbers
Gene SNP MAF b
F= 10, TP = 10, FP = 2, FDP = 17%
ARNT C1S6561 0.000717 0.65721
KDR C4S1877 0.000717 1.07706
KDR C4S1879 0.000717 0.61830
KDR C4S1889 0.000717 0.94133
VEGFC C4S4935 0.000717 1.35726
VEGFA C6S2981 0.002152 1.20645
FLT1 C13S431 0.017217 0.74136
FLT1 C13S522 0.027977 0.61830
FLT1 C13S523 0.066714 0.64997
FLT1 C13S524 0.004304 0.62223
F= 9, TP = 15, FP = 2, FDP = 12%
ELAVL4 C1S3181 0.000717 0.76911
ELAVL4 C1S3182 0.000717 0.30432
ARNT C1S6533 0.011478 0.56190
FLT1 C13S399 0.000717 0.39602
FLT1 C13S479 0.000717 0.75946
F= 8, TP = 19, FP = 4, FDP = 17%
KDR C4S1873 0.000717 0.58301
KDR C4S1884 0.020803 0.29558
FLT4 C5S5156 0.000717 0.43010
FLT1 C13S505 0.000717 0.44850
The items in the bolded rows are the frequency of detection over the 10 replicates (F), the number of true positives (TP), the number of false positives (FP), and the proportion of false discovery (FDP) in each case.
private SNPs. As we expected, true positives had overall higher effect sizes than false negatives (Figure 2a). Among the 14 true associations with rare but nonprivate variants, true positives had relatively high MAFs andb compared with false negatives, as shown in Figures 2b and 2c.
Conclusions
We have demonstrated that a novel nonparametric Bayes-based clustering method can be used to identify associa-tions with SNPs for quantitative traits. Importantly, this method is capable of detecting associations with both rare and common genetic variants. Compared with other methods that deal with rare variants, our methods detect genetic risk factors directly at the SNP level. Compared with single-SNP-based methods, the proposed method is more powerful and reliable. It can detect a relatively larger proportion of true associations independent of the MAF of the variants, and it produces a relatively lower propor-tion of false discoveries.
Acknowledgments
We wish to thank Siva Sivaganesan for valuable discussion and two anonymous reviewers for their insightful comments and suggestions. This work was supported by National Institutes of Health (NIH) grants K01 HL103165, K12 HD001097-14, K24 HL69712, R01 NS036695, and U19 A1070235. The Genetic Analysis Workshops are supported by NIH grant R01 GM031575 from the National Institute of General Medical Sciences. This article has been published as part ofBMC ProceedingsVolume 5 Supplement 9, 2011: Genetic Analysis Workshop 17. The full contents of the supplement are available online at http://www.biomedcentral.com/1753-6561/5?issue=S9.
Author details
1
Division of Biostatistics and Epidemiology, Cincinnati Children’s Hospital Medical Center, 3333 Burnet Avenue, Cincinnati, OH 45229, USA.
2Department of Pediatrics, University of Cincinnati College of Medicine,
Cincinnati OH 45229, USA.3Division of Asthma Research, Cincinnati
Children’s Hospital Medical Center, 3333 Burnet Avenue, Cincinnati, OH 45229, USA.4Division of Human Genetics, Cincinnati Children’s Hospital Medical Center, 3333 Burnet Avenue, Cincinnati, OH 45229, USA.5Division of
Physical Medicine and Rehabilitation, Cincinnati Children’s Hospital Medical Center, 3333 Burnet Avenue, Cincinnati, OH 45229, USA.
Authors’contributions
LD conceived and performed the statistical analysis and wrote the manuscript. LJM contributed to the design of the statistical analysis and the writing of the manuscript. TMB, HH, XZ, and BGK helped with the writing of the manuscript. All authors read and approved the final manuscript.
Competing interests
The authors declare that there are no competing interests.
Published: 29 November 2011
References
1. Schork NJ, Murray SS, Frazer KA, Topol EJ:Common vs. rare allele hypotheses for complex diseases.Curr Opin Genet Dev2009,19:212-219. 2. Li B, Leal SM:Methods for detecting associations with rare variants for common diseases: application to analysis of sequence data.Am J Hum Genet2008,83:311-321.
3. Han F, Pan W:A data-adaptive sum test for disease association with multiple common or rare variants.Hum Hered2010,70:42-54.
4. Morgenthaler S, Thilly WG:A strategy to discover genes that carry multi-allelic or mono-multi-allelic risk for common diseases: a cohort multi-allelic sums test (CAST).Mutat Res Fund Mol Mech2007,615:28-56.
5. Madsen BE, Browning SR:A groupwise association test for rare mutations using a weighted sum statistic.PLoS Genet2009,5:e1000384.
6. Ferguson TS:Bayesian analysis of some nonparametric problems.Ann Stat1973,1:209-230.
7. Sethuraman J:A constructive definition of Dirichlet priors.Stat Sinica
1994,4:639-650.
8. Ishwaran H, James LF:Gibbs sampling methods for stick-breaking priors.
J Am Stat Assoc2001,96:161-173.
9. Medvedovic M, Sivaganesan S:Bayesian infinite mixture model based clustering of gene expression profiles.Bioinformatics2002,18:1194-1206. 10. Almasy LA, Dyer TD, Peralta JM, Kent JW Jr, Charlesworth JC, Curran JE,
Blangero J:Genetic Analysis Workshop 17 mini-exome simulation.BMC Proc2011,5(suppl 9):S2.
11. BioCarta:Pathways: VEGF, hypoxia, angiogenesis.[http://www.biocarta. com/pathfiles/h_vegfpathway.asp].
12. Lunn DJ, Thomas A, Best N, Spiegelhalter D:WinBUGS: a Bayesian modeling framework—concepts, structure, and extensibility.Stat Comput
2000,10:325-337.
doi:10.1186/1753-6561-5-S9-S10
Cite this article as:Dinget al.:Detection of associations with rare and common SNPs for quantitative traits: a nonparametric Bayes-based approach.BMC Proceedings20115(Suppl 9):S10.
Submit your next manuscript to BioMed Central and take full advantage of:
• Convenient online submission
• Thorough peer review
• No space constraints or color figure charges
• Immediate publication on acceptance
• Inclusion in PubMed, CAS, Scopus and Google Scholar
• Research which is freely available for redistribution