Applications of Surface Correlation to the Estimation
of the Harmonic Fundamental of Speech
Douglas J. Nelson
R523, U.S. Department of Defense, Ft. Meade, MD 20755, USA Email: [email protected]
Received 24 July 2001
We present a method for estimating the fundamental frequency of harmonic signals, and apply this method to human speech. The method is based on cross-spectral methods, which provide accurate resolution of multicomponent FM signals in both time and frequency. The fundamental is re-introduced to the spectrum by a frequency-lag autocorrelation of the spectrum, even if the fundamental is completely missing in the original spectrum. By combining the different perspectives of the Fourier spectral representation and the time-lag autocorrelation function we suppress all components of harmonic signals except for the fundamental.
Keywords and phrases:cross-spectrum, phase spectrum, STFT, Fourier transform, speech, formant recovery, equalization.
1. INTRODUCTION
In applications, such as speech vocoding or tasks, such as de-termining the identity or gender of the speaker of a short segment of speech, accurate estimation of excitation and for-mants (vocal tract resonances) is an important problem. The basic structure of voiced speech is the superposition of vocal tract resonances, which are excited by a quasi-periodic train of pulses formed at the glottis at the back of the vocal tract.
While both the excitation frequencyω0and the formant
quencies are nonstationary, it is well known that these fre-quencies are statistically quite different for male and female
speakers and for different individuals of the same gender.1In
gender identification (GID) and speaker identification (SID), the ability to accurately estimate and track speech-related frequencies results in feature distributions with reduced vari-ance and, in principle, provides better identification perfor-mance. In vocoding, accurate estimation of speech features results in higher quality speech reproduction and lower cod-ing bit rates. In this paper, we address the problem of isolatcod-ing and accurately estimating speech components in both time and frequency. While the application in this paper is speech, it should be noted that the methods presented apply equally well to the estimation of any multicomponent nonstationary harmonic signal.
1The excitation fundamental frequency is normally represented asF
0. We use the notationω0to follow the convention that frequencies are represented by the variations of the Greek “ω” and representations of the signal are represented by variations of the letter “f”.
Cross-spectral methods, based on the short time Fourier transform (STFT) phase, have been recently demonstrated by Nelson to be effective in accurately estimating speech for-mants and the vocal tract excitation in time and frequency [1]. In that paper, the concept of indicator functions, based on mixed partial phase derivatives, was introduced as a method of isolating regions of the TF surface representing vocal tract resonance and excitation, respectively. The accuracy of the frequency and time estimation provided by the cross-spectral method is based on a phase gradient descent algorithm. The phase gradient represents a second-order statistics, and the indicator functions represent a 4th order statistic. While it may be possible to develop similar methods for nonlinear surfaces, such as the Wigner distribution, cross terms or inter-modulation products would likely be a problem. Therefore, the approach taken here is to use the STFT to estimate an initial surface on which the signal components are separated. With this separation, no cross terms are produced in the non-linear differentiation processes.
fundamental of harmonic signals, while greatly attenuating the energy in the higher harmonics. Moreover, the represen-tation is complex, with phase representing the differentiated phase of the short time Fourier transform surface, making it possible to apply the cross-spectral methods developed for the STFT. For speech signals, the correlation spectral representa-tion may be used to determine the excitarepresenta-tion fundamental,
ω0, unambiguously.
This paper is structured as follows. In Section 2, we briefly describe the structure of speech. Section 3 contains a brief de-scription of the remapping of the STFT surface. In Section 4, we introduce indicator functions computed from the spec-tral phase, which may be used to identify the properties of signal components which produce the individual STFT sur-face components. In Section 5, we introduce the correlation spectrum, which combines the properties of the autocorre-lation function and the Fourier spectrum. When applied to harmonic signals, the combined representation produces a spectrum with energy at the signal fundamental, while greatly reducing the energy in the harmonics and sub-harmonics. Fi-nally, in Section 6, we present a short experimental example which demonstrates the methods presented in this paper on speech.
2. THE SIGNAL MODEL
Speech is an acoustic signal, which results as the vocal tract is excited by a combination of frication and voicing. The primary excitation function is voicing, in which a sequence of pulses is generated at the glottis at the back of the vocal tract. As these pulses excite the vocal tract, the vocal tract res-onates at a several resonant frequencies called formants. The formants act as infinite impulse response (IIR) filters, which are quite broad in bandwidth, because of loss in the vocal tract [2]. Because the voiced excitation function is pulsed, its narrowband Fourier representation appears as a harmonic structure
ωn(t)=nω0(t), (1)
where the fundamental excitation frequency ω0(t) is time
dependent. The Fourier spectrum has the representation
F (ω)=
B
Af (t)h(−t)e
−iωtdt, (2)
where the analysis interval[A, B]is chosen sufficiently large
to contain several pulse intervals. In this representation the only spectral energy observed at the output of the mouth is concentrated in the pitch harmonics, which survive the vocal tract (i.e., the pitch harmonics which are within the
pass-band of one of the formants). In trying to estimateω0(t),
we have the interesting problem that many of the pitch har-monics are severely attenuated. In general, the fundamental,
ω0(t), is not the strongest harmonic and, in fact is frequently
completely missing. The normal way of circumventing this problem is to isolate a strong harmonic, estimate the order of the harmonic, and then recover the fundamental by dividing the harmonic frequency by its number. This works, as long
as no mistake is made in estimating the harmonic number. If a mistake is made, the results are catastrophic. Our goal is to demonstrate a process which may recover an unambiguous fundamental, even if the fundamental is not present in the speech spectrum. The method we present is based entirely on the phase of the STFT, and uses two applications of the auto-correlation function to reproduce energy at the fundamental and annihilate energy in the harmonics.
3. CROSS-SPECTRAL METHODS/REMAPPING
In the methods developed here, we rely heavily on the use of phase derivatives for detecting signal components and esti-mating their parameters. This is not a new concept. The group delay (GD) and instantaneous frequency (IF) functions
ap-peared in the literature more than 30years ago (cf. [3, 4]).
These functions have the representation
GDf = −
where the analytic representation off (t)is assumed in the
IF representation, andF (ω)represents the Fourier transform
of the signalf (t).
The STFT is a generalization of the Fourier transform in which the Fourier transforms of the product of the signal f (t)and a sequence of time translations of a (short) analysis
window h(−t) are computed. The STFT may therefore be
represented as [5]
F (ω, T )=
∞
−∞f (t+T )h(−t)e
−iωtdt. (4)
While F (ω, T ) is dependent on the windowing function
h(−t), we drop the “h” from the notation for simplicity. It can
easily be seen thatF (ω0, T )is the convolution off (t)and
h(t)eiω0t. For fixedω0,F (ω0, T )is therefore a (bandpass) filtered version of the original signal.
We define the channelized instantaneous frequency (CIF) and local group delay (LGD) functions as
CIFf(ω, T )=
where we assume that arg{F (ω, T )}is continuously
differen-tiable.
phase of the delayed signal [6]. This method cannot be ap-plied to multi-component signals, since the IF so computed does not necessarily represent the frequency of any of the signal components [9, 10]. In addition, in Kay’s difference method, it is necessary to phase unwrap the estimated IF to
compensate for2π phase discontinuities in the differenced
phase. Phase derivatives may be estimated as the argument of the product of the analytic signal and the delayed signal (cf. [11]). This eliminates the need to phase unwrap, but still cannot be applied to multi-component signals. The LGD and CIF represent generalizations of the GD and IF functions, and with these generalizations, it is possible to correctly process multi-component signals (cf. [1, 12]). Sine waves may be es-timated accurately using only the CIF. A simple example of this is depicted in Figure 1. However, nonstationary multi-component signals may be easily processed by using the CIF and LGD functions jointly. The CIF and LGD surfaces may be computed by a number of methods. There is a nice closed form representation computed by Oppenheim and Schafer [13] and used extensively by Yegnanarayana et al. in spec-tral estimation and various speech applications (cf. [7, 8]). Equally effective is the delay-conjugate-product method pre-sented here (cf. [1, 11, 14]).
To estimate the CIF and LGD surfaces, we define two intermediate cross-spectral surfaces
The spectrogram (squared magnitude of the STFT surface), LGD and CIF surfaces may then be estimated as
|F (ω, T )|2≈C
Now, we assume that we have a signal which may be writ-ten as the (powrit-tentially infinite) sum of AM and FM modulated components,
method which isolates and simultaneously estimates the
lo-cus of each of the signal components fn in time and
fre-quency. To do this, we use the cross-spectral method used by Nelson to estimate instantaneous speech formant frequencies [1]. It was demonstrated that each signal component can be
accurately estimated directly from the STFT surfaceF (ω, T ),
as long as the surface satisfies a reasonable local separability condition. Separability is simply the condition that, for any
point(ω0, T0), at most one signal component can contribute
a significant amount of energy to the STFT surface at that
−80
140 145 150 155 160 165
Frequency
Figure1: Remapped spectrum of two sine waves computed from a single FFT computed from 128 samples of data Hanning win-dowed and zero filled to 512 points. Solid line: power spectrum (dB). Dotted line: remapped power spectrum (dB). (a) represents entire spectrum, (b) represents an expansion of the spectral bulge containing the second sine wave, (c) an expansion of the remapped spectrum.
point. Specifically, we assume that F (ω, T ) is separable at
(ω0, T0), if, for somen,
of the strongest signal components. If Fn is the dominant
signal component at(ω0, T0), then CIFf(ω0, T0)provides a
re-estimation of the frequency of that component observed at
(ω0, T0), and LGDf(ω0, T0)represents an estimated timing
error of the observation. The relationship
(ω, T )−→CIFf(ω, T ), T+LGDf(ω, T ) (10)
provides a remapping of the time-frequency plane, under which separable points on the STFT surface are remapped to points on curves representing the individual FM components of the signal. That is
CIFf(ω0, T0)≈IFfn
T0+LGDf
ω0, T0 , (11)
wherefnis the dominant signal component at the separable
point(ω0, T0)[1]. In effect, remapping the surface
concen-trates the surface components along the curves
ωn(T )=IFfn(T ). (12)
4. INDICATOR FUNCTIONS
The remapping (10) provides a redistribution of the entire TF surface, but the remapping is pointwise, and it is only valid at separable points, where one of the signal components has sig-nificant energy. For these points, remapping redistributes the surface energy along the curves (11) representing the func-tional FM form of the individual signal components. Under remapping, regions of the STFT surface, where the signal has little energy are randomly mapped, resulting in considerable speckled, low energy noise. While it is not always necessary to remove this noise to process the signal, it is generally bet-ter to remove it. Since the magnitudes of these unwanted components are generally small, it is possible to use magni-tude as a basis for removing some of the noise. However, the signal phase provides a convergence measure which tells us how well the surface components have converged under the remapping. This turns out to be quite useful, since it allows us to construct indicator functions, which measure the attrac-tion of the FM components, which comprise the signal. We present a method, based on mixed partial phase derivatives, which has proven to be very effective in removing much of the surface noise. The use of indicator functions was intro-duced by Nelson for the purpose of identifying excitation and nearly stationary resonance related STFT components [1]. Our application is slightly different, since we wish to iden-tify STFT components which represent the pitch harmonics nω(t), which are never stationary.
The excitation function we wish to estimate is relatively slowly varying. We may expect the rate of change to be
less than 500Hz/s. If we assume an analysis window of
20milliseconds, the signal frequency will vary by less than
10Hz within the window. We may, therefore, assume that the
signal is approximately stationary. We simply note that the mixed partial phase derivative may be represented as
∂2
for small. We may assume that surface components near to
each other will be attracted to the same signal component un-der remapping, and, since the signal is assumed to be approx-imately stationary, we expect the distance between remapped points to be less than the distance between the points before remapping. The mixed partial derivative (13) is, therefore, an indicator of the stationarity of the signal component to which the remapped surface locally converges. If the value of the mixed partial derivative is zero, the signal component may be assumed to be stationary. In testing on many speech
files, setting a threshold value of0.5resulted in the removal
of nearly all of the low energy speckled noise.
5. CORRELATION AND SPECTRAL REPRESENTATIONS
Finally, we address the problem of recovery of the pitch
fun-damental ω0. There are two fundamental problems which
must be addressed. Because the vocal tract acts as an infi-nite impulse (IIR) filter, the only pitch harmonics which are within the passband of one of the formants are observed in the speech spectrum. It is frequently the case that the funda-mental pitch frequency and many of the harmonics are not observable in the spectrum. Since we would like to recover the fundamental, we must either estimate the frequency of one of the stronger harmonics and then determine which har-monic it is, or we must somehow reconstruct the pitch fun-damental. Misidentification of the harmonic number results in a catastrophic error in the estimated pitch fundamental. To circumvent this problem, Nelson and Wysocki proposed applying the frequency-lag autocorrelation, which is the au-tocorrelation function applied along the frequency axis of the CIF surface [14]
where[a, b)is a frequency interval containing one or more
formants.
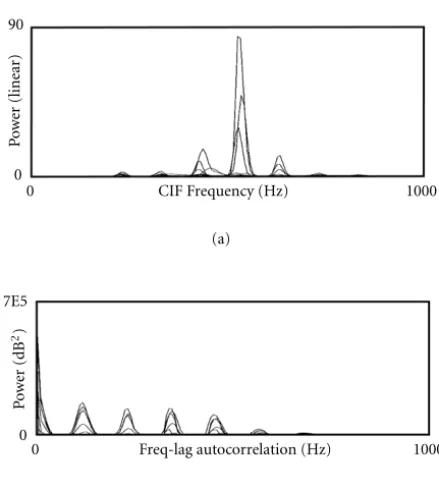
The effect of this application of the autocorrelation func-tion is that a bulge with large energy is produced at the pitch fundamental, since the formant bandwidths are wide enough to contain several pitch harmonics. This process is depicted in Figure 2, and an application to speech is depicted in Figure 3. The problem remains, however, that the pitch fundamental may not be the strongest component in the correlated spec-trum. To circumvent this problem, we propose combining two different representations of the signal. The first of these is the frequency correlated CIF surface, which is indexed by time and frequency, and has energy bulges at the pitch
Fundamental Autocorrelation function
No fundamental
0 ω02ω03ω04ω05ω06ω07ω08ω09ω0
0 ω02ω03ω04ω05ω06ω07ω08ω09ω0
Figure2: Correlation as floating point “GCD”. Top trace: simulated spectrum, with unit energy at the 2nd, 4th, 5th, 6th, 8th, and 9th harmonics. Bottom trace: autocorrelation function with energy at all harmonics.
0
0 CIF Frequency (Hz) 1000
P
o
w
er
(linear)
90
(a)
0
0 Freq-lag autocorrelation (Hz) 1000
P
o
w
er
(dB
2)
7E5
(b)
Figure3: An application of autocorrelation. (a) Several superim-posed power spectra (linear) with missing pitch fundamental. (b) Autocorrelation of CIF components of (a) (dB).
The correlation surfacerf(τ, T )has energy bulges at the pitch
fundamental periodP0and integer multiples ofP0. SinceP0
andω0are reciprocals of each other, the representation (15)
has energy bulges atω0/n,n= ±1,±2, . . . .The only
“fre-quency” for which both the frequency and time correlation functions representations of the signal have a common energy
bulge is the fundamentalω0.
The question now is, how can we calculate a time cor-relation surface, which has the same parameterization as the STFT and CIF surfaces. To do this, we start with the CIF
sur-0
0 Time-lag autocorrelation (ms) 40
Po
w
er
5E3
(a)
0
0 Reciprocally ordered time-lag autocorrelation (Hz) 1000
Po
w
er
5E3
(b)
0
0 Freq-lag autocorrelation (Hz) 1000
P
o
w
er
(dB
2)
7E3
(c)
0
0 Correlation spectrum (Hz) 1000
Po
w
er
1.4E8
(d)
Figure4: Correlation spectrum calculated from data represented in Figure 3. (a) Time-lag autocorrelation function. (b) Time-lag correlation function reciprocally ordered. (c) Frequency-lag auro-correlation function. (d) Correlation spectrum computed as point-wise product of representations (b) and (c).
face, calculate the second derivative indicator function equa-tion (13) and set to zero all CIF components for which the
indicator is larger than some(e.g.,=0.5). We then
Table1: Estimation of two tones in a clean environment.
Method Peak error 10dB BW 20dB BW
CS 0.00039 0.0028 0.0037
PS 0.444 10 13
time autocorrelation surface as
rF(ζ, T )= ∞
−∞
RF(Ω, T )2
eiΩ/ζdΩ, ζ=0. (16)
Since period and frequency are reciprocals of each other, the
surfacerF(ζ, T )is the time autocorrelation surface indexed
by frequency. We may therefore calculate the product surface
ρF(Ω, T )=rF(Ω, T )RF(Ω, T ). (17)
The functionρF(Ω, T )retains the phase of the surface
RF(Ω, T )and is expected to have a bulge of energy atΩ=ω0, but the energy in the harmonics are suppressed by the fac-tor rF(Ω, T ), and the subharmonics are suppressed by the
factor RF(Ω, T ). Experimentally, the combined
representa-tion ρF(Ω, T ) resulted in a 12 to 15dB improvement in harmonic/sub-harmonic suppression. An example of this process applied to speech is depicted in Figure 4.
6. EXPERIMENTAL RESULTS
The methods presented here have been applied to synthesized signals and many segments from speech databases. As a sim-ple examsim-ple of the remapping, a signal consisting of two sine waves was processed with a 257 long Hanning window, zero filled to 1024 samples. If we assume that the resolution, due to frequency quantization of the transform is unity, the average error in the remapped estimate was 0.00039, while the error in estimating the frequency as the index of the coefficient of the power spectrum with the largest magnitude was 0.444, an accuracy improvement factor of 1000, as depicted in Figure 1. The error in estimating the signal frequency by peak picking the powerspectrum and the remapped cross-spectrum are presented in Table 1, with the respective bandwiths of the
two methods measured at10dB and20dB below peak signal
power.
The process was applied to 412 files of data from the SWITCHBOARD database, nearly evenly split between male and female. The data represent actual telephone
conversa-tions, 8-bit mu-law encoded and sampled at8kHz. The STFT
surfaces were computed using a 513 sample Hanning window and a zero-filled 1024 point transform. The CIF and LGD sur-faces were computed using 1 sample delays in time and fre-quency, respectively. The STFT surfaces were remapped, and the noise speckle was removed with the indicator function
described above, with a threshold of=0.5. The
fundamen-tal was re-inserted using the frequency-lag autocorrelation function, and the fundamental was recovered unambiguously by combining the time-lag autocorrelation function and the spectrum, augmented by the frequency-lag autocorrelation. The spectrograms of two samples of speech are represented
0
100 120 140 160 180
Time (1 frame = 1/80 s)
500
F
requency
(Hz)
Figure5: Spectrogram of speech with missing pitch fundamental. For each frame, one star with a white center is displayed at the fundamental and 4th harmonic.
0 10 20 30
Time (1 frame = 1/80 s)
500
F
requency
(Hz)
Figure6: Spectrogram of noisy speech. For each frame, one star is displayed at the estimated fundamental.
in Figures 5 and 6. In Figure 5, the fundamental is missing in the spectrogram, but was recovered correctly in process-ing. In this display, the fundamental and 4th harmonic are superimposed on the spectrogram as black stars with white centers. For each 1/80 second frame of data, one such pair of
stars is displayed. In Figure 6, speech at about10dB SNR was
0
0 Hand-corrected autocorrelated (Hz) 350
P
Figure7: Comparison of pitch estimated using the methods of this paper and hand-corrected autocorrelation-based estimates. Diago-nal represents perfect agreement. Two solid lines represent±20Hz.
+
Figure8: Remapping of individual TF points on a lattice with time resolution1/80second and frequency resolution8Hz. (+: original points,∗: remapped points).
7. CONCLUSIONS
Cross-spectral methods provide a simple method for accu-rately estimating multi-component FM signals, and the use of the mixed partial indicator function effectively removes noise speckle. By combining representations of the frequency-lag and time-lag autocorrelation functions, has been demon-strated that it is possible to reconstruct and isolate the har-monic fundamental, even if it is absent from the original spectrum. The method has been implemented in MATLAB
on both a SUN workstation and a pentium400Mhz PC. On
both machines, the MATLAB implementations are slightly faster than real time. The method was compared on more than 1400 vowels to pitch estimates published by Hillenbrand et al. [15], which were made by first applying a correlation based method and then hand editing the correlation based esti-mates. No attempt was made to modify the estimates made by the process presented here. The standard deviation of the
dif-ferences between estimates made the two ways is7.14Hz. The
two methods are in close agreement, as depicted in Figure 7.
Finally, Figure 8 demonstrates the improved accu-racy of the presented method over the STFT. The
lat-tice of STFT points (time resolution = 1/80second and
frequency resolution = 8Hz) surviving the indication test
are displayed as +’s and the remapped points superimposed
as∗’s.
REFERENCES
[1] D. J. Nelson, “Cross-spectral methods for processing speech,” J. Acoust. Soc. Amer., vol. 110, no. 5, pp. 2575–2592, 2001. [2] J. L. Flanagan, Speech Analysis Synthesis and Perception,
Springer-Verlag, Berlin, 2nd edition, 1972.
[3] J. B. Thomas, An Introduction to Statistical Communication Theory, Wiley, New York, 1969.
[4] A. J. Gibbs, “The design of digital filters,”Australian Telecom-munication Research Journal, vol. 4, pp. 29–34, 1970, reprinted inDigital Signal Processing, eds. L. R. Rabiner and C. M. Rader, IEEE Press, New York, pp. 35–42, 1972.
[5] D. Gabor, “Theory of communication,” inProc. of the IEE, vol. 93, pp. 429–457, 1946.
[6] S. M. Kay, “Statistically/computationally efficient frequency estimation,” inProc. IEEE Int. Conf. on ASSP, pp. 2292–2295, New York, 1988.
[7] P. S. Murthy and B. Yegnanarayana, “Robustness of group-delay-based method for extraction of significant instants of excitation from speech signals,” IEEE Trans. on Speech and Audio Processing, vol. 7, no. 6, pp. 609–619, 1999.
[8] P. S. Murthy and B. Yegnanarayana, “Formant extraction from phase using weighted group delay function,” in Electronics Letters, vol. 25, pp. 1609–1611, 1989.
[9] L. Cohen, “Time-frequency distributions—a review,” inProc. of the IEEE, vol. 77, pp. 941–981, 1989.
[10] L. Cohen,Time-Frequency Analysis, Prentice-Hall, Englewood Cliffs, NJ, 1995.
[11] D. J. Nelson, “Special purpose correlation functions for im-proved signal detection and parameter estimation,” inProc. IEEE Int. Conf. on ASSP, pp. 73–76, April 1993.
[12] S. Umesh and D. J. Nelson, “Computationally efficient estima-tion of sinusoidal frequency at low SNR,” inProc. IEEE Int. Conf. on ASSP, vol. 5, pp. 2797–2800, May 1996.
[13] A. V. Oppenheim and R. W. Schafer,Digital Signal Processing, Prentice-Hall, Englewood Cliffs, NJ, 1975.
[14] D. J. Nelson and W. Wysocki, “Cross-spectral methods with an application to speech processing,” inProc. of the SPIE Adv. Sig. Proc. Conf., July 1999.
[15] J. M. Hillenbrand, L. A. Getty, M. J. Clark, and K. Wheeler, “Acoustic characteristics of American English vowels,”J. Acoust. Soc. Amer., vol. 97, no. 5, pp. 3099–3111, 1995.
Douglas Nelson was born in Minneapo-lis, Minnesota on 5 November 1945. He received a bachelor degree in Mathematics from the University of Minnesota in 1967 and a doctorate in Mathematics from Stan-ford University in 1972. After spending three years as an assistant professor at Carnegie-Mellon University, he accepted a position at the National Security Agency at Fort Meade, Maryland, where he has been from 1975 to